TBC
A Large Catalogue of Ultraluminous X-ray Source Candidates in Nearby Galaxies
Abstract
Since their discovery, Ultraluminous X-ray sources (ULXs) have attracted attention due to their combination of extreme luminosities and extra-nuclear locations. However, they are a fairly rare phenomenon, and attempts to investigate the general properties of the population have been hindered by a relative lack of known sources. Here, we present a large catalogue of ULX candidates including 655 detections of 475 discrete sources, based on the 2XMM Serendipitous Survey. To demonstrate the potential of such a resource, we present some scientific analysis of this population, focusing on the spectral turnover seen, often at 6 , in the highest quality ULX data. We also demonstrate how the recent reflection and Comptonisation interpretations of this feature may be distinguished observationally in the future, specifically using NGC 4517 ULX1, a previously unanalysed source with high quality data, as an example case.
keywords:
X-rays: binaries – black hole physics1 Introduction
Ultraluminous X-ray sources (ULXs) display the unusual combination of intense X-ray luminosities (exceeding erg s-1) and extra-nuclear locations, and as such have attracted considerable attention as attempts are made to identify the cause of their apparently extreme emission. It is well accepted that the majority of ULXs are likely to be accreting black holes, and most explanations put forward are based on one (or more) of the following ideas: ULXs may contain larger black holes than stellar-mass black holes hosted by typical X-ray binaries (XRBs), possibly intermediate-mass black holes (Colbert & Mushotzky 1999; dynamical friction arguments almost certainly rule out the majority of ULXs hosting supermassive black holes; Miller & Colbert 2004), they may be stellar-mass black holes radiating above their Eddington limit (Begelman 2002), or they may be sources that do not emit isotropically, hence luminosities calculated assuming isotropy overpredict their power output (King et al. 2001). In the latter case, the optical nebulae observed around many ULXs seem to rule out extreme anisotropy due to relativistic jets orientated towards us (e.g. a ‘micro-blazar’; Pakull & Grisé 2008), but modest collimation by e.g. ‘slim’ accretion discs remains an intriguing possibility.
Observationally, it has proven difficult to distinguish between these explanations, notably between the IMBH and stellar mass interpretations. For a recent review of this topic, see Roberts (2007). In large part, this is because reliable dynamical mass estimates are not yet available for any ULXs. However, ULXs are a fairly rare phenomenon, and a relative lack of known sources on which to base population studies has also hindered progress. Here, we present a large catalogue of X-ray detections of ULX candidates, as well as some analysis of its population, as a step towards addressing this issue.
2 The Catalogue
The main resource used in this work is the 2XMM Serendipitous Survey (2XMM; Watson et al. 2009). In the interest of brevity, here we list only the main steps taken to condense 2XMM into a catalogue of ULX candidates. For a full description of the data reduction see Walton et al. (in prep.).
-
•
2XMM was cross-correlated with the Third Reference Catalogue of Bright Galaxies (RC3; de Vaucouleurs et al. 1991), in order to select the X-ray sources within the elliptical galaxy regions.
-
•
X-ray luminosities were calculated using the full band (0.2–12.0 ) EPIC flux and galactic distances taken from Tully (1988) for galaxies with a recession velocity , or calculated assuming the Hubble flow otherwise (adopting for consistency between the two regimes).
-
•
Sources flagged as extended, and those fainter than erg s-1 by more than 1, were discarded.
-
•
A minimum detection significance of 3.5 was required, to reduce the contribution from spurious detections.
-
•
Sources within 7.5” of the galactic centre were excluded to minimize the contribution of low luminosity AGN.
-
•
Known contaminants (e.g. AGN, SNe) were removed.
These filtering measures produced a catalogue of 655 X-ray detections of 475 ULX candidates; 59 of these sources are nominally fainter than erg s-1 but agree with this limit within their 1 luminosity uncertainties. Of these 475 candidates, 307 are located in 142 spiral galaxies, with the remaining 168 located in 98 elliptical galaxies, despite the observations contributing to 2XMM covering twice as many ellipticals than spirals. This is most likely due to the link between ULXs and star formation (Swartz, Tennant & Soria 2009), as spiral galaxies typically display higher star formation rates than elliptical galaxies.
Based on the work of Moretti et al. (2003), we have used the 2XMM sensitivity maps to estimate the contribution from unidentified contaminants resolved from the cosmic X-ray background (e.g. background AGN) within the catalogue, and find it to be only 18 per cent. The fractional contamination is much higher for elliptical galaxies than spiral galaxies, due to a combination of them being larger in general, and so cover a greater cumulative sky area, and hosting an intrinsically less numerous ULX population.
3 High Energy Turnover
One of the key observational characteristics of ULX spectra, seen in the highest quality observations of ULXs to date, is that they display curvature in their high energy continuum (typically at 5–6 ); see Stobbart, Roberts & Wilms (2006) and Gladstone, Roberts & Done (2009). Such curvature is not frequently seen in the spectra of typical XRBs, hence may provide information on any physical differences between these types of X-ray source. In this section we attempt to investigate how widespread this spectral downturn is in the presented ULX population.
A full spectral analysis of each detection included in the catalogue is beyond the scope of this work, so we turn instead to count rate ratios of the pre-defined 2XMM energy bands, specifically between bands 3, 4 and 5 which cover 1.0–2.0, 2.0–4.5 and 4.5–12.0 respectively. We adopt a simple absorbed power-law model, and generate empirical relations between the count rate ratios of bands 3/4 and bands 4/5 and the photon index with PIMMS111http://heasarc.nasa.gov/docs/software/tools/pimms.html. These are used to estimate the band 5 count rate that should be observed assuming no curvature (constant ) from the band 3/4 ratio, which are in turn compared to the observed rates. An agreement between the two is determined such that negative values of imply fewer counts were observed than would be expected, i.e. that the spectrum does display a downturn. We repeat our analysis with estimates for the average neutral column density of and atom cm-2; previous work suggests should be in this range (e.g. Stobbart et al. 2006; Gladstone et al. 2009; Swartz et al. 2004)
| Curvature Parameter, () | ||
| \tmark[a] | ||
| Whole catalogue | ||
| Spiral galaxies | ||
| Elliptical galaxies | ||
| High quality | ||
| Medium quality | ||
| Low quality | ||
a Column densities are quoted in atom cm-2
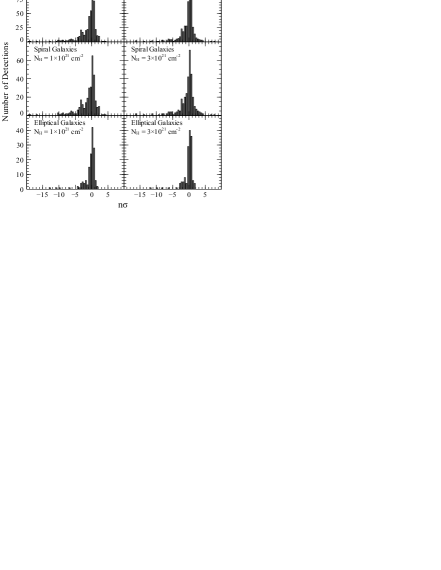
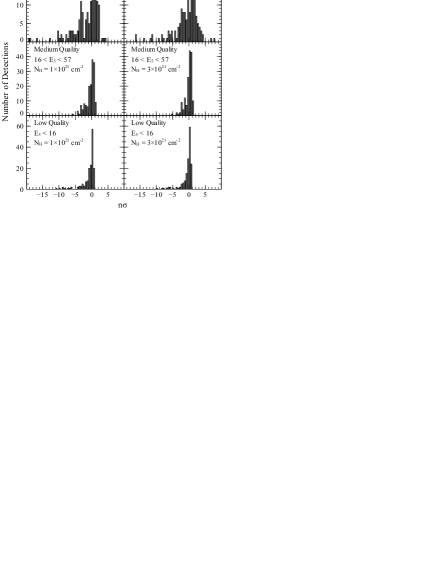
The EPIC-pn number distributions of for the whole catalogue and some of its various subsets are shown in Fig. 1. We do not show the distributions for the EPIC-MOS detectors for clarity, but note that they display similar trends. The top row of the left panel shows the distributions for the whole catalogue, and it is clear that they are not symmetrically distributed around zero, as would be expected if no particular spectral curvature was common in the population. Instead they are skewed and extended towards negative values of , implying the spectral curvature observed in the best quality ULX datasets may be seen in a significant fraction of our ULX population. In an attempt to quantify this, we define the curvature parameter in equation 1 (where is the number of detections); should be consistent with zero for symmetric distributions. Values are quoted in Table 1 for all the distributions shown in Fig. 1. The presence of background AGN will have diluted these values, as they do not typically show curved spectra. In addition to the distributions for the whole catalogue, the left panel of Fig. 1 shows a comparison between sources located in spiral and elliptical galaxies, while the right hand panel shows the evolution of these distributions with data quality, based on the number of band 5 EPIC counts.
| (1) |
It is clear from both the right hand panel in Fig. 1 and Table 1 that the proportion of the population which displays observable curvature increases with increasing data quality. This is as would be expected were the curvature intrinsically present in the majority of ULXs; as shown in Stobbart et al. (2006) it can be subtle to detect even in the best quality data. Many observations contributing to 2XMM would not have been long enough to reliably detect continuum curvature at high energies. The best quality subset of the catalogue, which should provide the most reliable estimate, suggests this curvature is a common property of ULX spectra. At first, when comparing the populations from spiral and elliptical galaxies it may seem that high energy curvature is more common in ULXs located in spiral galaxies. However, it is likely that is lower for the elliptical population than the spiral population. Taking this into consideration, we argue that high energy curvature is likely to be common to ULXs from both galaxy types. If so, given that ULX populations in spiral and elliptical galaxies are expected to be dominated by high- and low-mass binary systems respectively, the likelihood is that the curvature must be associated with processes in the inner regions of the X-ray source, rather than any environmental effect.
4 NGC 4517 ULX1
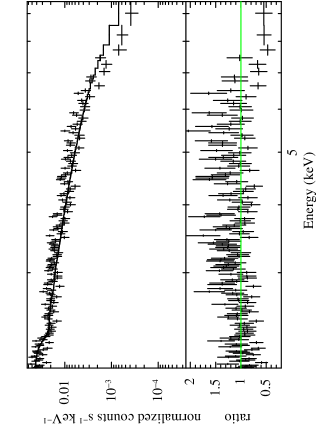
One source that came to light during the production of the catalogue, located in the edge-on spiral galaxy NGC 4517, is NGC 4517 ULX1. The archived EPIC spectrum contains 15500 counts, so the data meet the quality criterion of Stobbart et al. (2006) and can be considered amongst the best quality ULX data available. Following their example, we checked the 2.0–10.0 spectrum for curvature, comparing single and broken power-law models. Even allowing for absorption by a substantial column density of atom cm-2, as suggested from inspection of the full 0.3–10.0 spectrum, the broken power-law model is strongly favoured, with a break energy of 5.5 , implying the high energy continuum does indeed display curvature similar to that seen in the other high quality ULX spectra. This is demonstrated in Fig. 2.
A number of explanations of this feature have been proposed, including Comptonisation of seed photons from the accretion disc in an optically thick corona, which shrouds the inner regions of the disc (Gladstone et al. 2009) and a combination of relativistically blurred iron emission and absorption features, originating from the inner regions of the disc (Caballero-García & Fabian 2010). Other explanations invoke advection of radiation in the inner regions of a slim disc (Watarai, Mizuno & Mineshige 2001), although these have not been as successful at modelling the broad band X-ray spectra (see Gladstone et al. 2009). Both the Comptonisation and disc reflection interpretations are applied to the 0.3–10.0 spectrum and found to provide statistically equivalent representations of the data. We do not provide full details of the spectral modelling here (see Walton et al. 2010, submitted), but merely comment that the results in each case are similar to those obtained from the application of these models to other ULXs: the electron temperature of the corona is low and its optical depth is high if Comptonisation is correct, while the iron abundance of the disc is highly super-solar and the corona very compact (within a few ) if reflection is correct.
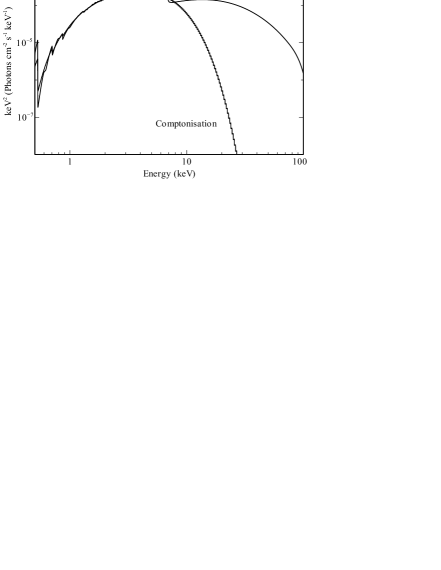
A detailed physical consideration of these results is presented in Walton et al. (2010), but neither model may currently be excluded, so other observational means are required to distinguish between them. In Fig. 3 the two models are compared after being extended beyond the XMM-Newton bandpass to 100 . Above 10 the Comptonisation model continues to curve downwards, while the reflection model turns back up. This is due to the presence of the ‘Compton hump’ in reflection spectra, a broad emission feature often observed at 30 , which arises due to the interplay between photoelectric absorption of low energy photons and Compton down-scattering of high energy photons within the reflecting medium. The presence of this feature leads to a large difference in the expected emission predicted above 10 by the two models. Currently the Comptonisation model is calculated assuming a purely thermal distribution of electrons, although it is likely the corona also contains a non-thermal population. Eventually Comptonisation from this population will arrest the downward curvature, however this may not become significant until energies , and we still expect there would be large differences between the two model predictions. Hence, even fairly short observations of ULXs above 10 could be very important in determining the underlying physical processes behind the observed emission from ULXs.
With current instrumentation such observations are only possible for M 82 X-1 due to the lack of high resolution X-ray imaging spectrometers that operate at such high energies. The indication from M 82 X-1 is that the spectrum continues to curve downwards, which favours the Comptonisation interpretation for this source (Miyawaki et al. 2009). The launch of the hard X-ray imagers aboard NuSTAR222http://by134w.bay134.mail.live.com/default.aspx?wa=wsignin1.0 and Astro-H333http://astro-h.isas.jaxa.jp/si/index_e.html over the next few years should enable such observations to be carried out for a large number of ULXs.
ACKNOWLEDGEMENTS
DJW is financially supported by STFC, and ACF thanks the Royal Society. Some of the figures have been produced with Jeremy Sanders’ Veusz444http://home.gna.org/veusz/ plotting package.
References
- [Begelman(2002)] Begelman, M. C. 2002, ApJ, 568, L97
- Caballero-García & Fabian (2010) Caballero-García M. D., Fabian A. C., 2010, MNRAS, 402, 2559
- Colbert & Mushotzky (1999) Colbert E. J. M., Mushotzky R. F., 1999, ApJ, 519, 89
- de Vaucouleurs et al. (1991) de Vaucouleurs G., de Vaucouleurs A., Corwin H. G., Jr., Buta R. J., Paturel G., Fouque P., 1991, The Third Reference Catalogue of Bright Galaxies (New York: Springer)
- Gladstone et al. (2009) Gladstone J. C., Roberts T. P., Done C., 2009, MNRAS, 397, 1836
- King et al. (2001) King A. R., Davies M. B., Ward M. J., Fabbiano G., Elvis M., 2001, ApJ, 552, L109
- Miller & Colbert (2004) Miller M. C., Colbert E. J. M., 2004, International Journal of Modern Physics D, 13, 1
- Miyawaki et al. (2009) Miyawaki R., Makishima K., Yamada S., Gandhi P., Mizuno T., Kubota A., Tsuru T. G., Matsumoto H., 2009, PASJ, 61, 263
- Moretti et al. (2003) Moretti A., Campana S., Lazzati D., Tagliaferri G., 2003, ApJ, 588, 696
- Pakull & Grisé (2008) Pakull M. W., Grisé F., 2008, in AIoP Conference Series, Vol. 1010, A Population Explosion: The Nature & Evolution of X-ray Binaries in Diverse Environments, p. 303
- Roberts (2007) Roberts T. P., 2007, Astrophysics and Space Science, 311, 203
- Stobbart et al. (2006) Stobbart A.-M., Roberts T. P., Wilms J., 2006, MNRAS, 368, 397
- Swartz et al. (2004) Swartz D. A., Ghosh K. K., Tennant A. F., Wu K., 2004, ApJS, 154, 519
- Swartz et al. (2009) Swartz D. A., Tennant A. F., Soria R., 2009, ApJ, 703, 159
- Tully (1988) Tully R. B., 1988, Nearby Galaxies Catalog (Cambridge: Cambridge Universiry Press)
- Watarai et al. (2001) Watarai, K.-y., Mizuno, T., & Mineshige, S. 2001, ApJ, 549, L77
- Watson et al. (2009) Watson M. G. et al., 2009, A&A, 493, 339