Short-Range Order in Fe-Rich Fe-Cr Alloys as Revealed by Mössbauer Spectroscopy
Abstract
The distribution of Cr atoms in Fe100-xCrx alloys with within the first two coordination shells, , around probe 57Fe atoms was studied using Mössbauer Spectroscopy. Clear evidence was found that the distribution is not random but instead characteristic of a given atomic configuration, ( being the number of Cr atoms in , and that in ). The behavior was described quantitatively in terms of average SRO parameters, (for ), (for ) and (for ) as well as in terms of a local short-range order (SRO) parameter, , for each pair . A change of sign (inversion) was found both in and in , though going with in opposite directions. No inversion was observed in , which was either positive or negative depending on the metallurgical state of the samples. These findings prompt a revision of current interpretation of experimental and theoretical results relevant to the issue.
pacs:
75.40.-s, 76.80.+y, 81.30.Hd,Among various binary alloys of iron, Fe-Cr alloys occupy a special role for both scientific and technological reasons. They can be treated as good systems for testing models and theories, especially those relevant to magnetism where different phases are exhibited depending on alloy composition. Burke83 . Their crystallographic structure, which for many years was regarded as homogenous bcc over the whole concentration range, turned out to be much more complex when a tetragonal -phase and a miscibility gap were discovered. The latter two phenomena are on one hand of interest per se and have been the subject of intensive study Xiong10 , and on the other hand, are also of a great importance technologically, namely in the production of important grades of stainless steels Lo09 for which the Fe-Cr alloys are the basic ingredient. Consequently, their useful properties such as a good resistance to high-temperature corrosion and good mechanical properties (toughness, ductility and welding ability) may be severely degraded if the -phase precipitates or phase separation into Fe-rich and Cr-rich phases occurs.
Recently there has been increased interest in Fe-Cr alloys. This is driven both by the discovery of giant magnetoresistance in Fe/Cr layers Gruenberg86 and also by the potential for Fe-Cr-based steels to be used in the construction of a new generation of power plants – advance fusion and fission reactors or high power accelerator spallation targets Mansu04 . In the latter application, the materials undergo irradiation damage which can seriously degrade their mechanical properties. On the lattice scale, the radiation causes lattice defects, and, consequently, a redistribution of Fe/Cr atoms that can result in a short- range order (SRO) or phase decomposition into Fe-rich and Cr-rich phases.
According to previous neutron diffraction (ND) studies Mirebeau84 ; Mirebeau10 , the Cowley SRO-parameter, , was found to change its sign at . This finding was qualitatively confirmed by a Mössbauer spectroscopic (MS) study Filippova00 , yet the value of the critical concentration was not determined. Additionally, theoretical calculations predicted the existence of such an inversion, but for different values of Caro05 ; Lavrentiev07 . The aim of the present investigation was to study the issue in more detail using MS, since this method applied to the Fe-Cr alloys can provide precise and relevant information on SRO for each statistically meaningful atomic configuration, , where is the number of Cr atoms in the first-nearest neighbor shell, , and is the number in the second-nearest neighbor shell, Dubiel74 ; Dubiel81 . Such information would be much more detailed than the one recently found with ND Mirebeau10 , where the inversion of the SRO parameter was found as the average over the volume.
There are 63 different atomic configurations possible for the bcc structure within such volume. Although for a random distribution the probability of most of them, , is very small, all those with are measurable using MS. This improvement over the information available by ND means that MS can be used as a more adequate basis for quantitative verification of different theoretical models pertinent to the issue Caro05 ; Lavrentiev07 ; Turchi94 ; Wallenius04 .
57Fe Mössbauer spectra were recorded at 295 K in transmission mode on four series of Fe100-xCrx alloys, I, II, IIIa and IIIb, with different histories and composition using a standard spectrometer with a sinusoidal drive and a 57Co/Rh source of 14.4 keV gamma rays.
Samples of series I, with , were 40 years old. They were prepared as follows: Armco iron and 4N - purity chromium were melted in a vacuum induction furnace. After melting, they were kept in a liquid state for about 10 minutes and cooled down to an ambient temperature. The ingots were next forged into flat bars (8 mm thick), which were subsequently cold-rolled into 2 mm thick tapes. The tapes were annealed in a vacuum at 840∘C for 1h, and then cooled in a furnace. The 2 mm thick tapes were next rolled down to a thickness of 0.1 mm from which 20-30 m thick foils were obtained again by cold rolling. Samples of series II, three years old and with , were prepared in a similar way. Examples of the spectra recorded on these samples are shown in Fig. 1.
The series IIIa and IIIb samples were EFDA/EURATOM model Fe-Cr alloys that had been prepared in 2007. They were delivered in the form of bars 10.9 mm in diameter, in a recrystallized state after cold reduction of 70% and then heat treated for 1h under pure Ar flow at the following temperatures: 750∘C for Fe94.4Cr5.6, 800∘C for Fe89.75Cr10.25 and 850∘C for Fe85Cr15 followed by air cooling. For the MS measurements, a slice 1 mm thick was cut off from each bar using a diamond saw, and was subsequently cold-rolled down to a final thickness of 20-30 m. Samples obtained in this way constituted the series IIIa. Some of the latter in the form of 20mm-diameter circular foils were annealed at 800 ∘C for 4h under Ar flow followed by a liquid nitrogen quenching. The samples that underwent this heat treatment constituted the series III. All the spectra were analyzed in the same way i.e. with the two-shell model. It was assumed that only Cr atoms situated within the and neighbor-shells cause measurable changes in spectral parameters i.e. the hyperfine field, , and the isomer shift, . It was also assumed that the changes both in and in were additive i.e. , where or and stands for the change in due to one Cr atom in (index 1) or in (index 2).
This procedure proved to be successful in the analysis of the spectra of various Fe-rich Fe-X alloys (e.g. Ref.15). Each spectrum was treated as composed of a number of subspectra, , corresponding to a particular atomic configuration, . Its relative spectral area was equal to the probability of the atomic configuration associated with the spectrum, . The latter is the relevant quantity for a quantitative description of a real atoms distribution over lattice sites in a given sample. Theoretically, the probabilities for the random case, ), can be calculated from the formula:

| (1) |

Most of the possible 63 configurations have vanishingly small probabilities, and can therefore be neglected. In practice, one usually takes into account only the most probable ones in order to fulfill the condition: . This condition significantly reduces from 63 to e. g. (), (), (). Using the above described procedure, we have successfully fitted all the measured spectra with the following values of the spectral parameters: kOe, kOe, mm/s and mm/s which agree well with those previously reported Dubiel74 ; Dubiel81 . The values of determined from the analysis for the most significant 6 configurations are presented in Fig. 2 together with the corresponding ones calculated from formula (1). It is clear that the actual distribution is, in general, not random, and the degree and direction of deviation from randomness is characteristic of a given atomic configuration. In particular, the values are close to the ones for all values, though those determined for the series IIIb show a systematic deviation. The distribution of atoms is partly random for , and configurations, and non-random for and configurations. In order to quantitatively describe the actual departure from the randomness for , we introduce the following measure for the short-range order:
| (2) |
This SRO parameter can be regarded as an adequate measure for the departure of the actual distribution of atoms from the random distribution, and its value can be easily determined based on the spectral parameters. when the actual probability of finding an atomic configuration around the probe Fe atom is higher than the one for the random distribution (atomic short-range ordering), and otherwise (clustering). In our opinion this definition is simple and justified, at least from the viewpoint of MS, as it ascribes a positive value of to a larger number of Cr atoms within shell, as seen by the probe Fe atoms, than the one expected for the random case, and a negative value otherwise.

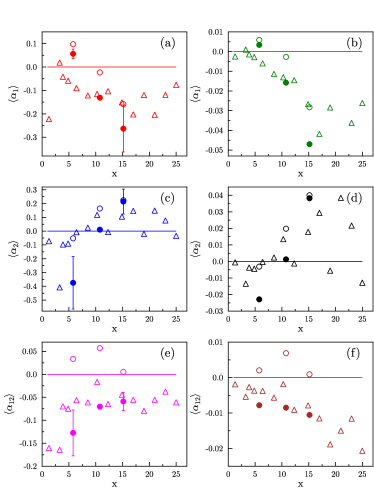
Values of obtained from formula (2) for all 4 series are presented in Fig. 3. Here it is clearly evident that the ’s are characteristic of a given and that they also depend on the samples’ histories. It is evident then that the actual distribution of atoms in the Fe-Cr system is much more complex than the one obtained from the ND experiments Mirebeau84 ; Mirebeau10 . The inversion of the SRO parameter at , can locally (i.e. in terms of ) only be seen for the following configurations: (1,0) series I and IIIa, (2,0) series IIIa and IIIb, and perhaps (0,0) series IIIa. The opposite inversion takes place at in . On the other hand, over the whole concentration range showing a saturation behavior. It is also worth noticing that for , but only for the cold-rolled samples.
An important issue is the effect of heat treatment on the distribution. To get some insight one can compare the ’s calculated for series IIIa and IIIb. Interestingly, for some configurations viz. (0,0) and (1,0) they are significantly different, while for other viz. (0,1), (2,0) and (1,1) they are similar. In these circumstances, it seems reasonable to also introduce average values of to the description of the actual distribution of Cr atoms in the studied samples. Thus, the average for the shell, , that for the shell, , and also the average for the shells, , can be defined as follows:
| (3) |
where for , respectively, and is the average number of Cr atoms in , is that in , and is that in as determined from analysis of the Mössbauer spectra. The three symbols with subscript represent the same quantities but calculated for the random distribution. A graphical illustration of , and is displayed in Fig. 4 on the left-hand side of the panel. Alternatively, following Wittle and Campbell Wittle85 , and staying with the model and bcc structure, one can define , and as follows:
| (4) |
where and for , respectively. It should be remembered that both definitions of the average differ in sign in comparison to that introduced by Cowley.
The average SRO parameters obtained using formula (4) are presented on the right-hand side panel of Fig. 4. Quantitative agreement between the corresponding average SRO parameters obtained with the two approaches can be readily seen. Concerning the crucial question of the inversion, one can definitely observe its existence both in and , especially in the samples of series IIIa and IIIb. However, the inversions go in opposite directions: on increasing one observes a change from ordering to clustering in the former and a change from clustering to ordering in the latter. The critical concentration at which the inversion occurs depends on the samples’ histories. As a consequence of such behavior, the SRO parameter averaged over the volume, , does not show any inversion: the one for series IIIa is positive, hence revealing the short-range ordering with a maximum at , while that for series IIIb is negative, hence indicating the clustering effect. Similar effect was revealed for a series of Au-Fe, where the alloys were found to exhibit either clustering of Fe atoms or atomic short-range ordering depending on their metallurgical state and heat treatment Wittle84 . The presently reported behavior is completely different than the one found with ND Mirebeau84 ; Mirebeau10 .
To summarize, the distribution of Cr atoms in the shells was studied quantitatively using Mössbauer spectroscopy on the level of atomic configurations in 4 series of Fe-Cr with having different metallurgical states. Clear evidence was found that the actual distribution is much more complex than the one accepted to date from ND Mirebeau84 ; Mirebeau10 . In particular, it was shown here that the change of the SRO-parameter sign observed with ND at 10-11 at% Cr and regarded as an experimental confirmation of various theoretical calculations including SRO itself Lavrentiev07 , is exclusively a feature of the shell. The average SRO parameter for the shell was also found to exhibit inversion but in the opposite direction, i.e. from clustering to ordering. Consequently, the SRO parameter averaged over the two shells, , does not show any inversion and its actual value depends on the metallurgical state of the samples: for the cold-rolled ones its is positive, hence indicative of the atomic short-range ordering, whereas for the quenched samples it is negative, indicating the existence of clustering. In other words, the actual distribution of atoms in the Fe-Cr alloys is very sensitive to their metallurgical state. This, in turn, reflects the fact that the initial state of these alloys is metastable. Upon heating the alloys decompose into Fe-rich and Cr-rich phases. The degree of the decomposition, hence the actual distribution of atoms (and values of the SRO-parameters) depends on samples’ metallurgical histories as experimentally revealed in this study, and theoretically demonstrated by performing Monte Carlo atomistic simulations Erhart08 .
Acknowledgements.
This work, supported by the European Communities under the contract of Association between EURATOM and IPPLM, was carried out within the framework of the European Fusion Development Agreement, and it was also supported by the Ministry of Science and Higher Education, Warszawa. J. Aguilar is thanked for his help in improving the language.References
- (1) S.K. Burke, R. Cywinski, J.R. Davis and B.D. Rainford, J. Phys. F: Metal Phys., 13, 451 (1983).
- (2) W. Xiong, M. Selleby, Q. Chen, J. Odqvist and Y. Du, Rev. Solid State Mater. Sci. 35, 125 (2010).
- (3) K. H. Lo, C. H. Shek and J. K. L. Lai, Materials Sci. Eng. R: Reports 65, 39 (2009).
- (4) P. Gruenberg, R. Schreiber, Y. Pang, M. B. Brodsky and H. Sowers, Phys. Rev. Lett. 57, 2442 (1986).
- (5) L. K. Mansu, F. Rowcliffe, R.K. Nanstad, S.J. Zinkle, W.R. Corwin and R.E. Stolleret, J.Nucl. Mater 329-333, 166 (2004).
- (6) I. Mirebeau, M. Hennion and G. Parette, Phys. Rev. Lett. 53, 687 (1984).
- (7) I. Mirebeau and G. Parette, Phys. Rev. B 82, 104203 (2010).
- (8) N. P. Filippova, V. A. Shabashov and A. L. Nikolaev, Phys. Met. Metallogr. 90, 145 (2000).
- (9) A. Caro, D. A. Crowson and M. Caro, Phys. Rev. Lett. 95, 075702 (2005).
- (10) M. Yu. Lavrentiev, D. Drautz, D. Nguyen-Manh, T. P. C. Klaver and S. L. Dudarev, Phys. Rev. B 75, 014208 (2007).
- (11) S. M. Dubiel and K. Krop, J. Phys. (Paris) 35, C6-459 (1974).
- (12) S. M. Dubiel and J. Zukrowski, J. Magn. Magn. Mater. 23, 214 (1981).
- (13) P. E. A. Turchi, L. Reinhard and G. M. Stocks, Phys. Rev. B 50, 15542 (1994).
- (14) J. Wallenius, P. Olsson, C. Lagerstedt, N. Sandberg, R. Chakova and V. Pontikis, Phys.Rev. B 69, 094103 (2004).
- (15) S. M. Dubiel and W. Zinn, J. Magn. Magn. Mater. 45, 298 (1984).
- (16) G. L. Wittle and S. J. Campbell, J. Phys. F: Metal Phys. 15, 693 (1985).
- (17) G. L. Wittle and S. J. Campbell, Phys. Rev. B 30, 5364 (1984).
- (18) P. Erhart, A. Caro M. Serrano de Caro and B. Sadigh, Phys. Rev. B 77, 134206 (2008).