Non-linear effect of uniaxial pressure on superconductivity in CeCoIn5
Abstract
We study single-crystal CeCoIn5 with uniaxial pressure up to 3.97 kbar applied along the c-axis. We find a non-linear dependence of the superconducting transition temperature on pressure, with a maximum close to 2 kbar. The transition also broadens significantly as pressure increases. We discuss the temperature dependence in terms of the general trend that decreases in anisotropic heavy-fermion compounds as they move towards three-dimensional behavior.
pacs:
71.27.+a, 74.62.Fj, 74.70.TxI Introduction
The past three decades have seen the discovery of several new groups of superconductors that do not conform to the previous understanding of superconductivity: the cuprates bm , heavy fermions CeCu2Si2 , organics bechgaard , and the very recent pnictide superconductors pnictide . Although behavior varies substantially among these materials, in many cases even for closely related compounds, similarities include deviations from Fermi liquid behavior varma ; moser ; Stewart01 ; wu and the appearance of superconductivity near the quantum critical point where a magnetic transition is suppressed to zero temperature mathur ; kotegawa ; taillefer . From these observations a general picture is emerging of superconductivity with Cooper pairs bound by magnetic fluctuations. The magnetic interaction favors the -wave pairing symmetry which has been established in the cuprates tsuei and indicated elsewhere tou ; stockert ; kasahara ; ichimura . Low dimensionality also facilitates superconductivity monthoux2001 ; monthoux2002 , since the pairing interaction falls off less quickly in lower dimensions.
The 115 superconductors, CeMIn5 (M = Co petrovicco , Rh hegger , Ir petrovicir ) and the isostructural PuMGa5 (M = Co sarrao , Rh wastin ) family, are useful materials for testing effects of dimensionality. Both families are heavy-fermion superconductors that also exhibit antiferromagnetism, sometimes in concert with superconductivity. They are clean, relatively easy to grow, and close to a quantum critical point at ambient pressure. The crystal structure is tetragonal, with alternating layers of CeIn3 and MIn2, resulting in anisotropic superconductivity. For the 115 materials, including several alloys where is a mixture of two elements, the superconducting transition temperature increases linearly with within a family pagliuso , with the same logarithmic derivative for both the Ce and Pu families thompsoniso . In several cases uniaxial pressure adheres to this trend. By pushing the planes together, -axis pressure should decrease . On the other hand, -axis pressure increases the plane separation and should increase . For CeIrIn5, uniaxial pressure has exactly these effects, with measurements made both directly dix and by extracting the zero-pressure from thermal expansion data oeschler . However, for CeCoIn5 thermal expansion measurements yield positive for -axis pressure as well as -axis pressure oeschler . Here we apply uniaxial pressure along the -axis of CeCoIn5 to investigate this apparent exception to the pattern that higher dimensionality corresponds to lower .
II Materials & Methods
Single crystal samples were grown in aluminum crucibles containing stoichiometric amounts of Ce and Co with an excess of In. The crucibles were sealed in quartz tubes, heated to 1150∘C, and slow cooled to 450∘C. Excess flux was removed by centrifuging. CeCoIn5 grows in thin platelets perpendicular to the crystal c-axis. To prepare samples for pressure measurements, we remove excess In and polish the faces to be smooth and free from chips or defects. The polishing also ensures that the faces used for pressure application are parallel to each other. We confirm the sample orientation by x-ray diffraction, both before and after polishing.
We apply uniaxial pressure using a bellows setup activated with helium gas from room temperature. The pressure cell is permanently mounted on an Oxford Instruments dilution refrigerator. A piezo sensor monitors the force in the pressure column (see dix for pressure setup schematic). With this setup we can reach a maximum pressure of about 10 kbar, depending on the cross-sectional area of the sample, and we can change pressure in controlled steps smaller than 0.1 kbar.
From the mass and thickness of the sample, we compute its cross-sectional area, which we then use to calculate the pressure on the sample. The data shown here are from a sample with mass 2.43 mg and area 1.54 m2. Measurements of a second sample of mass 0.57 mg and area 3.63m2 agreed qualitatively, although the smaller sample size reduced the quality of the data.
A screw at one end of the pressure column controls its overall length. We finger-tighten this screw while watching the pressure monitor, applying a pressure of about 0.05 kbar to the sample at room temperature. This ensures that the sample remains in place while we load the cryostat into its dewar and cool from room temperature. Thermal contraction during cooling may alter the initial pressure; in previous work the initial pressure appeared on the order of 0.3 kbar at low temperatures dix . The values for applied pressure used in this paper do not include any offset for this initial pressure, but our initial transition temperature measurements agree to better than 3 mK with measurements taken outside of the pressure cell, suggesting a pressure offset of less than 0.2 kbar. Once the cryostat is below 4 K we fill the bellows with liquid helium. We then increase pressure in steps of about 0.5 kbar. The maximum pressure used here is 3.97 kbar.
In the present measurements, the effect of pressure is reversible. The data shown here come from three pressure sweeps on the sample, the first reaching a maximum pressure of 2.60 kbar, the second 3.97 kbar, and the third 2.86 kbar. After completing the measurements, we confirmed by x-ray diffraction that the sample retained its original crystal structure.
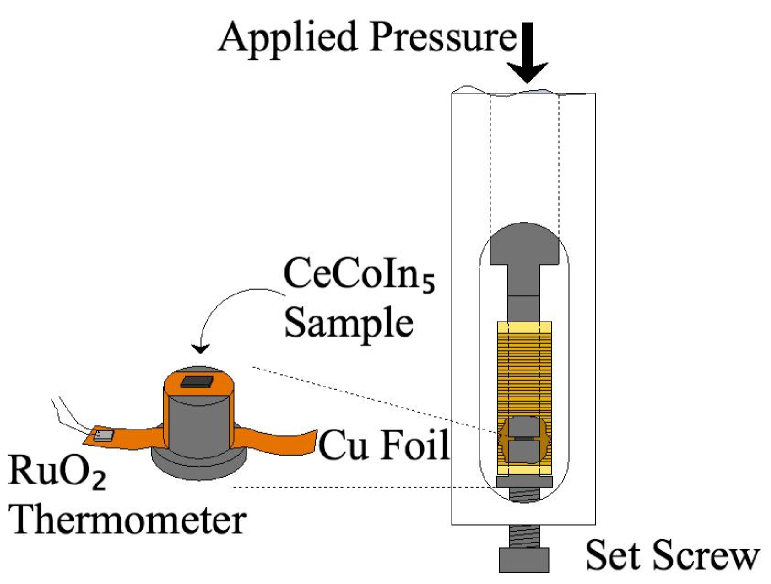
We detect the transition to the superconducting state with a balanced ac susceptibility coil that accommodates the pressure shafts and the sample, as shown in Figure 1. The outer primary coil is 0.9 inches long with inner diameter 0.35 inches. It contains approximately 600 turns of 0.006-inch diameter Cu wire and with our usual settings generates a field of about 0.3 gauss parallel to the pressure shafts. The inner secondary coils are wound on a cylinder of diameter of 0.16 inches and contain 200 turns each of 0.002-inch diameter Cu wire. The inner coils are separated by 0.325 inches, so that there is minimal field interaction between coils. We monitor the signal from the inner coils using a Linear Research LR-700 resistance bridge. We position the sample so that its entire volume is contained within the bottom coil of the secondary.
To ensure that the sample is in thermal contact with the mixing chamber we varnish Cu foil to the pressure shafts on either side of the sample, with the other end of each foil varnished to the mixing chamber. Even with the Cu foil heat-sink, the large thermal mass of the pressure setup results in a temperature lag between the sample and the mixing chamber during temperature scans. We monitor the sample temperature directly using a RuO2 thermometer mounted on the copper foil within 0.5 inches of the sample.
III Results & Discussion
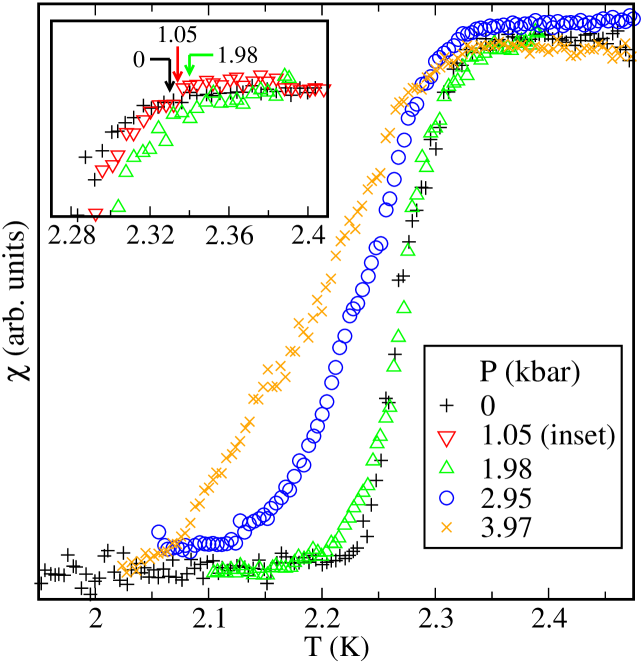
Figure 2 shows the superconducting transition for several pressures. The substantial broadening of the transition with pressure ensures that the midpoint moves down in temperature with increasing pressure. However, as shown in the inset, the onset behaves differently, initially moving to higher temperature as pressure increases. Here we identify the onset as the highest temperature at which the susceptibility deviates from its constant normal-state value . We plot the onset temperatures in Figure 3. The parabola, with a maximum near 2 kbar, is a least-squares fit.

The non-monotonic makes it particularly important to consider the meaning of the transition width. The width , defined as the difference between onset of superconductivity and the leveling off of at the low end of the transition, increases from 112 mK at zero pressure to 270 mK at 3.97 kbar, as shown in Figure 4. One possible source for the broadening is non-uniformity in the applied pressure. The pressure dependence of would then lead to different transition temperatures in different parts of the sample. Non-uniform pressure could arise from a variety of effects, such as defects in the sample, variation in its cross-sectional area, indium inclusions, surface irregularities, a tilt in the pressure column, or an intrinsic inhomogeneity in the pressure distribution within the sample.
We have estimated the pressure inhomogeneity needed to produce the observed broadening, using various assumptions for the distribution of -axis pressure within the sample. We find that to account for the entire increase in transition width, the pressure would have to vary by more than a factor of two across the sample. This is a consequence of the scant change ie the onset temperature of the transition. Either the transition has little pressure dependence, in which case variations of pressure would not broaden it, or a portion of the sample remains at very low pressure even when the nominal applied pressure is large. While a non-constant sample cross-section or an angle of the pressure spacers could cause inhomogeneity of a few percent, a 100% variation is far too extreme.
The pressure could also vary in direction within the sample, creating stress with an -axis component. However, as noted above, both thermal expansion measurements oeschler and the expected influence of dimensionality suggest that -axis pressure would increase , which would not explain the broadening of the transition to lower temperatures that we observe. We conclude that if the transition width truly signifies pressure variation, it must indicate a broad distribution of pressure within the sample from an intrinsic mechanism.
Interestingly, in resistivity measurements on CeCoIn5 under hydrostatic pressure the transition width has a minimum near kbar, the pressure which maximizes sidorov . The transition width in specific heat exhibits a similar crossover behavior, remaining nearly constant at low pressures but increasing substantially once pressure exceeds 16 kbar knebel . The agreement between the different types of measurement is evidence that the width has an intrinsic component. Here, our susceptibility measurements show a substantial increase in transition width from the lowest pressures. If uniaxial -axis pressure shifts CeCoIn5 away from the reached with hydrostatic pressure, our observed broadening could plausibly be a tuning effect related to the width changes observed with other techniques.
In the following discussion, we bypass concerns about the origin of the transition width by focusing on the onset temperature.

The small initial slope of the curve is consistent with a nearby maximum. Fits to our data suggest mK/kbar. The value derived from thermal expansion measurements oeschler is even lower, 7.5 mK/kbar. This pressure dependence is substantially less than that of CeIrIn5, where direct -axis pressure measurements give mK/kbar dix and thermal expansion suggests mK/kbar oeschler . The pressure effect is also smaller than for -axis pressure in CeCoIn5, where thermal expansion suggests that increases 29 mK/kbar oeschler . One natural explanation is that CeCoIn5 at ambient pressure is near an extremum of , particularly for -axis pressure.
Non-monotonic behavior is less common with uniaxial pressure than with its hydrostatic counterpart. Partly this is because the maximum pressure is generally much smaller in the uniaxial case, due to sample breakage or to the limits of the pressure apparatus. In addition, a given hydrostatic pressure may affect an isotropic sample in a similar way as three times as much uniaxial pressure, a consequence of applying the pressure simultaneously along all three perpendicular axes. Together these considerations mean that a typical uniaxial pressure measurement tunes a sample over a narrow regime compared to standard hydrostatic techniques.
Hydrostatic pressure measurements on CeCoIn5 sidorov find a maximum near 16 kbar. Without anisotropic effects, one might expect an equivalent uniaxial pressure to be 48 kbar, since hydrostatic pressure involves stress applied along all three axes simultaneously. In fact, we find the maximum at a drastically lower pressure near 2 kbar.
The maximum in requires competing factors tending to raise or lower with applied pressure. The former is the hybridization of neighboring atomic orbitals, which increases as pressure reduces the atomic spacing. Using a tight binding approximation harrison ; wills ; kumar , we estimate the fractional change in the hybridization between the Ce -electrons and the In -electrons as 0.0665% per kbar of -axis pressure. An analogous calculation for CeIrIn5 gives 0.0653% change per kbar. The similarity of these values implies that the main difference between the materials lies elsewhere.
The other key factor is sample anisotropy, which decreases with -axis pressure. This is consistent with our maximum occurring at a much lower pressure than in hydrostatic pressure measurements, since hydrostatic pressure has a more uniform effect on the sample. Calculations also predict that lower anisotropy should decrease superconducting transition temperatures monthoux2002 .
The calculations track , where is the spin-fluctuation temperature that appears to set the energy scale in magnetically mediated superconductors. In principle is related to the normal-phase susceptibility just above . However, that susceptibility is quite small and changes only a few percent per kbar. All told the changes in are about five orders of magnitude smaller than the size of the superconducting transition. Our signal has comparable shifts from other factors, possibly including small changes in sample shape and position with applied pressure. The lack of a measurement of limits the comparison possible with monthoux2002 . As a rough illustration of how the behavior of dominates that of , we refer to data under hydrostatic pressure nicklas . There , which is assumed proportional to the temperature of the resistance maximum, increases about 6% per kbar. We ignore anisotropy in the spin fluctuations and reduce the change in to 2% per kbar to adjust between hydrostatic and uniaxial pressure. With our measured superconducting transition temperatures, we then plot as a function of applied -axis pressure, shown in the inset to Figure 3. The pressure dependence of dominates, changing the low-pressure maximum to a near-linear monotonic decrease. Although the actual dependence of on -axis pressure may differ from this estimate, for any increase of roughly the same size mainly determines the behavior of .
That increases with -axis pressure is consistent with recent experiments on CeIn3/LaIn3 heterostructures shishido . As the thickness of the CeIn3 layers decreases, the effective mass increases, an effect attributed to the changing dimensionality. Our -axis pressure tends to increase dimensionality, which corresponds to a decreasing effective mass and increasing .
IV Conclusion
We present ac-susceptibility measurements on a single crystal sample of CeCoIn5 under direct uniaxial pressure up to 3.97 kbar, along the c-axis. We find a weak, non-linear dependence of on pressure. After an initial increase to a maximum near 2 kbar, then decreases. The decrease agrees qualitatively with the behavior expected from decreasing the anisotropy parameter . We also find an increase in transition width as pressure increases which is much larger than would be expected from nonuniformity in pressure and may be connected to our tuning through the superconducting phase.
References
- (1) J.G. Bednorz and K.A. Müller, “Possible high superconductivity in the Ba-La-Cu-O system,” Z. Phys. B: Condens. Matter 64, 189 (1986).
- (2) F. Steglich, J. Aarts, C.D. Bredl, W. Lieke, D. Meschede, W. Franz, and H. Schäfer, “Superconductivity in the presence of strong Pauli paramagnetism,” Phys. Rev. Lett. 43, 1892 (1979).
- (3) D. Jérome, A. Mazaud, M. Ribault, and K. Bechgaard, “Superconductivity in a synthetic organic conductor (TMTSF)2PF6,” J. Physique Lett. 41, 95 (1980).
- (4) Y. Kamihara, H. Hiramatsu, M. Hirano, R. Kawamura, H. Yanagi, T. Kamiya, and H. Hosono, “Iron-based layered superconductor: LaOFeP,” J. Am. Chem. Soc. 128, 10012 (2006).
- (5) C.M. Varma, P.B. Littlewood, S. Schmitt-Rink, E. Abrahams, and A.E. Ruckenstein, “Phenomenology of the normal state of Cu-O high-temperature superconductors,” Phys. Rev. Lett. 63, 1996 (1989); 64, 497 (1990).
- (6) J. Moser, M. Gabay, P. Auban-Senzier, D. Jérome, K. Bechgaard, and J.M. Fabre, “Transverse transport in (TM)2X organic conductors: possible evidence for a Luttinger liquid,” Eur. Phys. J. B 1, 39 (1998).
- (7) G.R. Stewart, “Non-Fermi-liquid behavior in - and -electron metals,” Rev. Mod. Phys. 73, 797 (2001); 78, 743 (2006); http://rmp.aps.org.
- (8) W. Wu, A. McCollam, I. Swainson, P.M.C. Rourke, D.G. Rancourt, and S.R. Julian, “A novel non-Fermi-liquid state in the iron-pnictide FeCrAs,” Europhys. Lett. 85, 17009 (2009); arXiv:0811.3439.
- (9) N.D. Mathur, F.M. Grosche, S.R. Julian, I.R. Walker, D.M. Freye, R.K.W. Haselwimmer, and G.G. Lonzarich, “Magnetically mediated superconductivity in heavy fermion compounds,” Nature 394, 39 (1998).
- (10) H. Kotegawa, H. Sugawara, and H. Tou, “Abrupt emergence of pressure-induced superconductivity of 34 K in SrFe2As2: a resistivity study under pressure,” J. Phys. Soc. Jpn. 78, 013709 (2009); arXiv:0810.4856.
- (11) L. Taillefer, “Scattering and pairing in cuprate superconductors,” Annual Rev. Cond. Matt. Phys. 1, 51 (2010); arXiv:1003.2972.
- (12) C.C. Tsuei and J.R. Kirtley, “Pairing symmetry in cuprate superconductors,” Rev. Mod. Phys. 72, 969 (2000).
- (13) H. Tou, Y. Kitaoka, K. Asayama, C. Geibel, C. Schank, and F. Steglich, ”-wave superconductivity in antiferromagnetic heavy-fermion compound UPd2Al3 – evidence from 27Al NMR/NQR studies,” J. Phys. Soc. Jpn. 64, 725 (1995).
- (14) O. Stockert, J. Arndt, A. Schneidewind, H. Schneider, H.S. Jeevan, C. Geibel, F. Steglich, and M. Loewenhaupt, “Magnetism and superconductivity in the heavy-fermion compound CeCu2Si2 studied by neutron scattering,” Physica B 403, 973 (2008).
- (15) Y. Kasahara, T. Iwasawa, Y. Shimizu, H. Shishido, T. Shibauchi, I. Vekhter, and Y. Matsuda, “Thermal conductivity evidence for a pairing symmetry in the heavy-fermion CeIrIn5 superconductor,” Phys. Rev. Lett. 100, 207003 (2008); arXiv:0712.2604.
- (16) K. Ichimura, K. Nomura, and A. Kawamoto, “Scanning tunneling spectroscopy on organic superconductors,” Jpn. J. Appl. Phys. 45, 2264 (2006).
- (17) P. Monthoux and G.G. Lonzarich, “Magnetically mediated superconductivity in quasi-two and three dimensions,” Phys. Rev. B 63, 54529 (2001).
- (18) P. Monthoux and G.G. Lonzarich, “Magnetically mediated superconductivity: Crossover from cubic to tetragonal lattice,” Phys. Rev. B 66, 224504 (2002); cond-mat/0207556.
- (19) C. Petrovic, P.G. Pagliuso, M.F. Hundley, R. Movshovich, J.L. Sarrao, J.D. Thompson, Z. Fisk, and P. Monthoux, “Heavy-fermion superconductivity in CeCoIn5 at 2.3 K,” J. Phys.: Condens. Matter 13, L337 (2001); cond-mat/0103168.
- (20) H. Hegger, C. Petrovic, E.G. Moshopoulou, M.F. Hundley, J.L. Sarrao, Z. Fisk, and J.D. Thompson, “Pressure-induced superconductivity in quasi-2D CeRhIn5,” Phys. Rev. Lett. 84, 4986 (2000).
- (21) C. Petrovic, R. Movshovich, M. Jaime, P.G. Pagliuso, M.F. Hundley, J.L. Sarrao, Z. Fisk, and J.D. Thompson, “A new heavy-fermion superconductor CeIrIn5: a relative of the cuprates,” Europhys. Lett. 53, 354 (2001); cond-mat/0012261.
- (22) J.L. Sarrao, L.A. Morales, J.D. Thompson, B.L. Scott, G.R. Stewart, F. Wastin, J. Rebizant, P. Boulet, E. Colineau, and G.H. Lander, “Plutonium-based superconductivity wtih a transition temperature above 18 K ,” Nature 420, 297 (2002).
- (23) F. Wastin, P. Boulet, J. Rebizant, E. Colineau, and G.H. Lander, “Advances in the preparation and characterization of transuranium systems,” J. Phys.: Condens. Matter 15, S2279 (2003).
- (24) P.G. Pagliuso, R. Movshovich, A.D. Bianchi, M. Nicklas, N.O. Moreno, J.D. Thompson, M.F. Hundley, J.L. Sarrao, and Z. Fisk, “Multiple phase transitions in Ce(Rh,Ir,Co)In5,” Physica B, 312-313, 129 (2002); cond-mat/0107266.
- (25) J.D. Thompson, J.L. Sarrao, and F. Wastin, “Superconductivity in the isostructural heavy-fermion compounds CeMIn5 and PuMGa5,” Chin. J. Phys., 43, 499 (2005).
- (26) O.M. Dix, A.G. Swartz, R.J. Zieve, J. Cooley, T.R. Sayles, and M.B. Maple, “Anisotropic dependence of superconductivity on uniaxial pressure in CeIrIn5,” Phys. Rev. Lett. 102, 197001 (2009); arXiv:0908.4366.
- (27) N. Oeschler, P. Gegenwart, M. Lang, R. Movshovich, J.L. Sarrao, J.D. Thompson, and F. Steglich, “Uniaxial pressure effects on CeIrIn5 and CeCoIn5 studied by low-temperature thermal expansion,” Phys. Rev. Lett. 91, 76402 (2003).
- (28) V.A. Sidorov, M. Nicklas, P.G. Pagliuso, J.L. Sarrao, Y. Bang, A.V. Balatsky, and J.D. Thompson, “Superconductivity and quantum criticality in CeCoIn5,” Phys. Rev. Lett. 89, 157004 (2002).
- (29) G. Knebel, M.-A. Measson, B. Salce, D. Aoki, D. Braithwaite, J.P. Brison, and J. Flouquet, “High-pressure phase digrams of CeRhIn5 and CeCoIn5 studied by ac calorimetry,” J. Phys.: Condens. Matter 16, 8905 (2004).
- (30) W.A. Harrison, Elementary Electronic Structure, (World Scientific Publishing Co., Singapore, 1999)
- (31) J.M. Wills and W.A. Harrison, “Interionic interactions in transition metals,” Phys. Rev. B 28, 4363 (1983).
- (32) R.S. Kumar, A.L. Cornelius, and J.L. Sarrao, “Compressibility of CeMIn5 and Ce2MIn8 (M=Rh, Ir, and Co) compounds,” Phys. Rev. B 70, 214526 (2004); cond-mat/0405043.
- (33) M. Nicklas, R. Borth, E. Lengyel, P.G. Pagliuso, J.L. Sarrao, V.A. Sidorov, G. Sparn, F. Steglich, and J.D. Thompson, “Response of the heavy-fermion superconductor CeCoIn5 to pressure: roles of dimensionality and proximity to a quantum-critical point,” J. Phys.: Condens. Matter 13, L905 (2001); cond-mat/0108319.
- (34) H. Shishido, T. Shibauchi, K. Yasu, T. Kato, H. Kontani, T. Terashima, Y. Matsuda, “Tuning the dimensionality of the heavy fermion compound CeIn3,” Science 327, 980 (2010).