Study of Isotopic Fractions and Abundances of the Neutron-capture Elements in HD175305
Abstract
The chemical abundances of the metal-poor stars are excellent information for setting new constraints on models of galaxy chemical evolution at low metallicity. In this paper we present an attempt to fit the elemental abundances observed in the bright, metal-poor giant HD 175305 and derive isotopic fractions using a parametric model. The observed abundances can be well matched by the combined contributions from s- and r-processes material. The component coefficients of the r- and s-processes are and , respectively. The Sm isotopic fraction in this star where the observed neutron-capture elements were produced is predicted to be , which suggests that even though the r-process is dominantly responsible for synthesis of the neutron-capture elements in early galaxy, the onset of the s-process has already occurred at this metallicity of .
keywords:
stars: isotopic fraction, stars: abundances, nucleosynthesis1 Introduction
The abundances of neutron-capture elements in metal-poor halo stars are now providing important clues to the chemical evolution and early history of the Galaxy. These elements are predominantly produced through successive neutron-capture reactions in two processes known as the rapid (r-) and the slow (s-) process (Burbidge et al. 1957). The r-process is usually associated with the explosive environment of Type II supernovae (SNeII), although this astrophysical site has not been fully confirmed yet (Cowan et al. 1991, Sneden et al. 2008). The s-process is further divided into two categories: the weak s-component and the main s-component. It is well known that massive stars are the sites of the so-called weak component of s-process nucleosynthesis, which is mainly responsible for the production of lighter elements (Sr, Y, and Zr) (Lamb et al. 1977; Raiteri et al. 1991, 1993; The et al. 2000). The main s-process component is responsible for the production of the heavier s-process elements (heavier than Ba). Observational evidence and theoretical studies have identified the main s-process site in low- to intermediate-mass () stars in the asymptotic giant branch (AGB) (Busso et al. 1999). The observations in the ultra-metal-poor halo star CS 22892-052 revealed that the abundances of the heavier () stable neutron-capture elements are in remarkable agreement with the scaled solar system r-process pattern, called as “main r-process stars” (Sneden et al. 2003). More recent work (Sneden et al. 2009), utilizing updated experimental atomic data to determine more accurate abundances, has confirmed this agreement. However, some very metal-poor stars, such as HD 122563 and HD 88609, have high abundance ratios of light neutron-capture elements Sr, Y, and Zr, while their heavy ones (e.g., Eu) are very deficient (Honda et al. 2007 ). Such objects possibly record the abundance patterns produced by another process and are called as a “weak r-process” star (Izutani, Umeda, & Tominaga 2009). Thus, two separate r-processes are required to explain the elemental abundances in metal-poor stars .
The solar system heavy-nuclide abundance distribution has been detected in most detail, so it is usually regarded as a standard pattern, which is usually compared with the elemental abundances in metal-poor stars. Cowan et al. (1996) measured abundances of the r-process peak elements Os and Pt in the metal-poor halo star HD 126238 () and found that neither the solar pure r-process nor the total solar abundance can fit all of the observed abundances of the heavy elements in this star. They obtained a better fit by taking some fraction of s-process abundances and adding it to the solar r-process distribution, which suggested that the onset of the s-process has already occurred at this metallicity. As the abundances of the metal-poor halo stars can be used as a probe of the conditions that existed early in the history of the Galaxy, it is important and necessary to determine the relative contributions from the individual neutron processes to the abundances of heavy elements in metal-poor stars.
Additional evidence of the earliest Galactic neutron-capture nucleosynthesis can be obtained by isotopic abundance determinations of metal-poor stars (Sneden et al. 2002; Lambert & Allende Prieto 2002; Aoki et al. 2003; Mashonkina & Zhao 2006; Kratz et al. 2007). Since the isotopic abundances can be directly used to assess the relative s- and r-process contributions without the smearing effect of multiple isotopes, they should be more fundamental indicators of neutron-capture nucleosynthesis. Recently, Roederer et al. (2008) measured abundances and isotopic fractions of neutron-capture elements in the metal-poor star HD 175305 () and concluded that the observed Sm isotopic fraction is consistent with r-process origin. However, they found that a scaled solar system r-process pattern cannot fit not only Ba and Eu abundance but also the Sm isotopic fraction measured from the line at 4604.17 Å. Clearly, the close examination of elemental abundances and isotopic fraction in this object is very important for a good understanding of the abundance pattern of neutron-capture element in the metal-poor stars. These reasons motivated us to investigate the ratio of s- and r- processes in this star. It is interesting to adopt the parametric model for metal-poor stars to study the relative contributions from the s- and r- processes that could reproduce the observed abundance pattern found in this star. The parametric model of metal-poor stars is described in Sect. 2. The calculated results are presented in Sect. 3 in which we also discuss the characteristics of the s- and r-process nucleosynthesis. Conclusions are given in Sect. 4.
2 Parametric model of Metal-Poor Stars
Generally, the solar system nuclide abundance distribution serves as the standard pattern or basis when investigating the abundance distribution of neutron-capture elements. However, the observational studies have shown that the abundance patterns of heavy elements in population II stars differ obviously from the solar (Spite & Spite 1978; Gratton et al. 1994), and the same is true even for population I stars (Woolf et al. 1995). Based on this idea, Zhang et al. (1999) presented a model for calculating the abundances of heavy elements in metal-poor stars. Their results showed that the observed abundances of heavy elements of the sample of Gratton & Sneden (1994) can be well matched by an abundance mix of the solar r- and s-processes, especially for elements heavier than Ba.
We explored the origin of the heavy neutron-capture elements () in HD 175305 by comparing the observed abundances with predicted r- and s-process contributions. Since the weak r-process that is responsible for the elements in the Sr-Ag range would have to provide negligible contributions to Ba while the main r-process is known to produce the heavy elements from Ba and beyond (Montes et al. 2007), we ignore the contributions of weak r-process to heavier elements () in our calculations. The th element’s abundance in the star can be calculated as follows (Zhang et al. 1999):
| (1) |
where and are the abundances of the th element produced by the r-process and the main s-process in solar material, respectively. and are the component coefficients that correspond to the relative contributions from the r-process and the main s-process to the element abundances in metal-poor stars, respectively. Here we choose the solar component coefficients as a standard and assume all of them are equal to 1, while the solar r- and s-process abundances are adopted from Arlandini et al. (1999).The La value in solar system is updated from O’Brien et al. (2003), and the Hf value from Lawler et al. (2007).
Our goal is to find the parameters which best characterize the observed data. The reduced is defined
where is the uncertainty on the observed abundance, is the number of elements used in the fit, and is the number of free parameters varied in the fit. We then took linear combinations of the solar s- and r-process abundances (adopting ) exploring the full range of parameter space (i.e., considering values from 0.0001 to 5.0000 times the solar s- and r-process abundances). For each combination of s- and r-process abundances,we compared the predicted abundance ratios with the observed abundance ratios. The best fit between theoretical predictions and observational data correspond to the smallest value of . For a good fit the reduced should be a number that is not very far from 1, which it means that should be of order unity. Based on equation (1), we carry out the calculation to fit the abundance profile observed in HD 175305, in order to look for the minimum in the two parameter space formed by , and .
3 Results and Discussion
Using the observed data in HD 175305 (Roederer et al. 2008), the model parameters can be obtained. The s- and r-processes component coefficients of HD 175305 are , , which implies that this star is not r-only star. Taking the values of , and into Eq. (1), the abundances of all the neutron-capture elements in HD 175305 are obtained as listed in Table 1. Columns (3), (4), and (5) of Table 1 give the abundances of the r-process and main s-components, and the total abundances in this halo star HD 175305, respectively. In columns (6) and (7), we list the r- and s-process fractions to the total abundances. These numbers are useful in understanding the relative dominance of two processes for a given neutron-capture element in HD 175305.
| Element | Z | |||||
|---|---|---|---|---|---|---|
| Ba | 56 | 6.89E-02 | 9.33E-02 | 1.62E-01 | 0.425 | 0.575 |
| La | 57 | 9.71E-03 | 9.29E-03 | 1.90E-02 | 0.511 | 0.489 |
| Ce | 58 | 2.16E-02 | 2.46E-02 | 4.62E-02 | 0.467 | 0.533 |
| Pr | 59 | 6.93E-03 | 2.32E-03 | 9.25E-03 | 0.750 | 0.250 |
| Nd | 60 | 2.46E-02 | 1.31E-02 | 3.77E-02 | 0.653 | 0.347 |
| Sm | 62 | 1.41E-02 | 2.17E-03 | 1.63E-02 | 0.866 | 0.134 |
| Eu | 63 | 7.42E-03 | 1.60E-04 | 7.58E-03 | 0.979 | 0.021 |
| Gd | 64 | 2.26E-02 | 1.44E-03 | 2.40E-02 | 0.940 | 0.060 |
| Tb | 65 | 4.52E-03 | 1.24E-04 | 4.65E-03 | 0.973 | 0.027 |
| Dy | 66 | 2.71E-02 | 1.66E-03 | 2.87E-02 | 0.942 | 0.058 |
| Ho | 67 | 6.63E-03 | 1.98E-04 | 6.83E-03 | 0.971 | 0.029 |
| Er | 68 | 1.68E-02 | 1.21E-03 | 1.80E-02 | 0.933 | 0.067 |
| Tm | 69 | 2.65E-03 | 1.43E-04 | 2.80E-03 | 0.949 | 0.051 |
| Yb | 70 | 1.35E-02 | 2.09E-03 | 1.56E-02 | 0.866 | 0.134 |
| Lu | 71 | 2.38E-03 | 1.80E-04 | 2.56E-03 | 0.930 | 0.070 |
| Hf | 72 | 8.01E-03 | 2.16E-03 | 1.02E-02 | 0.787 | 0.213 |
| Ta | 73 | 9.87E-04 | 2.44E-04 | 1.23E-03 | 0.802 | 0.198 |
| W | 74 | 4.74E-03 | 2.11E-03 | 6.86E-03 | 0.692 | 0.308 |
| Re | 75 | 4.00E-03 | 1.38E-04 | 4.14E-03 | 0.967 | 0.033 |
| Os | 76 | 4.91E-02 | 1.80E-03 | 5.09E-02 | 0.965 | 0.035 |
| Ir | 77 | 5.27E-02 | 2.59E-04 | 5.30E-02 | 0.995 | 0.005 |
| Pt | 78 | 1.03E-01 | 1.95E-03 | 1.05E-01 | 0.981 | 0.019 |
| Au | 79 | 1.42E-02 | 3.10E-04 | 1.45E-02 | 0.979 | 0.021 |
| Hg | 80 | 1.07E-02 | 4.94E-03 | 1.56E-02 | 0.684 | 0.316 |
| Ti | 81 | 3.60E-03 | 3.97E-03 | 7.57E-03 | 0.475 | 0.525 |
| Pb | 82 | 5.03E-02 | 6.50E-02 | 1.15E-01 | 0.436 | 0.564 |
| Bi | 83 | 1.11E-02 | 2.01E-04 | 1.13E-02 | 0.982 | 0.018 |
NOTE.— log(El)=logN(El)+1.54
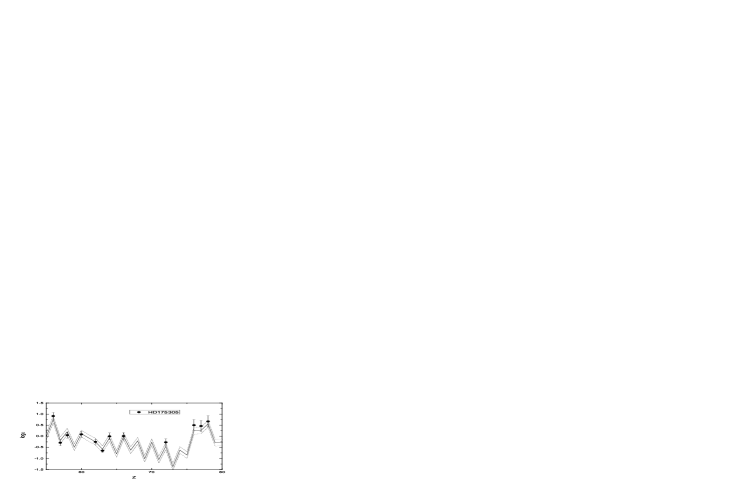
The Ba and Eu abundances are useful for investigating contributions of the s- and r-processes corresponding to those in metal-poor stars. In the Sun, the elemental abundances of Ba and Eu consist of significantly different combinations of s- and r-process isotope contributions, with s:r ratios for Ba and Eu of and , respectively (Arlandini et al. 1999). We explored the contributions of s- and r-processes for these two elements in HD 175305. In Table 1 we display the s-process fractions calculated from equation (1) for the sample star. Clearly, for the star listed in Table 1, the s:r ratios for Ba and Eu are and , which are smaller than the ratios in the solar system, but the contributions from the s-process is not negligible at all, especially for Ba. Because the predictions are based on the observed abundances of the neutron-capture elements and the solar abundances, both the measurement errors of the stellar abundances and uncertainties of the solar abundances must be involved in the predictions. The errors of predictions resulting from the measurement errors of the ratios can be calculated by our model; the mean error is about dex in log. In Fig. 1, the solid line is the predicted abundances curve, and the two dotted lines show the error range of the predictions. In order to facilitate the comparisons of the theoretical abundances with the observations, the heavy element observed abundances are marked by filled circles. The figure shows that the model predictions for abundances starting with Ba fit well the observed data for HD 175305. The curves produced by the model are consistent with the observed abundances within the error limits (i.e.,). The agreement of the model results with the observations provides strong support for the validity of the parametric model.

It was possible to isolate the contributions corresponding to the s- and r-processes for isotopes by our parametric model, which provide the knowledge of the isotopic composition of the neutron-capture elements. In the recent studies, the usefulness of Sm, as a diagnostic tool, is presented to indicate the relative contribution of r- versus s-process material (Lundqvist et al. 2007). Roederer et al. (2008) measured isotopic fractions of three neutron-capture elements including Sm in the metal-poor star HD 175305. The Nd, Sm and Eu isotopic fractions are defined by
| (2) |
In the Sun, the elemental abundance of Sm consists of s- and r-process isotope contributions, with Sm isotopic fraction for pure s- and r-processes of 0.21 and 0.64, respectively (Arlandini et al. 1999). In HD 175305, the measured Sm isotopic fraction (Reoderer et al. 2008) doesn’t suggest a pure r-process origin. The calculated Sm isotopic fraction is . In Figure 2, we summarize the Nd, Sm and Eu isotopic fractions and the difference between values for pure s- and r-processes. The dash dotted lines are the predicted isotopic fraction of Nd, Sm and Eu, and then the dotted and dashed lines show the isotopic fractions of Nd, Sm and Eu for pure s- and r-processes, respectively. The observed isotopic fractions of Nd, Sm and Eu are marked by black filled squares. The figure shows that the model predictions for isotopic fractions of Nd, Sm and Eu are in good agreement with the observed data for HD 175305 too. Our calculations agree well with not only abundances of neutron-capture elements, but also isotopic fractions, especially the Sm isotopic fraction measured from the line at 4604.17 Å. The results mean that most of the neutron-capture elements are synthesized by a combination of the s- and r-processes in this metal-poor star, while the contributions from the s-process is not negligible at all, especially for Ba. Unfortunately, the Nd isotopic wavelength splits are simply too small for the lines that were available so that very large error bars attend the estimates, as shown in Figure 1a. The Nd isotopic fraction, derived from our calculation is not suggestive of an pure r-process origin. Our Eu isotopic fraction, is shown to be a reasonable match for the measurements derived from only the 4129 Å, which is in good agreement with the solar photospheric ratio (Lawler et al. 2001) and the precise Eu meteoritic ratio of = 0.478 (Lodders 2003).
We also discuss the dependence of the calculated abundances log(Ba) and log(Eu) on the component coefficients and uncertainty of the parameters. In the parametric model, Ba, La and Ce, which are produced dominantly by s-process in the solar system, are at the same degree of rank/standing. Because log(Ba) is more sensitive to the s-process component coefficient among three elements (i.e., Ba, La and Ce), we choose Ba as the representative element. Figures 3 and 4 show the calculated log(Ba) and log(Eu), as a function of the the r-process component coefficient in a model with a fixed and as a function of the main s-process component coefficient with a fixed , respectively. These are compared with the observed abundances from HD 175305. There is only one region of in Figure 3, (1), in which both the observed abundances log(Ba) and log(Eu) can be accounted for within the error limits. The bottom panel in Figure 3 displays the value calculated in our model, and there is a minimum, with , at with a 1 bar. It is clear from Figure 3 that log(Eu) is very sensitive to the r-process component coefficient . From Figure 4 we can see that the abundance log(Eu) is insensitive to and allows for a wider range while log(Ba) is sensitive to , . There is only one region of in Figure 4, (1), in which both the observed abundances log(Ba) and log(Eu) can be accounted for within the error limits.
It is interesting to investigate the component coefficients of pure r-process stars. The abundances in pure r-process star can be fit well by the solar-system r-only values () (Sneden et al. 2008). This means that our model can be used to pure r-process stars. As an example, for pure r-process star CS 22892-052, the component coefficient of r-process is about and the component coefficient of s-process is about , which is consistent with the meaning of pure r-process star.


4 Conclusions
We have studied the neutron-capture element abundances of HD 175305 in parametric model which includes the mixing of s- and r-processes. The component coefficients and contain some important information for the chemical evolution of the Galaxy. We find from our results that the relative contribution from the individual neutron-capture process to the heavy element abundances in HD 175305 are not similar to that in the solar system. means that, except for the effect of metallicity, the contributions from the r-process to the heavy element abundances in this star is larger than that in the solar system. Moreover, means that the productions of the main r-process are more remarkable than those of the main s-process in the star. The trends of the r-process and the main s-process productions in the early galaxy are obviously different. According to the theory of stellar evolution, the r-process nuclei are produced during the stage of massive supernova explosions, which can be synthesized in significant amounts in the early Galaxy, therefore the r-process contributions to the heavy elements are dominant at low metallicities. In contrast, the main s-process occurs during the phase of thermal pulsation in intermediate and low mass AGB stars, and the production of the s-process elements needs Fe-seed source, so its contributions to the heavy elements are very small in the early Galaxy. Thus, the present study is confined to where AGB stars would contribute in small amounts to the interstellar medium, which are consistent with the theory of galactic chemical evolution (Travaglio et al.1999).
We have also calculated isotopic fractions of Eu, Sm, and Nd in the metal-poor star HD 175305. The isotopic fractions in HD 175305 are interpreted by isotopic mixes for pure s- and r-processes. In HD 175305, our Sm isotopic fraction , which is consistent with the measurements from the 4424 Å, 4604 Åand 4719 Ålines, suggests that even though the r-process is dominantly responsible for synthesis of the neutron-capture element in early galaxy, the onset of the s-process has already occurred at this metallicity of . means that, except for the effect of metallicity, the contributions from the main s-process to the heavy element abundances in this star have reach solar system values. The isotopic abundance fractions, derived from the our model, are in excellent agreement with the observed values, which means that the results have extended the agreement to the isotopic level.
Recent isotopic determinations of heavy neutron-capture elements in metal-poor stars have yielded new insights on the roles of the r- and s- processes nucleosynthesis in the early galaxy. The star HD 175305 is a metal-poor star that has observed isotopic fractions of the neutron-capture elements. The neutron-capture elemental abundance pattern and isotopic fraction of this star can be explained by a star formed in a molecular cloud that had been polluted by both s- and r-process material. Overall the number of stars with measured neutron-capture isotopic fractions is still small. To underpin these studies, accurate abundance analysis for similar metal-poor stars are required. Obviously, it is needed that a more precise knowledge of the neutron-capture isotopic composition of these stars. Further isotopic studies of these stars will reveal the characteristics of the s- and r-processes at low metallicity, such as stellar nucleosynthesis and the history of enrichment of neutron-capture elements in the early galaxy.
Acknowledgments
We thank the referee for an extensive and helpful review, containing very relevant scientific advice that improved this paper greatly. This work has been Supported by the National Natural Science Foundation of China under Nos 10673002, 10973006, 10847119 and 10778616, the Natural Science Foundation of Hebei Provincial Education Department under Grant No 2008127, the Science Foundation of Hebei Normal University under Grant No L2007B07 and the Natural Science Foundation of Hebei Proince under Grant no. A2009000251.
References
- Aoki et al. (2003) Aoki, W., Ryan, S.G., Iwamoto, N., Beers, T.C., et al. 2003, ApJ, 592, L67
- Arlandini et al. (1999) Arlandini, C., Kppeler, F., Wisshak, K., Gallino, R., Lugaro, M., Busso, M., & Straniero, O. 1999, ApJ, 525, 886
- Burbidge et al. (1957) Burbidge, E. M., Burbidge, G. R., Fowler W. A., & Hoyle, F. 1957, Rev. Mod. Phys, 29, 547
- Busso et al. (1999) Busso M., Gallino R.,Wasserburg G.J. 1999, ARA&A, 37, 239
- Cowan et al. (1991) Cowan, J. J., Thielemann, F. -K, & Truran, J. W. 1991, ARA&A, 29, 447
- Cowan et al. (1996) Cowan, J. J., Sneden, C., Truran, J. W., & Burris, D. L. 1996, ApJ, 460,L115
- Cowan et al. (2005) Cowan, J. J., et al. 2005, ApJ, 627, 238
- Fulbright et al. (2000) Fulbright, J. P. 2000, AJ, 120, 1841
- Gratton et al. (1994) Gratton, R. G., & Sneden, C. 1994, A&A, 287, 927
- Honda et al. (2007) Honda, S., Aoki, W., Ishimaru, Y., & Wanajo, S. 2007, ApJ, 666, 1189
- Izutani et al. (2009) Izutani, N., Umeda, H., & Tominaga, N. 2009, ApJ, 692, 1517
- Kratz et al. (2007) Kratz, K.-L., Faroqui, K., Pfeiffer, B., Truran, J. W., Sneden, C., Cowan, J. J. 2007, ApJ, 662, 39
- Lamb (1977) Lamb, S., Howard, W. M., Truran, J. W., & Iben, I., Jr. 1977, ApJ,217, 213
- Lambert&Allende (2002) Lambert D. L., &Allende Prieto C. 2002, MNRAS, 335, 325
- Lawler (2001) Lawler, J. E., Wickliffe, M. E., den Hartog, E. A., & Sneden, C. 2001, ApJ, 563, 1075
- Lawler (2007) Lawler, J. E., Den Hartog, E. A., Labby, Z. E., Sneden, C., Cowan, J. J., & Ivans, I. I. 2007, ApJS, 169, 120
- Lodders (2003) Lodders, K. 2003, ApJ, 591, 1220
- Lundqvist (2007) Lundqvist M.,Wahlgren G.M., Hill V. 2007, A&A, 463,693
- Mashonkina&Zhao (2006) Mashonkina L, &Zhao G. 2006, A&A, 456, 313
- Montes (2007) Montes, F., et al. 2007, ApJ, 671, 1685
- Obrien (2003) O’Brien, S., et al. 2003, Phys. Rev. C, 68, 035801
- Raiteri (1991) Raiteri, C. M., Busso, M., Gallino, R., Picchio, G., & Pulone, L.1991, ApJ, 367, 228
- Raiteri (1993) Raiteri, C. M., Gallino, R., Busso, M., Neuberger, D., Keppeler, F. 1993 ApJ, 419, 207
- Reoderer (2008) Roederer, I. U., Lawler, J. E., Sneden, C., Cowan, J. J., Sobeck, J. S., Pilachowski, C. A. 2008, ApJ, 675, 723
- Sneden et al. (2002) Sneden, C., Cowan, J. J., Lawler, J. E., Burles, S., Beers, T. C., Fuller, G. M. 2002, ApJ, 566, L25
- Sneden et al. (2003) Sneden, C., et al. 2003, ApJ, 591, 936
- Sneden et al. (2008) Sneden, C., Cowan, J. J., &Gallino, R. 2008, ARA&A, 46, 241
- Sneden et al. (2008) Sneden, C., Lawler, J. E., Cowan, J. J., Ivans,I. I., & den Hartog, E. A. 2009, ApJS, 182, 80
- Spite et al. (1978) Spite, M., & Spite, F. 1978, A&A, 67, 23
- The et al. (2000) The, L.-S., El Eid, M. F., & Meyer, B. S. 2000, ApJ, 533, 998
- Travaglio et al. (1999) Travaglio, C., Galli, D., Gallino, R., Busso, M., Ferrini, F., & Straniero, O. 1999, ApJ, 521, 691
- Woolf et al. (1995) Woolf V. M., Tomkin J., Lambert D. L., 1995, ApJ, 453, 660
- Zhang et al. (1999) Zhang, B., Li, J., Zhang, C. X., Liang, Y.,C., & Peng, Q. H., 1999, ApJ, 513, 910