Unwinding dynamics of double-stranded polymers
Abstract
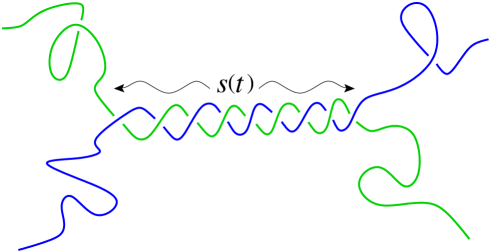
We consider the unwinding of two lattice polymer strands of length which are initially wound around each other in a double helical conformation and evolve through Rouse dynamics. The problem relates to quickly bringing a double-stranded polymer well above its melting temperature, i.e., binding interactions between the strands are neglected, and the strands separate from each other as it is entropically favorable for them to do so. The strands unwind by rotating around each other until they separate. We find that the process proceeds from the ends inwards; intermediate conformations can be characterized by a tightly wound inner part, from which loose strands are sticking out, with length . The total time needed for the two strands to unwind scales as a power of as . We present a theoretical argument which suggests that during this unwinding process, these loose strands are far out of equilibrium.
pacs:
36.20.Ey, 87.15.H-, 87.14.gkI Introduction
There are several known examples of polymers in nature that are composed by two or more strands arranged in a helical conformation. One is the double helical structure of DNA, in which two complementary sequences are held together by hydrogen bonding between A/T or C/G nucleotides. Another example is the triple helical structure of collagen. Under the appropriate thermodynamic conditions the multi-stranded structure becomes unstable and the strands dissociate from each other. For a DNA molecule, the dissociation of the two strands is usually referred to as the melting transition or denaturation; this happens when the temperature is increased typically above C in standard conditions wart85 . In view of its importance in many biological and biotechnological processes, various models of DNA melting have been developed to study the thermodynamical behavior as function of the sequence length and composition. Models originally proposed by Poland and Scheraga Poland and Scheraga (1966) (PS) and by Peyrard and Bishop Peyrard and Bishop (1989) (PB) take into account the different unbinding energies required to dissociate complementary G/C or A/T pairs using various types of approximations, yet they are simple enough to deal with very long DNA sequences. Using an appropriate choice of parameters they both fit reasonably well experimental data for the melting temperature of DNA sequences camp98 .
The melting dynamics has also been studied. In 1986, Baumgärtner and Muthukumar Baumgärtner and Muthukumar (1986) performed Monte Carlo simulations of the disentangling of two initially intertwined chains. After an initial softening of the original double helix, they reported that the time required for the actual unraveling of the chains scales with polymer length as a power law with exponent . Computer technology at that time allowed for simulations of 2, 4 and 8 turns only, and their fitted exponent might very well change with increasing chain length. The dynamics of the opening of bubbles in an entangled chain has also been studied PS ; Marenduzzo et al. (2002); Kunz et al. (2007); Baiesi and Livi (2009). In addition different extensions of the PS and PB models were considered to include helical degrees of freedom of DNA molecules Cocco and Monasson (1999); Rudnick and Bruinsma (2002); Barbi et al. (2003); Kabakçıoğlu et al. (2009). These extensions allow for rapid computations of equilibrium and dynamical properties of the melting transition, at the cost of introducing approximations which are poorly controlled and sometimes even questionable. The moves introduced to update PS models usually neglect the helicity of dsDNA, which is locally conserved due to impenetrability of the two strands (the unbinding of the two strands forming the double helix requires a release of the twist through a rotation of these strands with respect to each other). With the denaturation times characterized by the scaling law for the DNA strand length (in base pairs), the resulting values of thus range from Kunz et al. (2007) to Marenduzzo et al. (2002). If local moves preserving the DNA helicity are introduced, a very slow melting is instead observed, with Baiesi and Livi (2009). A second simplification intrinsic in PS models is that helical fragments and loops are described by equilibrium partition functions. This description can be too simplified in systems where the dynamics of the unwinding process is too fast to allow for the full structural relaxation within these loops. PB models have as a major simplification the possibility for complementary bases to orbit around a virtual central axis of the macromolecule. This yields denaturation times scaling linearly with the chain length Barbi et al. (2003). Given such spread of results, and uncontrolled simplifications in these models, we must conclude that we are still missing the understanding of how DNA length affects the time for its strands to disentangle.
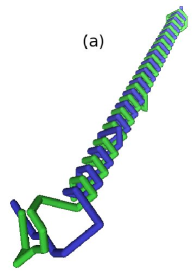
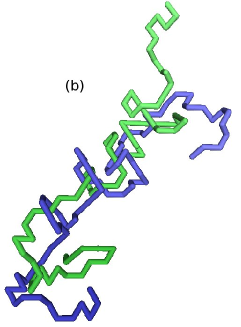
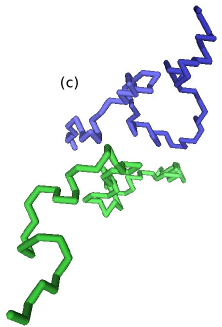
In order to gain more direct insight into the dynamics of the melting process of double-stranded molecules we investigate the unwinding dynamics of double-stranded three-dimensional long polymers using Monte Carlo simulations in the absence of hydrodynamic interactions. No binding energies between the two strands are taken into account during the unwinding process, corresponding to the case of a double helix brought rapidly to a temperature well above its melting point. For such a setup, the strands unwind from each other as it is entropically favorable for them to do so. We follow a procedure very similar to that of Ref. Baumgärtner and Muthukumar (1986), except that our chains are much longer, and more tightly wound. Figure 1 shows three configurations: (a) at the early stages of unwinding, (b) during the unwinding process, and (c) at the end of the unwinding, when the two stands are separating from each other. The main scope of this manuscript is two-fold: in section II we study the unwinding time as a function of — high precision simulations for polymers of length up to show that scales as a power-law with . In section III we show that the intermediate conformations can be characterized as a tightly wound inner part, to which unwound single strands are connected. The length of the unwound strands increases with time in a powerlaw fashion as . With a theoretical argument, we find an upper bound for the radius of gyration of the loose ends, which excludes the equilibrium value. This demonstrates that the unwinding is a far from equilibrium process.
II Unwinding time
In the simulation the polymers reside on a face-centered-cubic lattice with a lattice spacing of , and are initialized in a double-helical state. The polymers evolve in time through a long sequence of single-monomer moves, under the restriction that at all times, the polymer backbones are self- and mutually avoiding. Each allowed move occurs with a statistical rate of unity. To give the polymers some elasticity, the self-avoidance condition is lifted for monomers which are direct neighbors along the same chain. A detailed description of this lattice polymer model, its computationally efficient implementation, and a study of some of its properties and applications can be found in van Heukelum and Barkema (2003). This model reproduces known features of the Rouse dynamics panja and of the equilibrium properties baie10 of single self-avoiding polymers. As the moves respect the no-crossing condition between strands, we expect that the long time behavior of unwinding discussed in this study is of universal nature and is not affected by microscopic details and lattice effects.
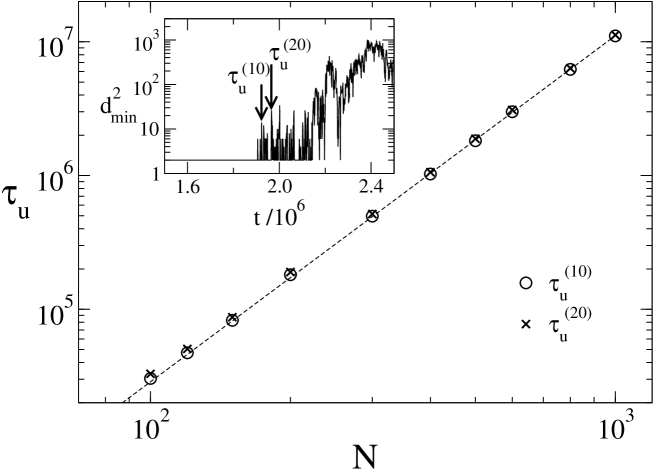
Let and be the lattice positions of the -th monomers on the two strands at time (). We consider the minimal distance between two strands defined as . The inset in Figure 2 shows a plot of as a function of time for a run. The choice of an initial double-helical conformation implies that at . Note that remains constant up to a time in the inset of Fig. 2 and then starts fluctuating and increasing in time. We define the unwinding time as the time at which exceeds some threshold value for the first time. For the threshold value we took and . The higher threshold value gives a slightly higher estimate of the unwinding time [ and in Fig. 2]. However, as the polymer length increases the ratio of converges to as shown in Table 1, hence the two quantities have the same scaling behavior in .
III Characterization of intermediate conformations
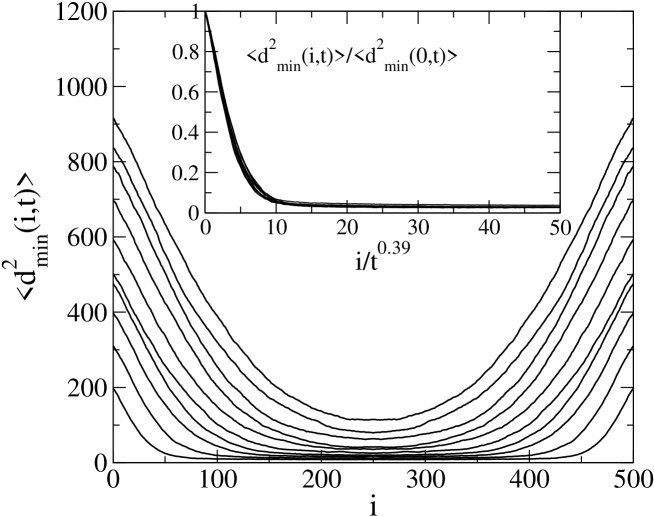
Given the topological constraint each strand faces while unwinding, we expect the unwinding dynamics to unroll from the two ends of the initial double-stranded complex, progressing inwards with increasing time (Fig. 3). Note that because of the elasticity of the model used in the simulations, a partial opening up of the inner wound part is not ruled out by the model: it is the physics of the problem that seems to suppress this. In order to connect this physical picture with the observed scaling we considered the quantity which is the minimal distance from the -th monomer of the first strand to any other monomer of the second strand. Its average square is plotted in Fig. 4 for a strand length equal to . The different data are for increasing time step snapshots taken at time intervals equal to (from bottom to top). The quantity is minimal in the middle, while it increases in time from the two edges, in agreement with the physical picture proposed in Fig. 3. We consider now the normalized profile . For this quantity we expect the following scaling behavior, as a function of the distance from the end monomer ()
| (1) |
with a scaling function and a characteristic length depending on time. The inset of Fig. 4 show that the normalized profiles at different times collapse when a rescaling is used, which implies . This is consistent with the exponent determined from the scaling of unwinding time as .
In order to gain insight into the unwinding we set up a simple analytical model of the process, assuming that the unwinding is sufficiently slow so that the conformation of the loose strands can be approximated by equilibrium ones at all times. We will show that this approach predicts an unwinding dynamics which is slower than what is observed in simulations. We therefore conclude that the unwinding we observe is a far from equilibrium process.
Consider an intermediate conformation which consists of two single-stranded coils of attached to a double stranded helical part of length . We estimate the free energy as a function of from the partition function for a double helical segment of length is and that of a single stranded coil , where are the connectivity constants. In other words
| (2) |
As an infinitesimal portion of the double helix unwinds, the change in free energy is thus given by
| (3) |
During this infinitesimal unwinding, the single-stranded coils are displaced over a distance due to the rotational motion around the axis of the helix: the coils describe a fraction of a circle of radius perpendicular to the axis of the helix, where is the distance from the helix axis to the coil’s center of mass. In equilibrium we expect , with the Flory exponent. This implies that
| (4) |
During this process the work done against friction equals
| (5) |
where for Rouse dynamics the friction on the single-stranded coils is proportional to their lengths: . Since the work done against friction cannot exceed the available free energy, we obtain the inequality
| (6) |
If this inequality were saturated, the unwinding process would be described by
| (7) |
The integration of Eq. (7) yields a scaling of the unwinding time as (since ), which is obtained from Eq. (7) by setting . Indeed, a visual investigation of the unwound parts during simulations reveals that these show a tendency to be spiral-like, and contain a significant amount of coiling. A precise quantification of the amount of spiraling is very difficult due to the lack of a clean definition of the central axis of the spiral. This argument predicts a very slow unwinding compared to that which is actually observed in simulations, suggesting that unwinding proceeds through non-equilibrium states. In an early study of unwinding Baumgärtner and Muthukumar (1986) the scaling was computed for shorter polymers (up to ; with 2, 4 or 8 turns in the double helix) and for helices less tightly bound than considered here. The exponent of Baumgärtner and Muthukumar (1986) most likely describes a pre-asymptotic scaling regime. The exponent reported in Baumgärtner and Muthukumar (1986) is however compatible with that predicted from Eq. (7). This suggests that the early stages of unwinding are probably well captured by the mechanisms underlying the derivation of Eq. (7), but that the asymptotic scaling regime is dominated by a mechanism which is faster for longer chains.
IV Summary and conclusions
Summarizing, we introduced a lattice model for studying the unwinding dynamics of a long three-dimensional double stranded polymer, with excluded volume effects taken into account. The lattice nature of the model, combined with an efficient encoding of the dynamics, allows one to simulate long polymers (up to ) for very long time ( Monte Carlo steps). Our numerical results show that the unwinding time scales with the polymer length as a power-law with exponent with Rouse dynamics. An analysis of a simple analytical model of the process suggests that the unwinding we observe is a far from equilibrium process, therefore it cannot be understood in terms of a slow dynamics evolving through quasi-equilibrium states, e.g. using free energy arguments.
References
- (1) R. M. Wartell and A. S. Benight, Phys. Rep. 126, 67 (1985).
- Poland and Scheraga (1966) D. Poland and H. A. Scheraga, J. Chem. Phys. 45, 1456 (1966).
- Peyrard and Bishop (1989) M. Peyrard and A. R. Bishop, Phys. Rev. Lett. 62, 2755 (1989).
- (4) A. Campa and A. Giansanti, Phys. Rev. E. 58, 3585 (1998); J. W. Bizzaro, K. H. Marx, and R. D. Blake, Mat. Res. Soc. Symp. Proc. 489, 73 (1998)
- Baumgärtner and Muthukumar (1986) A. Baumgärtner and M. Muthukumar, J. Chem. Phys. 84, 440 (1986).
- (6) M. Barbi, S. Cocco, M. Peyrard, and S. Ruffo, Journal of Biological Physics 24, 97 (1999); A. Hanke and R. Metzler, J. Phys. A: Math. Gen. 36, L473 (2003); T. Novotny, J. N. Pedersen, T. Ambjornsson, M. S. Hansen, and R. Metzler, Europhys. Lett. 77, 48001 (2007); A. Bar, Y. Kafri, and D. Mukamel, Phys. Rev. Lett. 98, 038103 (2007); H. C. Fogedby and R. Metzler, Phys. Rev. Lett. 98, 070601 (2007).
- Marenduzzo et al. (2002) D. Marenduzzo, S. M. Bhattacharjee, A. Maritan, E. Orlandini, and F. Seno, Phys. Rev. Lett. 88, 028102 (2002).
- Kunz et al. (2007) H. Kunz, R. Livi, and A. Süto, J. Stat. Mech. P06004 (2007).
- Baiesi and Livi (2009) M. Baiesi and R. Livi, J. Phys. A: Math. Theor. 42, 082003 (2009).
- Cocco and Monasson (1999) S. Cocco and R. Monasson, Phys. Rev. Lett. 83, 5178 (1999).
- Rudnick and Bruinsma (2002) J. Rudnick and R. Bruinsma, Phys. Rev. E 65, 030902(R) (2002).
- Kabakçıoğlu et al. (2009) A. Kabakçıoğlu, E. Orlandini, and D. Mukamel, Phys. Rev. E 80, 010903 (2009).
- Barbi et al. (2003) M. Barbi, S. Lepri, M. Peyrard, and N. Theodorakopoulos, Phys. Rev. E 68, 061909 (2003).
- van Heukelum and Barkema (2003) A. van Heukelum and G. T. Barkema, J. Chem. Phys. 119, 8197 (2003).
- (15) D. Panja and G.T. Barkema, J. Chem. Phys. 131, 154903 (2009).
- (16) M. Baiesi, G.T. Barkema and E. Carlon, Phys Rev E 81, 061801 (2010).
| 60 | 1.093 | ||
| 80 | 1.096 | ||
| 100 | 1.082 | ||
| 120 | 1.070 | ||
| 150 | 1.055 | ||
| 200 | 1.048 | ||
| 300 | 1.038 | ||
| 400 | 1.032 | ||
| 500 | 1.036 | ||
| 600 | 1.032 | ||
| 800 | 1.021 | ||
| 1000 | 1.017 |