First measurement of kaonic helium-3 X-rays
Abstract
The first observation of the kaonic 3He transition was made, using slow mesons stopped in a gaseous 3He target. The kaonic atom X-rays were detected with large-area silicon drift detectors using the timing information of the pairs of -meson decays produced by the DANE collider. The strong interaction shift of the kaonic 3He state was determined to be .
keywords:
exotic atoms , kaonic helium , silicon drift detectors , strong interactionPACS:
13.75.Jz , 29.30.Kv , 36.10.Gv1 Introduction
Low-lying energy levels of kaonic atoms are shifted and broadened due to the strong interaction between the antikaon and nucleus. These shifts and widths are fundamental data for studies of the low-energy interaction, and generally of low-energy QCD in the strangeness sector. Although kaonic atom X-ray data have been taken using many target materials, little was known about kaonic atoms with and . Concerning kaonic helium, no data was available for kaonic 3He, while, until recently, for kaonic 4He there was a discrepancy between experimental results and theoretical predictions [1, 2, 3, 4]. This discrepancy was eventually solved in recent years by the E570 and SIDDHARTA experiments [5, 6], where reliable experimental data were obtained. As soon as a low-energy kaon beam, allowing the use of gaseous target, and fast-timing X-ray detectors became available, for the first time, kaonic 3He X-rays could be measured by the SIDDHARTA experiment.
The SIDDHARTA experiment uses low-energy kaons generated by the DANE collider, which may be stopped efficiently in a gaseous target in a small volume. Large-area silicon drift detectors (SDDs) – developed in the framework of the SIDDHARTA collaboration – were used as X-ray detectors for the first time at a collider machine. Using these SDDs, it was possible to determine X-ray energies with a precision of a few eV in the energy range up to about 10 keV, based on high suppression of background events.
In this paper, we report on this first measurement of the kaonic 3He X-rays, which is extremely important in view of a possible shift of the kaonic 3He level, as well as a possible isotope difference of the level shifts between kaonic 3He and 4He depending on the strength of the -3He and -4He interaction [7].
2 The SIDDHARTA experimental setup
The SIDDHARTA setup was installed at the interaction point of the DANE collider. It consists of an X-ray detection system, a cryogenic target system, and a kaon detector, as shown in Fig. 1.
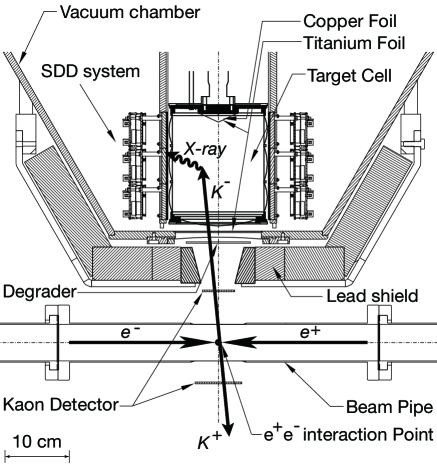
Helium-3 gas at a temperature of 20 K and a pressure of 1 bar was used as a target. The gas was contained in a cylindrical target cell (with a radius of 72 mm, and a height of 155 mm), made of 75-m thick Kapton foils.
Large area silicon-drift detectors (SDDs) having an active area of 1 cm2 each and a thickness of 450 m [8, 9, 10] were used for X-ray detection. A total active area of 144 cm2 was installed with a distance of 78 mm between the SDDs and the target central axis. The SDDs were cooled to a temperature of 170 K with a stability of K.
The positions at which the SDDs were installed differed from those in the setup used for kaonic 4He in [6]. Together with a larger size of the target, the acceptance of the SDDs was improved by a factor of about 2.6.
pairs produced by decay were detected by two scintillators installed above and below the beam pipe at the interaction point (called “the kaon detector”). The scintillator installed below the beam pipe has a size of 72 72 mm2 and a thickness of 1.5 mm, while the one installed above the pipe has a smaller size of 49 45 mm2 and a thickness of 1.5 mm. Above the upper scintillator a degrader was installed to degrade the kaon energy so that the mesons are stopped in the 3He target volume.
High intensity X-ray lines for energy calibration were periodically provided by irradiating thin foils of titanium and copper with an X-ray tube to excite them. They were installed at the interaction point, replacing the kaon detector.
Two types of data were taken with the beams. The first type (“production” data) is data taken with the kaon detector and degrader, to be used for collection of kaonic atom X-ray events. The second type (“X-ray tube” data) is data taken with the X-ray tube and the Ti and Cu foils. These X-ray tube data were taken periodically (typically every several hours), to be used for the determination of the energy scale of each SDD, and for monitoring temporal changes in the positions of the Ti and Cu X-ray peaks.
Energy data of all the X-ray signals detected by the SDDs were recorded using a specially designed data acquisition system. Time differences between the X-ray signals in the SDDs and the coincidence signals in the kaon detector were recorded using clock signals with a frequency of 120 MHz, whenever the X-ray signals occurred within a time window of 6 s. In addition, time differences between the coincidence signals in the kaon detector and the clock pulses delivered by DANE were recorded.
The kaonic 3He X-ray data were taken for about 4 days in November of 2009. In this period, an integrated luminosity of 17 pb-1 was collected, which corresponds to about kaons detected by the kaon detector.
3 Analysis of kaonic helium X-ray data
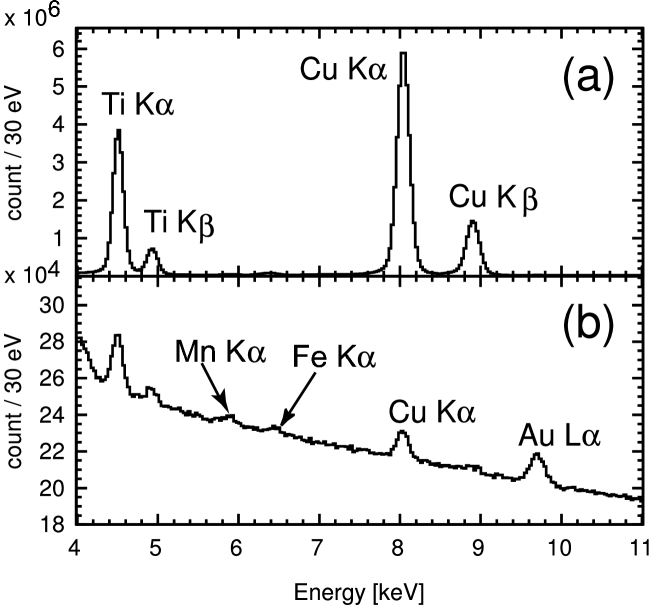
First, the X-ray tube data were analyzed. Energy spectra of each SDD contain Ti and Cu K peaks with high statistics, mainly induced by radiation from the X-ray tube. Since each SDD has a different gain, the energy scale was determined using the known X-ray energies of the Ti and Cu lines. In addition, SDDs having good performance were selected, based on energy resolution, peak shape, and stability during the measurements [11]. The energy spectrum of the X-ray tube data is shown in Fig. 2(a), where data of all the selected SDDs were summed. More detailed information can be found in [11].
The production data were then analyzed using the energy scale determined from the X-ray tube data after corrections for temporal fluctuations of the peak positions. The production data are categorized as two types, based on whether or not the coincidence signals between the SDD and kaon detector occurred within a coincidence window of 6 s. One type contains X-ray events correlated with the kaon coincidence (triple coincidence data), providing kaonic atom X-ray energy spectra with a high background suppression. The other type contains X-ray events uncorrelated with the kaon coincidence (non-coincidence data), providing large statistics of background events, as well as X-ray lines from the target materials induced by the beam background.
Figure 2(b) shows the energy spectrum of the non-coincidence data. The Ti and Cu peaks are seen at an energy of 4.5 keV and 8.0 keV, respectively. These peaks were produced by the Ti and Cu foils installed on the top of the target, as well as by the Ti foil, which is a part of the degrader. In addition, the Au L line is seen at 9.7 keV, which was produced by the material of the SDD support structure. The Mn K and Fe K peaks were seen at 5.9 keV and 6.4 keV, which were produced by a 55Fe source and the Fe foil installed on the top of the degrader during part of the measurement.
The accuracy of the energy scale in the production data was evaluated using the peak positions of the Ti, Cu, and Au lines. For the evaluation, the data taken with other target gases in the same experimental setup were also used, to reduce the effect of statistical fluctuations in the peak positions. In the fit of these lines, X-ray energies determined by high-resolution measurements were used as reference values [12, 13, 14], where their natural linewidth and asymmetric components were also taken into account.
As a result of the fit, the energy scale in the production data is shifted by eV compared to the reference data. The accuracy of the energy determination was eV in the energy region from 4 keV to 10 keV [11].
This shift is due to the instability of our electronics caused by differing conditions between the production and X-ray tube data. The largest contribution is a rate-dependent effect on the SDDs. The hit rate of the SDDs in the X-ray tube data was about 10 times higher than that in the production data, causing the observed shift.
The shift needs a correction to determine X-ray energies on an absolute energy scale. A value on the absolute energy scale () is calculated by adding the correction term () to a fit value in the production data (:
| (1) |
where
| (2) |
The uncertainty of is used for the evaluation of a systematic error in the energy determination.
The timing information of the coincidence data was analyzed to reject X-ray events uncorrelated to the production timing.
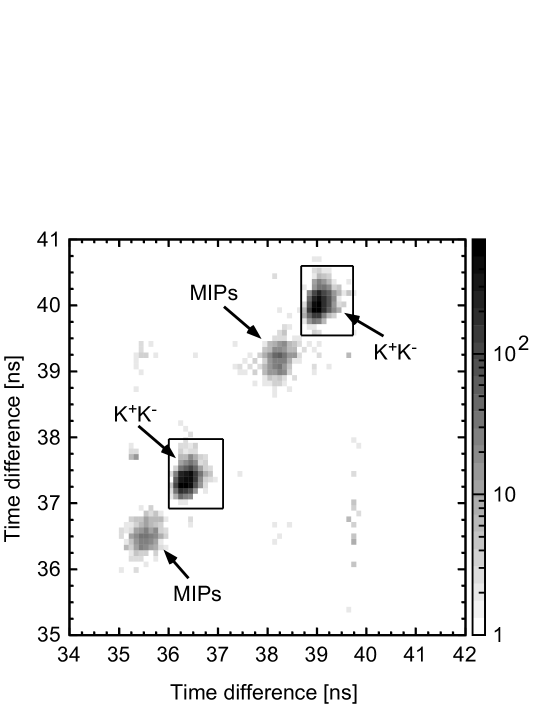
The charged kaons were identified by means of the time-of-flight technique in the kaon detector [6, 15]. A correlation of the time difference on the two scintillators is shown in Fig. 3, where the gray scale in the figure corresponds to the number of events per bin on a logarithmic scale. The events corresponding to pairs were marked in the figure, as well as the events of fast minimum-ionizing particles (MIPs) which passed through the two scintillators in coincidence. Because a half frequency of the beam synchronous timing signal was used for the start timing of the time-of-flight, the pair events appeared in two different timing regions in this timing spectrum [11, 15]. The regions marked with a rectangle were accepted as a timing window for the coincidence.
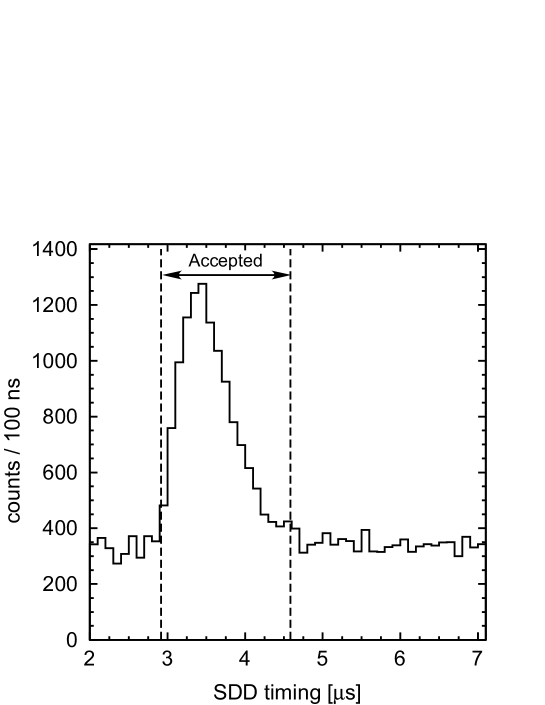
The time-difference spectrum of the pair events in the kaon detector and the X-ray events in the SDDs is shown in Fig. 4. The origin of the horizontal axis is arbitrary because of a delay time of the electronics. The peak in the figure corresponds to the coincidence events of the pairs and X-rays (triple coincidences). A region from 2.9 s to 4.6 s was selected as the timing window of the coincidences.
Figure 5 shows the X-ray energy spectrum of the SDDs in the triple coincidence timing, where the energy scale determined from the X-ray tube data was used for the horizontal axis. A peak seen at 6.2 keV is identified as the kaonic 3He L line (the transition). Along with this peak, other small peaks are seen. They are identified as the Ti K line at 4.5 keV, the kaonic carbon transition at 5.5 keV, the kaonic oxygen at 6.0 keV, and the kaonic nitrogen at 7.6 keV. The kaonic atom X-rays were produced by kaons stopping in the target window made of Kapton (Polyimide) (). The identification of these lines was confirmed in the analysis of data taken with other target gases (hydrogen, deuterium, and helium-4).
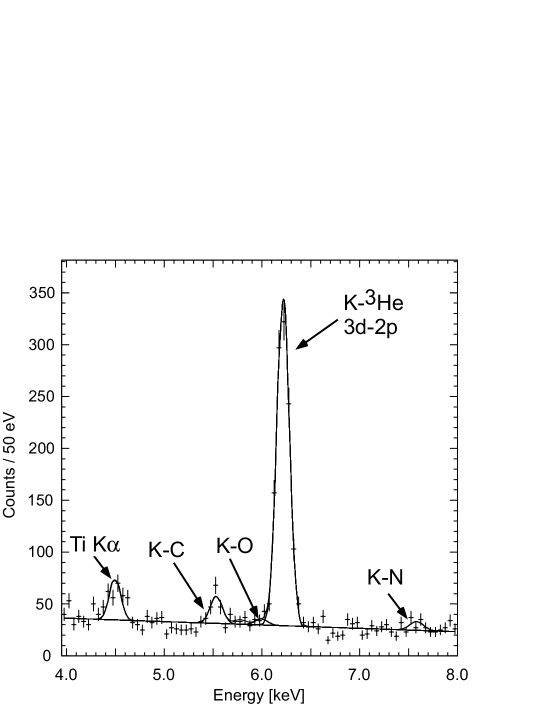
The kaonic helium L peak was fitted with a Voigt function, which is a convolution of a Gaussian and a Lorentzian. The fit lines are shown in the figure. The energy resolution of the peak is consistent with the value obtained from the non-coincidence data (about 150 eV (FWHM) at 6.2 keV). The peak position was determined to be
| (3) |
Using the correction term in Eq. (2), the absolute energy of the kaonic 3He transition was then determined to be:
where the second term is the statistical error, and the third term is the systematic error. The latter was evaluated from the accuracy of the energy determination ( 3.5 eV). Other contributions to the systematic error (e.g. effects of timing region selection and contributions of the kaonic oxygen line at 6.0 keV) are negligible.
4 Discussion and conclusions
The energy of the kaonic 3He transition () was calculated using the Klein-Gordon equation together with an energy shift caused by the vacuum polarization effect. The formula given in [16] was used for the calculation of the vacuum polarization effect, where the first order of the Uehling potential was taken into account. The energy levels of the and states are tabulated in Table 1. The calculated energy () of the kaonic 3He transition was:
| (5) |
The contribution from the higher-order vacuum polarization terms is estimated to be 0.2 eV, and the uncertainty due to the kaon mass error is about eV. Other corrections (e.g. a recoil effect, a charge-radius effect) are negligibly small, compared to the above terms.
| Level | K.G. [eV] | V.P. [eV] | Total [eV] |
|---|---|---|---|
| -11179.6 | -15.4 | -11195.0 | |
| -4968.6 | -1.9 | -4970.5 | |
| 6211.0 | 13.5 | 6224.6 |
The strong-interaction shift of the kaonic 3He state is obtained from the difference between the experimentally determined value and the QED calculated value (The strong-interaction shift of the state is negligibly small). The result is:
| (6) | |||||
where the second term denoted as (stat) is the statistical error and the third term denoted as (syst) is the systematic error.
Using the same setup as well as the same measuring and analysis procedures, kaonic 4He X-rays were measured over short periods for a very first look at a possible isotope shift between kaonic 3He and 4He [7]. The strong-interaction shift of the kaonic 4He state was determined to be This result is in agreement, within the errors, with the results reported by the E570 [5] and SIDDHARTA [6] collaborations. Since the present results both of the kaonic 3He and 4He shifts were determined with the same procedures, their difference gives directly a first indication that the kaonic 3He-4He isotope shift is rather small, which is expected also in theories [7, 17].
In conclusion, for the first time, the energy of the kaonic 3He transition was measured using a gaseous 3He target in the SIDDHARTA experiment. The strong-interaction shift of the kaonic 3He state was determined to be eV.
Acknowledgement
We thank C. Capoccia, B. Dulach, and D. Tagnani from LNF-INFN; and H. Schneider, L. Stohwasser, and D. Stückler from Stefan-Meyer-Institut, for their fundamental contribution in designing and building the SIDDHARTA setup. We thank as well the DANE staff for the excellent working conditions and permanent support. Part of this work was supported by HadronPhysics I3 FP6 European Community program, Contract No. RII3-CT-2004-506078; the European Community Research Infrastructure Integrating Activity “Study of Strongly Interacting Matter” (HadronPhysics2, Grant Agreement No. 227431) under the Seventh Framework Programme of EU; Austrian Federal Ministry of Science and Research BMBWK 650962/0001 VI/2/2009; Romanian National Authority for Scientific Research, Contract No. 2-CeX 06-11-11/2006; Grant-in-Aid for Specially Promoted Research (20002003), MEXT, Japan; and the Austrian Science Fund (FWF): [P20651-N20].
References
- [1] C.E. Wiegand and R. Pehl, Phys. Rev. Lett. 27 (1971) 1410.
- [2] C.J. Batty, et al., Nucl. Phys. A 326 (1979) 455.
- [3] S. Baird, et al., Nucl. Phys. A 392 (1983) 297.
- [4] C. J. Batty, Nucl. Phys. A 508 (1990) 89c.
- [5] S. Okada, et al., Phys. Lett. B 653 (2007) 387.
- [6] SIDDHARTA Collaboration, Phys. Lett. B 681 (2009) 310.
- [7] Y. Akaishi, Proc. Inter. Conf. on Exotic Atoms (EXA05), Austrian Academy of Sciences Press, Vienna (2005), p. 45; http://dx.doi.org/10.1553/exa05s45
- [8] P. Lechner, et al., Nucl. Instr. and Meth. A 458 (2001) 281.
- [9] C. Fiorini, et al., Nucl. Instr. and Meth. A 568 (2006) 322.
-
[10]
M. Bazzi, et al., Nucl. Instr. and Meth. A in press,
doi:10.1016/j.nima.2010.06.332. - [11] SIDDHARTA Collaboration, to be submitted to Nucl. Instr. and Meth. A.
- [12] C. T. Chantler, et al., Phys. Rev. A 73 (2006) 012508.
- [13] G. Hölzer, et al., Phys. Rev. A 56 (1997) 4554.
- [14] G. Zschornack, Handbook of X-ray Data, Springer-Verlag Berlin, 2007.
- [15] V. Lucherini, et al., Nucl. Instr. and Meth. A 496 (2003) 315.
- [16] S.G. Karshenboim, et al., Can. J. Phys. 84 (2006) 107.
- [17] E. Friedman, private communication (2010).