The Role of Family-Based Designs in Genome-Wide Association Studies
Abstract
Genome-Wide Association Studies (GWAS) offer an exciting and promising new research avenue for finding genes for complex diseases. Traditional case-control and cohort studies offer many advantages for such designs. Family-based association designs have long been attractive for their robustness properties, but robustness can mean a loss of power. In this paper we discuss some of the special features of family designs and their relevance in the era of GWAS.
doi:
10.1214/08-STS280keywords:
.and
1 Introduction
The potential of genome-wide association studies (GWAS) to enable an unbiased search for disease loci across the entire human genome provides us with an unprecedented research opportunity in genetics. Interrogating several hundred thousand SNPs across many subjects at the same time raises many statistical challenges in the design and analysis of these studies. Genotyping on such a scale requires new methodology for handling data quality issues; likewise, association tests are computed for hundreds of thousands of markers, whose results have to be adjusted for multiple comparisons. The magnitude of these problems raises the question of whether the new technical ability to genotype such dense SNP sets will translate into the identification of novel genetic disease loci or whether the technical advance remains under-utilized.
A popular way to address the multiple testing in genome-wide association studies has been to design studies with a sample size of several thousand subjects that are large enough that realistic effect sizes can be detected, assuming that the test results will be corrected for multiple testing using the Bonferroni approach. However, such large studies come at a price. By putting together samples of several thousand subjects, phenotypic and genetic heterogeneity will be encountered in the sample. Further, since the need for large sample sizes also influences the study-design choice, the most commonly used design choice is a case-control sample of unrelated individuals with minimal or no covariates. Another popular approach is a population-based design of unrelated individuals without ascertainment condition related to the outcome of interest (e.g., studying obesity in a general population sample). In any event, the ascertainment of subjects and collection of their phenotypic data is rarely carried out specifically for the GWAS; rather, the expense of the genotyping has led investigators to rely on samples previously collected and phenotyped for other studies, in some cases, large family samples that have been previously collected for other genetic studies. Although the cost of genotyping is dropping rapidly, the cost of genotyping still tends to drive study design and make power considerations very crucial in the design.
An alternative approach to population-based or case-control studies of unrelated individuals is family-based studies. Family-based studies were used in association studies originally to provide protection against spurious association arising with population substructure. Family designs offer some unique advantages at the design and analysis phase of a GWAS.
Their complete robustness against heterogeneity at a phenotypic and genetic level allows the joint analysis of arbitrarily large and diverse samples with family designs, an advantage in the GWAS setting. As we will discuss in Section 3, they have both drawbacks and benefits over conventional designs when genotyping errors are present. We will also discuss two-stage test strategies for family designs that maintain the original robustness of the approach, while achieving power-levels that are similar to those of population-based studies.
Our objective in this paper is to first describe some of the special features of family-based designs that make them attractive for association studies, then focus particularly on their use in GWAS’s with regard to genotyping errors and potential for addressing the multiple comparison problem.
2 Overview of Family Designs for a Single Marker
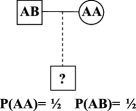
It has long been recognized that various sorts of population substructure can distort tests of association because different populations may have different disease rates, and/or genotype frequencies(Devlin and Roeder (1999); Pritchard, Stephens and Donnelly (2000); Whittemore (2006)). Family designs for genetic association studies were originally suggested (Falk and Rubinstein (1987); Ott (1989); Spielman, McGinnis and Ewens (1993)) as a way of avoiding spurious association due to population substructure. The classic paper by Speilman, McGinnis and Ewens (1993) on the Transmission Disequilibrium Test (TDT) has contributed much to their general popularity. There are many variations on the family design, but the simplest and generally most powerful design consists of selecting affected offspring and their parents, and genotyping the trio. Essentially, having the genotypes of the parents enables one to take advantage of “Mendelian Randomization” to avoid the need for an explicit control group. Under the null hypothesis of no association between the disease and the marker, each parent transmits one of their two alleles to each offspring, at random with probability 50/50 and independently of the other parent and of any other offspring. For the example in Figure 1, the mother can only transmit the A allele, but the father can transmit either A or B with probability 50/50. This holds whenever there is no selection of the offspring related to the marker in question. Thus, when the parent’s genotypes are known, one can easily calculate the distribution of the offspring genotypes under . This distribution is used to construct tests of the null hypothesis. The observed and expected counts can be used to construct an asymptotic test (Ott (1989); Spielman, McGinnis and Ewens (1993)) or exact tests can be used (Lazzeroni and Lange (1993)). Because parents transmit independently to different offspring, multiple affected siblings can be used, resulting in a potential savings in genotyping costs. With more common diseases, using transmissions to unaffected siblings may also be beneficial(Lange and Laird (2002)).
A Class of Score Tests for Family Designs
A more precise statistical argument regarding the robustness of the family designs can be made by considering the basis for the TDT test. The simple TDT test is a score test, based on the likelihood of the offspring genotypes, conditioned on the offspring trait and the parental genotypes (Schaid (1996)). To develop this likelihood in a general setting, let denote the parental genotypes of a trio, denote the trait of the offspring (here the trait can be arbitrary), and let denote some numerical coding for the offspring genotype, for example, number of A alleles or a dummy variable coding for a recessive or dominant genetic model. Further, let denote the probability density of the offspring trait, conditioned on the offspring genotype, the parental genotype and a vector of unknown parameters, . In genetic terminology, is the penetrance function and specifies the genetic disease model. Generally, is assumed not to depend directly on the parental genotypes when offspring genotypes are in the model, but we leave them in for generality. The vector will contain both association parameters, say, , and nuisance parameters, say, , which will describe other aspects of the trait distribution. In particular, we parameterize so that , and under the null, , so that , that is, the distribution of the trait does not depend on the marker genotypes of the offspring under the null. Further, let be the probability density of the offspring genotype conditioned on parental genotype. Note that the latter is completely known and determined by Mendel’s laws, whereas the former reflects our alternative hypothesis, and is generally unknown.
The conditional likelihood for the offspring genotype given parental genotypes and the offspring trait is given by
where summation is over all compatible with . An important feature of conditioning on is that any nuisance parameters in the distribution of the parental genotypes, such as allele frequencies and random mating assumptions, are not needed. As noted above, the penetrance function does not depend on under the null, and hence cancels out of the likelihood. Thus, the distribution of under the null is given simply by , which is completely determined by Mendel’s laws; no assumptions need be made about the distribution of parental genotypes or about the phenotypes. Thus, a score test will have the correctly specified null distribution as long as Mendel’s laws hold, and will be completely robust to not only population substructure, but to potential misspecification of the trait distribution as well.
In the TDT, we condition on and let denote the number of a particular allele that an individual has. The model can take any form, logistic, log-linear, linear, etc., with modeling the probability for . A simple form for the penetrance function, which provides a generalization of the TDT for any phenotype, can be obtained by assuming an exponential family model for the trait distribution with a generalized linear model for the mean response (Lunetta et al. (2000); Liu et al. (2002); Dudbridge (2008)). In this case, the score takes the special form of a type of covariance between the trait and the marker:
| (2) |
where summation is over all trios. Here is the mean trait under and may depend upon the unknown nuisance parameters , and is computed using only Mendel’s laws. An asymptotic (or ) test statistic is formed by normalizing (2) by the square root of , where can also be computed simply from Mendel’s Laws. Alternately, exact tests usingMendel’s laws to compute can be easilycalculated (Lazzeroni and Lange (1993) andSchneiter, Laird and Corcoran (2005)).
A potential barrier to constructing score tests in this general case is in estimating the nuisance parameters . Standard likelihood ratio methods cannot be used here, because under the null, the likelihood does not depend on and the parameters cannot be estimated. The case of trios, where all offspring are affected , is special in this regard. Here, is constant for everyone, and because we condition on , the score test can be reformulated as
| (3) |
It is easily seen that this score test yields the TDT when is coded to count the number of alleles of interest (Schaid (1996)).
If we include unaffected offspring as well as affected, then equation (2) still holds, but the test now depends upon estimating the prevalence because is not constant. If selection of subjects depends upon disease status, then prevalence cannot be estimated from the sample data, but often some a priori information is available. In the more general case of measured phenotypes, the test depends on the specified disease model via the nuisance parameters implicit in and remains valid regardless of choice of disease model provided Mendel’s laws hold. While model choice can affect power (Lange and Laird (2002); Lange, DeMeo and Laird (2002)), choice of the wrong disease model does not affect robustness, as the test is conditioned on the trait. When samples are selected on the basis of the disease trait, as is generally the case with dichotomous traits, the nuisance parameters cannot be estimated from the data; methods for specifying have been suggested (Lunetta et al. (2000); Lange and Laird (2002); Lu and Cantor (2007);Dudbridge (2008)).
Missing Parental Information
Missing parental genotype information is a common problem, especially for later onset diseases.There have been several approaches suggested for handling missing parents, including estimating amodel for the parental genotypes distribution, and using joint likelihood ratio tests (Weinberg (1999)) or using score tests which average over the estimated distribution of the parental genotypes (Clayton (1999)) for families with missing parents. These approaches are not guaranteed to retain robustness to population substructure, especially since both approaches generally make simplifying assumptions concerning the distribution of the parental genotypes (e.g., common allele frequencies and Hardy–Weinberg equilibrium); see Dudbridge (2008). Alternatively, when siblings are sampled, can be replaced in the above equations by , where denotes the sufficient statistic for parental genotype(Rabinowitz and Laird (2000)). Being the sufficient statistic, again does not depend upona model for parents’ genotype distribution, and the score test remains fully robust. The distributions are simple to enumerate, and tests based on (2)–(2) with replaced by if parents are notavailable can be implemented in the FBATwww.biostat.harvard.edu/~fbat/ or PBAT www.biostat.harvard.edu/~clange software packages. However, the power of these tests can be much reduced, depending upon the number of additional siblings available. We refer to the FBAT test to describe this general class of score tests which extends the TDT to other traits and other family designs.
In summary, conditioning on both the parental genotypes and the offspring traits ensures robustness against misspecification of the disease model, and to the distribution of offspring genotypes under the null. The general approach has been extended to handle multiple siblings (Lange and Laird (2002) and Lange, DeMeo and Laird (2002)), missing parents (Rabinowitz and Laird (2000)), multiple traits (Lange et al. (2003)), haplotypes (Horvath et al. (2004)) and multiple markers (Xu et al. (2006);Rakovski et al. (2007)).
Comparative Power Issues: Single Marker Case
By and large, most approaches for analyzingGWAS studies, conventional or family designs, begin by testing each marker separately, and then do an adjustment for multiple comparisons to determine genome-wide significance and/or select promisingSNPs or regions for further study based on rankings of some sort. There have been several proposals for alternative methods of testing to increase power in the face of multiple testing, as we will discuss in Section 5, but, by-and-large, the genome-wide power of a GWAS is usually estimated by calculating power for a single marker, using some appropriate alpha-level to adjust for multiple comparisons; thus, comparative power issues for single markers translate directly to power calculations for genome-wide studies.
We note that this one-marker, one-test approach is in strong contrast to genome-wide linkage scans, where one can at least approximate the null distribution of the test statistic across the genome, for example, maximized lod-score, under the null hypothesis of no linkage (Feingold, Brown and Siegmund (1993)). With dense association scans, the unknown pattern of LD precludes specification of the joint distribution of the association test statistics under the null of no association. In principle, using permutation tests in case-control studies can considerably improve the probability of at least one positive finding, but the magnitude of the computations are prohibitive in a GWAS with hundreds of thousands of SNPs. An exception to the one test per typed SNP are methods which incorporate information from the Hapmap to impute non-typed SNPs, gaining additional power via testing a denser marker set (Marchini et al. (2007)). Thus far, this approach has been limited to case-control data and investigation of methodology for family designs is desirable.
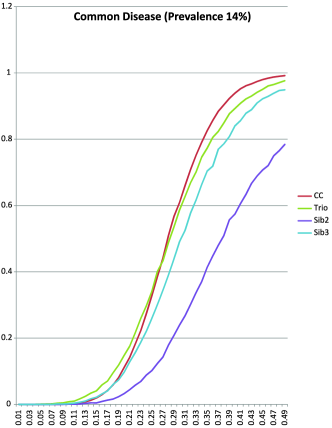
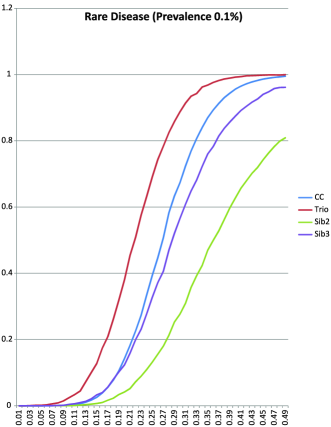
Family-based tests, being conditional tests, are robust and essentially model free, but the price of such robustness is some cost in terms of power. There are some cases, and some designs, however, where the power is essentially equivalent, as was shown for rare disease and the additive model in Laird and Lange (2006). Here we consider power comparisons for the recessive model with an -level of 0.00001 to more nearly reflect a GWAS testing situation. Figures 2 and 3 compare the power of four different designs: case-control, trios, discordant sib pairs (DSP) and discordant sib trios (DST; at least one discordant sib pair and one other sibling), for a rare disease and a common one. The odds ratio is 1.75 in both cases, and the number of affected (1500) is the same for each design, although number of genotypes required can be different depending on design. The DSP design is always very inefficient, whereas DST can do well with more common disorders. For the recessive model, the power of the case-control design and the trio design are virtually identical for common diseases (e.g., prevalence 14%), with minor advantages for trio designs for low allele frequency and minor advantages for the case-control design for common alleles. However, for rare diseases, the trio design is much for powerful than the case/control design. The reason for the relative power loss of the case/control design is that, for rare diseases, the differences between the genotype distribution of healthy controls and the genotype distribution of the general population are minimal and the contribution of the controls to the power of the test statistic diminishes. For the trio design, we use only cases and, consequently, such designs do not suffer this relative power loss for small prevalences. The power results for the trios differ slightly by prevalence because we base our model on the odds ratio rather than the relative risk model. We provide some simple algebraic calculations in the Appendix to illustrate this point.
3 Quality Control/Data Cleaning in Family Designs
The large amount of genotyping required for a GWAS is accomplished via specially designed genotyping platforms commonly called SNP-chips. Genotyping errors include several types of failures that can occur in the genotyping process; these can result in either missingness and/or misclassification of genotypes. The raw data of a single genotype for a single individual is a pair of measured intensities for each allele; the intensities are translated into genotypes, generally using some type of statistical clustering algorithm, referred to as the ‘genotype calling algorithm.’ Perhaps due to poor DNA quality or design issues of the SNP-chip, the sample may simply fail to provide intensities or the intensities do not separate into the three possible genotype clusters, making it impossible to obtain called genotypes. These errors all give rise to missing genotypes. Further missingness arises in the data cleaning process which is described below. Misclassification occurs if the calling algorithm makes a genotype call which is not correct; the probability for misclassifying a genotype generally increases with lower minor allele frequencies, and can depend upon the true, unobserved, genotype.
In the data cleaning step of a GWAS, basic statistical analysis tools are used as quality control filters to identify SNPs and probands for which the SNP-chip is not able to provide sufficient genotyping quality (Manolio et al. (2007)). Such analysis techniques/filters include tests for departures from the Hardy–Weinberg Equilibrium, removal of SNPs with low frequencies or low “call rates,” or deletion of individuals with low call rates. Since the inclusion of SNPs and probands with misclassified genotypes can lead to a substantial reduction in power, the data cleaning/filtering step is one of the most important parts in the analysis of a GWAS. While there has been much progress in improving genotype calling and data cleaning algorithms, we can expect that there will continue to be some level of missing and misclassification in all GWAS’s.
When family data are used, an additional quality-control filter that is applied in the data cleaning step is the removal of Mendelian inconsistencies. Mendelian inconsistencies are genotype configurations in families that violate Mendel’s Law. For example, if a “B”-allele is observed in a subject whose parents do not carry any “B”-alleles, this is an obvious violation of Mendel’s law. Such genotype configurations are excluded from the analysis. Furthermore, if Mendelian inconsistencies are more frequent for certain markers or families, this suggests that there are fundamental problems with the genotyping for these markers/families and, it is common practice to exclude them from the analysis altogether. Markers and/or families with more than five Mendelian inconsistencies are generally removed from the analysis.
For population-based designs, the presence of genotyping errors resulting in either misclassification and or missing genotypes does not cause bias under the null provided errors/missingness is non-differential in cases and controls. By non-differential, we mean errors occur irrespective of case or control status. Genotyping cases and controls separately can lead to differential genotyping errors, and considerable bias in association tests. With non-differential genotyping errors, there is no bias under the null and the effect of the genotyping error is to simply decrease the overall power of the GWAS for the population design.
For family-based designs, the effects of genotyping errors are different. It is a well described phenomenon in the literature (Gordon et al. (2001),2002; Douglas, Skol and Boehnke (2002); Sobel,Papp and Lange (2002); Kang, Gordon and Finch (2004)) that genotyping errors can cause biased tests with inflated significance levels. With families, it will be possible to identify some of the misclassified genotypes by verifying that the offspring’s genotype is not plausible based on the parental genotypes (or in some cases, sibling genotypes). However, by removing families with transmission inconsistencies from the association analysis, only a fraction of the genotyping error is eliminated from the analysis. In the computation of the test statistic, this causes a seeming over-transmission of the major allele, which leads to the anti-conservativeness of the family-based association test.
Thus, while population-based studies have reduced power in the presence of genotyping errors, family-based studies will, in addition to that, have inflated pre-specified significance levels. To judge the relative importance of this fundamental difference between the two study-design types, it is important to consider the main purpose of GWA studies. Their goal is the discovery of new genetic disease loci and their confirmation/replication in independent studies/samples. This is typically achieved by selecting the markers with the smallest -values from the GWA and trying to confirm/replicate them in independent studies. It is obvious that the presence of genotyping errors will reduce the overall power of both design types, either because of reduced power (case-control) or by both reduced power and inflated type-1 error (family designs). However, it is unclear for which design type these effects are more deleterious and careful simulation studies are much needed to address this issue.
In practice, it will be important to estimate the undetected genotyping error rate in the data in order to assess the reduction in overall-power of the GWA study that is attributable to this error source. Otherwise, if a GWA is unable to identify new loci, it is unclear whether this is due the actual absence of genetic risk loci or due to the reduction in overall power caused by poor genotyping quality. Family-based studies offer a unique possibility to estimate the undetected genotyping error rate. By looking at the transmission pattern of the common allele for all genotyped markers in a GWA study, an overall/genome-wide FBAT statistic can be computed and the undetected genotyping error rate in the study can be estimated through simulations under various error models (Fardo, Ionita and Lange (2008)).
4 Testing Strategies for the Multiple Comparison Problem in Genome-Wide Association Studies
With mapping arrays for more than one million SNPs now available (Matsuzaki et al. (2004);Di et al. (2005); Gunderson et al. (2006); Wadma (2006)), genome-wide association studies carry the promise to identify replicable associations between important genetic risk factors and most complex diseases. One of the major hurdles that needs to be addressed in order to make genome-wide association studies successful is the multiple comparison problem. Hundreds of thousands of SNPs are genotyped and examined for potential associations with multiple phenotypes, possibly using different model assumptions, resulting in potentially millions of statistical tests.
Initial efforts to resolve this problem with case-control designs were directed toward multi-stage designs involving multiple independent samples. At stage 1, all SNPs are tested in a relatively small sample and the most significant ones retained for testing with a larger, independent sample; the winnowing process can be repeated multiple times. However, Skol et al. (2006) showed that such designs are inherently less powerful than designs which use all samples for the final analysis of selected SNPs, even though Bonferroni adjustment must be made for testing all SNPs. Thus, the desired strategy now for population based designs is to select a large enough sample (3–5000 cases and an equal number of controls) to achieve sufficient power for all SNPs simultaneously, but also utilize independent “replication” samples which are different from the original sample in some distinct way, for example, non-overlapping populations.
Other strategies to ameliorate the multiple comparisons problem utilize some “outside” information, for example, information from linkage studies, functional SNPs, etc. Such approaches include Bayesian approaches which use prior distributions to specify effects for markers (Wakefield (2008)), weighted Bonferroni methods which assign different significance levels to each SNP according to their “importance or relevance” (Roeder, Devlin andWasserman (2007); Eskin (2008)) and split-sample approaches (Wasserman and Roeder (2006);Song et al. (2007)). For family-based associationtests, the idea of using “outside information” naturally translates to the use of the information about the association at a population-based level that is not utilized in the family-based association test.
A general approach to two-stage testing for family designs builds on the two information sources about association that are present in family-based designs. Using the notation introduced in Section 2 for the distribution of and , the joint distribution for , and (or, equivalently, ) can be partitioned into two statistically independent components (Laird and Lange (2006)),
| (4) |
where represents additional parameters required to model the parental genotype distribution, for example, genotype frequencies and possible non-random mating. Note that both components, and will have information about , but the information from , will depend on the parental genotype distribution, and can be sensitive to population substructure.
For the first step of the testing strategy, the screening step, we use the information in , to estimate the association parameters; the second, or testing step, uses . The likelihood decomposition implies that both steps of the testing strategy are independent. The “evidence for association” estimated from can be utilized in the testing stage, without having to adjust the test for the estimation of the genetic effect size in the first stage. Several methods have been suggested to exploit this relationship in developing testing strategies which use both forms of information in order to increase power, while retaining robustness of the test.
Van Steen et al. (2005a) originally proposed a version of this two-step testing strategy for the analysis of quantitative traits. First, an effect size is estimated for each SNP by regressing the offspring phenotype on ; this effect size is used to calculate the estimated power of the FBAT statistic for each SNP (Lange and Laird (2002)). Some number of top ranking SNPs (10 or 20) were selected for testing with the FBAT statistic at the second stage. Because of the independence, both steps can be applied to the same data set without having to adjust the overall significance level for the multiple usage of the data. An extension by Ionita-Laza et al. (2007) proposed testing all SNPs at the second stage using weighted Bonferroni. Extensions of this testing strategy are available for using parental phenotypes and arbitrary structures at the screening stage (Feng, Zhang and Sha (2007)) and for case/control designs (Zheng et al. (2007)).
The Van Steen approach has three key advantages: (1) The method achieves statistical power levels which can be substantially higher than those of standard family-based approaches and is thereby able to establish genome-wide significance withsmaller/more realistic sample sizes (Van Steen et al. (2005b); Ionita-Laza et al. (2007); Feng, Zhang and Sha (2007); Zheng et al. (2007)). (2) The Van Steen algorithm maintains the separation between the multiple testing problem and the replication process. Replication attempts in different studies are reserved for the generalization of the established associations and the assessment of heterogeneity between study populations. (3) Since genome-wide significance is established in the first data set, the number of SNPs that is pushed forward to true replication in other populations is generally very small and does not require a large budget, which makes simultaneous replication attempts in multiple samples feasible. Extensive simulation studies have shown that 2-stage testing strategies that utilize both sources of information about the association can help family-based studies to achieve power levels that are similar to those of population-based studies, while maintaining the original advantages of family-based study, that is, complete robustness against confounding.
By looking at the distribution of parental mating types in ascertained samples , Murphy et al. (2008) extended the general approach to the trio-designs in which all probands are affected . Even here, the application of 2-stage Van Steen-testing strategies can lead to meaningful power improvements over the standard TDT. Other possibilities for utilizing the information from the screening step include specifying “tuning-parameters” in the FBAT-statistic (Lange et al. (2004); Jiang et al. (2006)) so that the power of the FBAT test is maximized.
5 Discussion
Family designs have historically been popular because of their robustness to population substructure. An additional, often unappreciated, feature of family-designs which is important with measured or time-to-onset outcomes is their robustness to model specification, and the ability to utilize the population information to specific unknown parameters in the model. With the availability of modern SNP chips, and genotyping of thousands of subjects on hundreds of thousands of markers, we now have the potential to identify the genetic backgrounds of individuals, and utilize that information to control for confounding by population substructure in case-control studies (Roeder and Luca (2008)). An important question is whether or not there is a need for family designs in the era of GWAS, given the potential to resolve difficulties with population substructure in case control designs. Additional studies and experience with actual studies are needed to compare the performance of family designs and adjusted case-control designs in GWAS settings.
Hampered by limitations in terms of power in many scenarios, and by the difficulty of recruitment, family-based designs certainly cannot be considered as the gold standard approach in genome-wide association studies. However, given the unique properties and features of a family design, they will continue to play a pivotal role in large scale association studies.
In multi-stage genome-wide association studies, family-based studies should be utilized as one of the stages as early as the budget permits its implementation. Their complete robustness against both genetic confounding and misspecification of the phenotypic model provides them with an important role in the process of replicating and validating findings of the discovery step. Given the unavoidable genetic and phenotypic heterogeneity in large-scale multi-stage genome-wide association studies, this feature of family-based association tests is crucial and should not be ignored. If the budget permits the additional genotyping cost, family-studies can be a favorable choice for the first stage of a genome-wide association study. There, family-based studies can be designed so that they have equivalent power topopulation-based studies and, at the same time, offer a unique combination of additional analysis features and robustness properties.
While the analysis features of family-based designs make them an attractive choice in the design phase of genome-wide studies, their abilities to assess the magnitude of the hidden genotyping error should always be utilized, even with case/control designs. By genotyping a small number of families on the same platform with the case/control samples, researchers can examine the genotyping quality of the data after the QC process and assess the true power of the study.
Appendix
Here we do some simple calculations which illustrate the power differences between case-control and trio designs. The basic idea is to calculate the expected value of the corresponding statistics under the alternative. To make the calculations simple, we use a relative risk model, and we assume that allele frequency, the relative risk and prevalence are small. We use the following notation: disease allele frequency, relative risk, prevalence, , where indicates disease, and indicates the recessive genotype. Assuming the Hardy–Weinberg Equilibrium holds in the population, and .
For the case-control design, we compute
and letting , we have that the expected is approximately
| (6) |
where is the number in each group. For , , and , this gives , and , which corresponds to the notion of zero power if .
For the trio design, we consider the 2 informative mating types, that is, 2 heterozygous parents (Type 1) and one heterozygous parent and one rare homozygous parent (Type 2). Under the alternative hypothesis, the expected number of families for each mating type can be calculated by {longlist}
,
.
Next, we compute the Mendelian residuals which are defined as the expected marker score under the alternative hypothesis minus the expected marker score under the null-hypothesis for both mating types: {longlist}
,
.
The variance of the mating-types used in the denominators of the FBAT statistics are given by 316 and 14 respectively.
Then the expected FBAT-statistic for a recessive model under the alternative hypothesis is given by
| (7) |
For the parameters given above, this equals , which results in the observed power levels of the plot for .
Acknowledgments
Supported in part by a grant from the National Institute of Mental Health.
References
- Clayton (1999) Clayton, D. (1999). A generalization of the transmission/disequilibrium test for uncertain-haplotype transmission. Am. J. Hum. Genet. 65 1170–1177.
- Devlin and Roeder (1999) Devlin, B. and Roeder, K. (1999). Genomic control for association studies. Biometrics 55 997–1004.
- Di et al. (2005) Di, X., Matsuzaki, H., Webster, T. A., Hubbell, E., Liu, G., Dong, S., Bartell, D., Huang, J., Chiles, R., Yang, G., Shen, M. M., Kulp, D., Kennedy, G. C., Mei, R., Jones, K. W. and Cawley, S. (2005). Dynamic model based algorithms for screening and genotyping over 100k snps on oligonucleotide microarrays. Bioinformatics 21 1958–1963.
- Douglas, Skol and Boehnke (2002) Douglas, J. A., Skol, A. D. and Boehnke, M. (2002). Probability of detection of genotyping errors and mutations as inheritance inconsistencies in nuclear-family data. Am. J. Hum. Genet. 70 487–495.
- Dudbridge (2008) Dudbridge, F. (2008). Likelihood-based association analysis for nuclear families and unrelated subjects with missing genotype data. Hum. Hered. 66 87–98.
- Eskin (2008) Eskin, E. (2008). Increasing power in association studies by using linkage disequilibrium structure and molecular function as prior information. Genome Res. 18 653–660.
- Falk and Rubinstein (1987) Falk, C. T. and Rubinstein, P. (1987). Haplotype relative risks: An easy reliable way to construct a proper control sample for risk calculations. Ann. Hum. Genet. 51 227–233.
- Fardo, Ionita and Lange (2008) Fardo, D. W., Ionita, I. and Lange, C. (2008). Recovering unused information in genome-wide association studies: The benefit of analyzing snps out of hardy-Weinberg equilibrium. European Journal of Human Genetics 17 1676–1682.
- Feingold, Brown and Siegmund (1993) Feingold, E., Brown, P. O. and Siegmund, D. (1993). Gaussian models for genetic linkage analysis using complete high-resolution maps of identity by descent. Am. J. Hum. Genet. 53 234–251.
- Feng, Zhang and Sha (2007) Feng, T., Zhang, S. and Sha, Q. (2007). Two-stage association tests for genome-wide association studies based on family data with arbitrary family structure. European Journal of Human Genetics 15 1169–1175.
- Gordon et al. (2002) Gordon, D., Finch, S. J., Nothnagel, M. and Ott, J. (2002). Power and sample size calculations for case-control genetic association tests when errors are present: Application to single nucleotide polymorphisms. Hum. Hered. 54 22–33.
- Gordon et al. (2001) Gordon, D., Heath, S. C., Liu, X. and Ott, J. (2001). A transmission/disequilibrium test that allows for genotyping errors in the analysis of single-nucleotide polymorphism data. Am. J. Hum. Genet. 69 371–380.
- Gunderson et al. (2006) Gunderson, K. L., Steemers, F. J., Ren, H., Ng, P., Zhou, L., Tsan, C., Chang, W., Bullis, D., Musmacker, J., King, C., Lebruska, L. L., Barker, D., Oliphant, A., Kuhn, K. M. and Shen, R. (2006). Whole-genome genotyping. Methods Enzymol. 410 359–376.
- Horvath et al. (2004) Horvath, S., Xu, X., Lake, S. L., Silverman, E. K., Weiss, S. T. and Laird, N. M. (2004). Family-based tests for associating haplotypes with general phenotype data: Application to asthma genetics. Genetic Epidemiology 26 61–69.
- Ionita-Laza et al. (2007) Ionita-Laza, I., McQueen, M. B., Laird, N. M. and Lange, C. (2007). Genomewide weighted hypothesis testing in family-based association studies, with an application to a 100k scan. Am. J. Hum. Genet. 81 607–614.
- Jiang et al. (2006) Jiang, H., Harrington, D., Raby, B. A., Bertram, L., Blacker, D., Weiss, S. T. and Lange, C. (2006). Family-based association test for time-to-onset data with time-dependent differences between the hazard functions. Genetic Epidemiology 30 124–132.
- Kang, Gordon and Finch (2004) Kang, S. J., Gordon, D. and Finch, S. J. (2004). What snp genotyping errors are most costly for genetic association studies? Genetic Epidemiology 26 132–141.
- Laird and Lange (2006) Laird, N. M. and Lange, C. (2006). Family-based designs in the age of large-scale gene-association studies. Nat. Rev. Genet. 7 385–394.
- Lange, DeMeo and Laird (2002) Lange, C., DeMeo, D. L. and Laird, N. M. (2002). Power and design considerations for a general class of family-based association tests: Quantitative traits. Am. J. Hum. Genet. 71 1330–1341.
- Lange and Laird (2002) Lange, C. and Laird, N. M. (2002). Power calculations for a general class of family-based association tests: Dichotomous traits. Am. J. Hum. Genet. 71 575–584.
- Lange et al. (2003) Lange, C., Silverman, E. K., Xu, X., Weiss, S. T. and Laird, N. M. (2003). A multivariate family-based association test using generalized estimating equations: Fbat-gee. Biostatistics 4 195–206.
- Lange et al. (2004) Lange, C., Van Steen, K., Andrew, T., Lyon, H., DeMeo, D., Raby, B., Murphy, A., Silverman, E., MacGregor, A., Weiss, S. and Laird, N. (2004). A family-based association test for repeatedly measured quantitative traits adjusting for unknown environmental and/or polygenic effects. Stat. Appl. Genet. Mol. Biol. 3.
- Lazzeroni and Lange (1993) Lazzeroni, L. C. and Lange, K. (1993). A conditional inference framework for extending the transmission/disequilibrium test. Hum. Hered. 48 67–81.
- Liu et al. (2002) Liu, Y., Tritchler, D. and Bull, S. B. (2002). A unified framework for transmission-disequilibrium test analysis of discrete and continuous traits. Genetic Epidemiology 22 26–40.
- Lu and Cantor (2007) Lu, A. T. and Cantor, R. M. (2007). Weighted variance fbat: A powerful method for including covariates in fbat analyses. Genetic Epidemiology 31 327–337.
- Lunetta et al. (2000) Lunetta, K. L., Faraone, S. V., Biederman, J. and Laird, N. M. (2000). Family-based tests of association and linkage that use unaffected sibs, covariates, and interactions. Am. J. Hum. Genet. 66 605–614.
- Manolio et al. (2007) Manolio, T. A., Rodriguez, L. L., Brooks, L., Abecasis, G., Ballinger, D., Daly, M., Donnelly, P., Faraone, S. V., Frazer, K., Gabriel, S., Gejman, P., Guttmacher, A., Harris, E. L., Insel, T., Kelsoe, J. R., Lander, E., McCowin, N., Mailman, M. D., Nabel, E., Ostell, J., Pugh, E., Sherry, S., Sullivan, P. F., Thompson, J. F., Warram, J., Wholley, D., Milos, P. M. and Collins, F. S. (2007). New models of collaboration in genome-wide association studies: The genetic association information network. Nat. Genet. 39 1045–1051.
- Marchini et al. (2007) Marchini, J., Howie, B., Myers, S., McVean, G. and Donnelly, P. (2007). A new multipoint method for genome-wide association studies by imputation of genotypes. Nat. Genet. 39 906–913.
- Matsuzaki et al. (2004) Matsuzaki, H., Dong, S., Loi, H., Di, X., Liu, G., Hubbell, E., Law, J., Berntsen, T., Chadha, M., Hui, H., Yang, G., Kennedy, G. C., Webster, T. A., Cawley, S., Walsh, P. S., Jones, K. W., Fodor, S. P. and Mei, R. (2004). Genotyping over 100,000 snps on a pair of oligonucleotide arrays. Nat. Methods 1 109–111.
- Murphy, Weiss and Lange (2008) Murphy, A., Weiss, S. T. and Lange, C. (2008). Screening and replication using the same data set: Testing strategies for family-based studies in which all probands are affected. PLoS Genetics 4 e1000197.
- Ott (1989) Ott, J. (1989). Statistical properties of the haplotype relative risk. Genetic Epidemiology 6 127–130.
- Pritchard, Stephens and Donnelly (2000) Pritchard, J. K., Stephens, M. and Donnelly, P. (2000). Inference of population structure using multilocus genotype data. Genetics 155 945–959.
- Rabinowitz and Laird (2000) Rabinowitz, D. and Laird, N. (2000). A unified approach to adjusting association tests for population admixture with arbitrary pedigree structure and arbitrary missing marker information. Hum. Hered. 50 211–223.
- Rakovski et al. (2007) Rakovski, C. S., Xu, X., Lazarus, R., Blacker, D. and Laird, N. M. (2007). A new multimarker test for family-based association studies. Genetic Epidemiology 31 9–17.
- Roeder, Devlin and Wasserman (2007) Roeder, K., Devlin, B. and Wasserman, L. (2007). Improving power in genome-wide association studies: Weights tip the scale. Genetic Epidemiology 31 741–747.
- Roeder and Luca (2008) Roeder, K. and Luca, D. (2008). Searching for disease susceptibility variants in structured populations. Genomics. (Epub ahead of print.)
- Schaid (1996) Schaid, D. J. (1996). General score tests for associations of genetic markers with disease using cases and their parents. Genetic Epidemiology 13 423–449.
- Schneiter, Laird and Corcoran (2005) Schneiter, K., Laird, N. and Corcoran, C. (2005). Exact family-based association tests for biallelic data. Genetic Epidemiology 29 185–194.
- Skol et al. (2006) Skol, A. D., Scott, L. J., Abecasis, G. R. and Boehnke, M. (2006). Joint analysis is more efficient than replication-based analysis for two-stage genome-wide association studies. Nat. Genet. 38 209–213.
- Sobel, Papp and Lange (2002) Sobel, E., Papp, J. C. and Lange, K. (2002). Detection and integration of genotyping errors in statistical genetics. Am. J. Hum. Genet. 70 496–508.
- Song et al. (2007) Song, K., Lu, Q., Lin, X., Waterworth, D. and Elson, R. C. (2007). Genome-wide association studies using an adaptive two-stage analysis for a case-control design. BMC Proc 1 S147.
- Spielman, McGinnis and Ewens (1993) Spielman, R. S., McGinnis, R. E. and Ewens, W. J. (1993). Transmission test for linkage disequilibrium: The insulin gene region and insulin-dependent diabetes mellitus (iddm). Am. J. Hum. Genet. 52 506–516.
- Van Steen et al. (2005a) Van Steen, K., McQueen, M. B., Herbert, A., Raby, B., Lyon, H., Demeo, D. L., Murphy, A., Su, J., Datta, S., Rosenow, C., Christman, M., Silverman, E. K., Laird, N. M., Weiss, S. T. and Lange, C. (2005a). Genomic screening and replication using the same data set in family-based association testing. Nat. Genet. 37 683–691.
- Van Steen et al. (2005b) Van Steen, K., McQueen, M. B., Herbert, A., Rosenow, C., Silverman, E. K., Laird, N. M., Weiss, S. T. and Lange, C. (2005b). Genomic screening in family based association testing and the multiple testing problem. Genetic Epidemiology 29 282–282.
- Wadma (2006) Wadma, M. (2006). The chips are down. Nature Digest 4 256–257.
- Wakefield (2008) Wakefield, J. (2008). Bayes factors for genome-wide association studies: Comparison with -values. Genetic Epidemiology. (Epub ahead of print.)
- Wasserman and Roeder (2006) Wasserman, L. and Roeder, K. (2006). Weighted hypothesis testing. Technical Report 83, Dept. Statistics, Carnagie Mellon Univ. Available at http://www.citebase.org/abstract?id=oai:arXiv.org:math/ 0604172.
- Weinberg (1999) Weinberg, C. R. (1999). Methods for detection of parent-of-origin effects in genetic studies of case-parents triads. Am. J. Hum. Genet. 65 229–235.
- Whittemore (2006) Whittemore, A. S. (2006). Population structure in genetic association studies. In Proceedings of the Joint Statistical Meeting.
- Xu et al. (2006) Xu, X., Rakovski, C., Xu, X. and Laird, N. (2006). An efficient family-based association test using multiple markers. Genetic Epidemiology 30 620–626.
- Zheng et al. (2007) Zheng, G., Song, K. and Elston, R. C. (2007). Adaptive two-stage analysis of genetic association in case-control designs. Human Heredity 63 175–186.