Characterization of an INVS Model IV Neutron Counter for High Precision () Cross-Section Measurements
Abstract
A neutron counter designed for assay of radioactive materials has been adapted for beam experiments at TUNL. The cylindrical geometry and 60% maximum efficiency make it well suited for () cross-section measurements near the neutron emission threshold. A high precision characterization of the counter has been made using neutrons from several sources. Using a combination of measurements and simulations, the absolute detection efficiency of the neutron counter was determined to an accuracy of 3% in the neutron energy range between 0.1 and 1 MeV. It is shown that this efficiency characterization is generally valid for a wide range of targets.
pacs:
29.40.Cs, 28.20.Gd, 07.05.Tp, 27.10.+h, 27.20.+n, 02.70.UuI Introduction:
The model IV inventory sample counter (INVS) developed at Los Alamos National Laboratory Sprinkle Jr. et al. (1993) was designed for fast, non-destructive assay of radioactive materials. Specialized inserts for the axial bore of this neutron counter have been made to adapt it for use as the primary neutron detector for in-beam (,n) total cross section measurements. Development and testing of this counter took place at TUNL using hadron beams in the tandem laboratory and the -ray beam at the High Intensity Gamma-ray Source (HIS) Weller et al. (2009).
Such measurements require detailed and accurate information about the energy-dependent absolute neutron detection efficiency of the counter. Efficiency here is generally defined as
| (1) |
The efficiency measurements were made using four different sources, each with a precisely known neutron emission rate. First, a 252Cf source, calibrated by the National Institute of Standards and Technology (NIST), generated a flux of neutrons known to 4.4% Thompson (2009). Second, a coincidence experiment using the 2H()3He reaction provided a mono-energetic source of 2.26 MeV neutrons with flux known to 10%, and gave insight into the thermalization time of neutrons in the INVS. Third, an investigation of the 7Li()7Be reaction produced 1 MeV neutron sources with fluxes known to 6.6%. Finally, the 2H()1H reaction was used to produce tunable sources of monoenergetic neutrons (0.1 En 1.0 MeV) with fluxes known to 3% accuracy. A comparison of all experimental data with simulations demonstrates varying levels of agreement.
The following sections describe the detector geometry (Sect. II) followed by details for each experimental setup (Sect. III) including discussions of backgrounds, calculations, measurement uncertainties and results. Section IV contains a discussion of Monte Carlo simulations used for comparison with experimental results. Finally, Sect. V offers a summary of the results and a discussion of future applications of the INVS counter for cross-section measurements.
II Detector Description:
The active detection elements in the INVS counter are 18 tubular proportional counters, each containing 6 atm. of 3He. The tubes are arranged in two concentric rings at radii 7.24 cm and 10.60 cm each containing nine equally spaced detectors (see Fig. 1). The detectors are embedded in a cylindrical polyethylene body 46.2 cm long and 30.5 cm in diameter which serves as a neutron moderator. The active length of the 3He gas within the tubes is 39.4 cm Sprinkle Jr. et al. (1993). The detector body has an 8.9 cm diameter axial cavity designed to contain the neutron source. Throughout this manuscript the term longitudinal center refers to the center of the detector with respect to the length of the detector body, and is distinguished from the term axial center which refers to the axis of the detector.
In experiments with beam, the irradiated target is the source of neutrons. During all but one of the experiments described here, the neutron-emitting source was located inside the detector cavity, usually near the longitudinal center. The cavity was partially filled with additional neutron moderator (often graphite and/or polyethylene) to increase the detection efficiency. The additional moderator was arranged so that the beam could pass through the detector without intercepting moderator material.
Thermalization of the neutrons within the detector body increases the probability for initiating the 3He()3H reaction within the embedded tubes. An energy of 763.7 keV, shared between the outgoing proton and triton, is released from each reaction. Most of the kinetic energy is lost to ionization of 3He, which is detected as an electrical pulse on the central electrode of each tube which is biased to 1780 V. A fixed threshold effectively discriminates against low-pulse-height signals generated by -rays and electronic noise. Signals above the threshold generate 50 ns wide TTL pulses using on-board electronics. Onboard signal-processing electronics within the detector produce three TTL logic output signals; the inner ring (); the outer ring (); and the logical OR of the and pulses (). Whenever one or more tubes in the inner (outer) ring detect a neutron, a pulse is generated on the () output. For neutrons with energies less than about 2 MeV, the I/O ratio can provide a reasonable determination of the mean of the energy distribution of the detected neutrons.


III Experiments:
In this section, the experimental setup and techniques used to measure the efficiency of the counter are described, and the results of the each measurement are presented. Discussion of the results will be presented in the next section. Four different sources of neutrons were used to cover an energy range from about 0.1 to 10 MeV.
III.1 252Cf
Californium-252 is a standard calibration source for neutron detectors. The effective half life of 252Cf is 2.645 years and is due to alpha particle emission and spontaneous fission which produces a neutron yield of 2.314 106 neutrons/s/g Martin et al. (1999). The energy spectrum of neutrons from 252Cf is well known Smith et al. (1957). A calibrated 252Cf source provides a single measurement of efficiency representing the response of the detector to a broad spectrum of neutron energies.
The 252Cf source used consisted of 3.15 ng of active powdered material encapsulated within a small aluminum pellet. The source was suspended on the axis of the detector approximately 3.4 cm from longitudinal center. Graphite moderator filled most of the volume of the cavity. A table of neutron activity versus date was provided by NIST Thompson (2009). The experimentally determined efficiency for this configuration (shown in Fig. 1) was 40.5 1.8 %. The experimental I/O ratio was 1.516 0.004.
The dependence of the detection efficiency on the position of the source within the central cavity was determined by making measurements with the source placed at different positions within the central bore. Measurements on the central axis were made along the entire length of the detector. The detection efficiency has a maximum value at the longitudinal center and drops off smoothly as the source is moved in either direction away from the center along the detector axis. The shape of the position dependency is a purely geometric acceptance effect and can be approximated analytically for point sources with isotropic neutron emission. The measured detection efficiency as a function of the source position along the central axis of the counter is shown in Fig. 2 and in comparison to simulated and calculated efficiencies.
The relative efficiency is directly proportional to the angular acceptance of the counter as a function of z, which is given by the equation below for an isotropic point source of neutrons.
| (2) |
Here, r is the radius of the opening at the end of the detector, L is the active length of the 3He gas, and z = 0 at L/2. This function is maximum when z = 0. For an open cavity geometry, the change in the efficiency over the length of an 8-cm long sample, centered on the axis at the longitudinal center is approximately 1%. For a geometry like the one shown in Fig. 1 the changes in efficiency are negilgibly small over a length of nearly 20 cm centered on the longitudinal center. For sources located off its central axis, the detection efficiency changes by less than 0.5% . The radial dependence of the efficiency is also mostly a geometric acceptance effect.
III.2 2H()3He
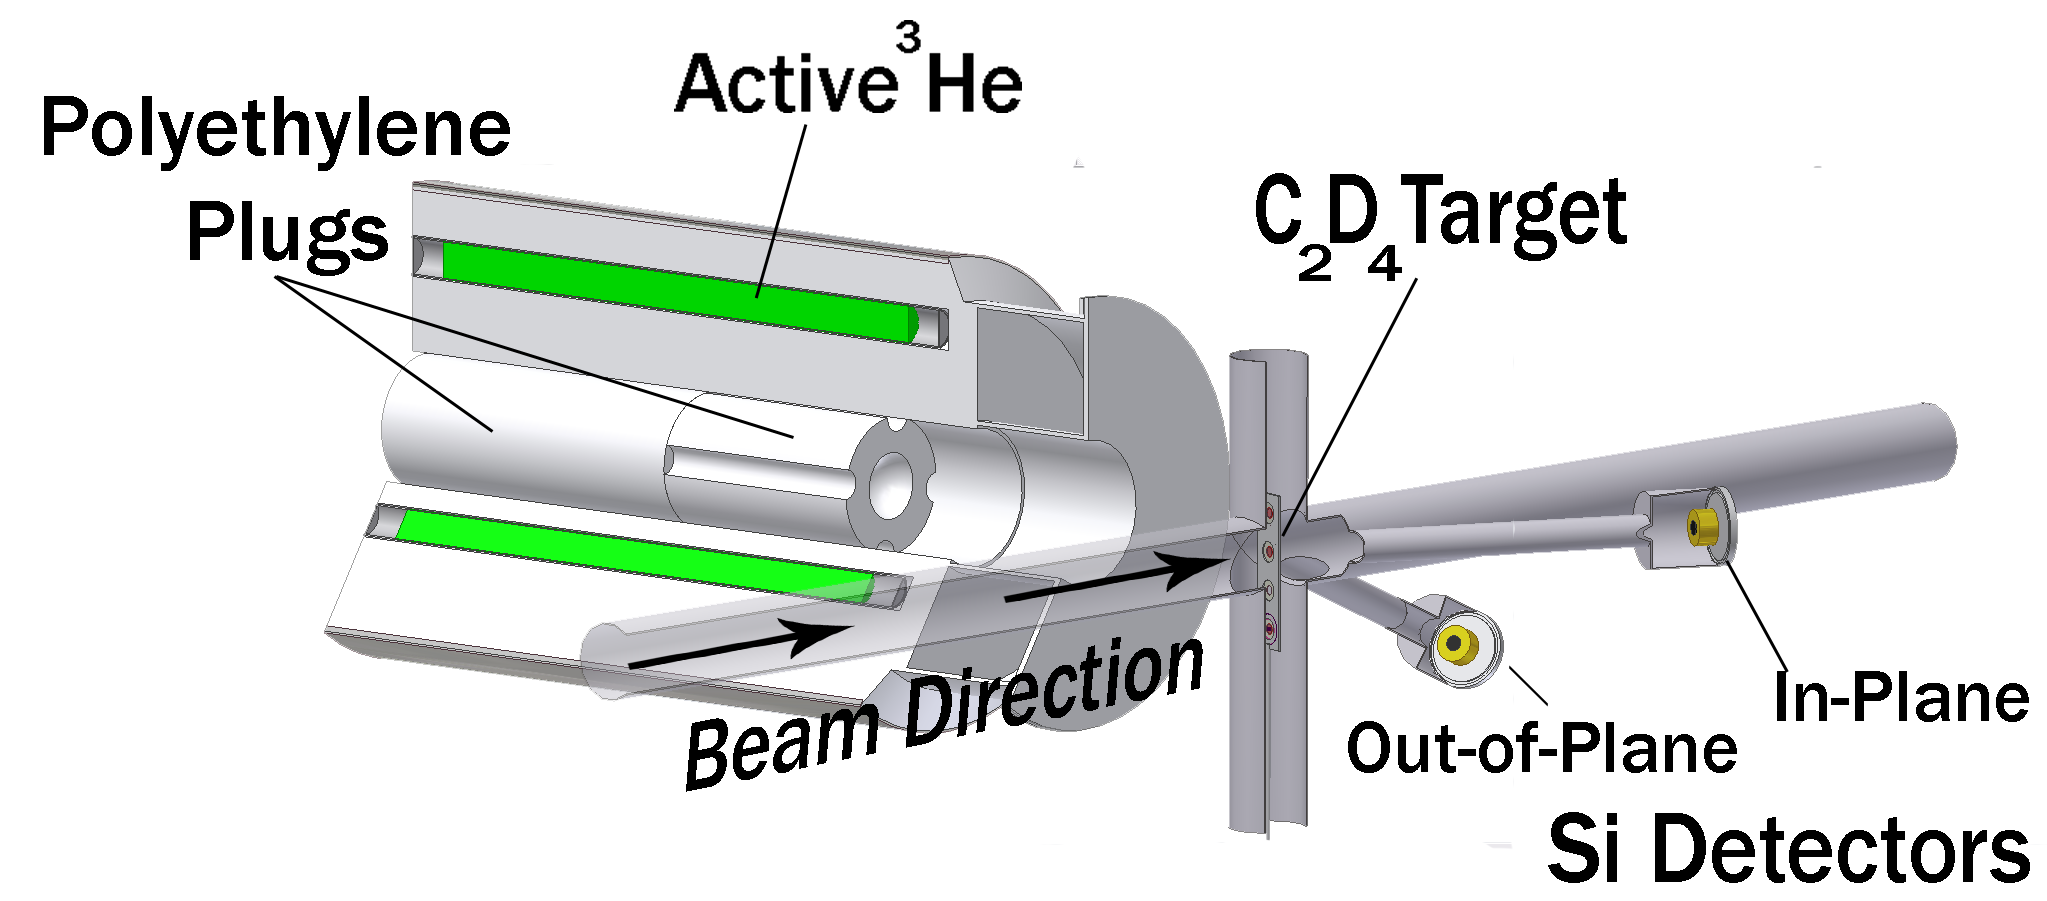
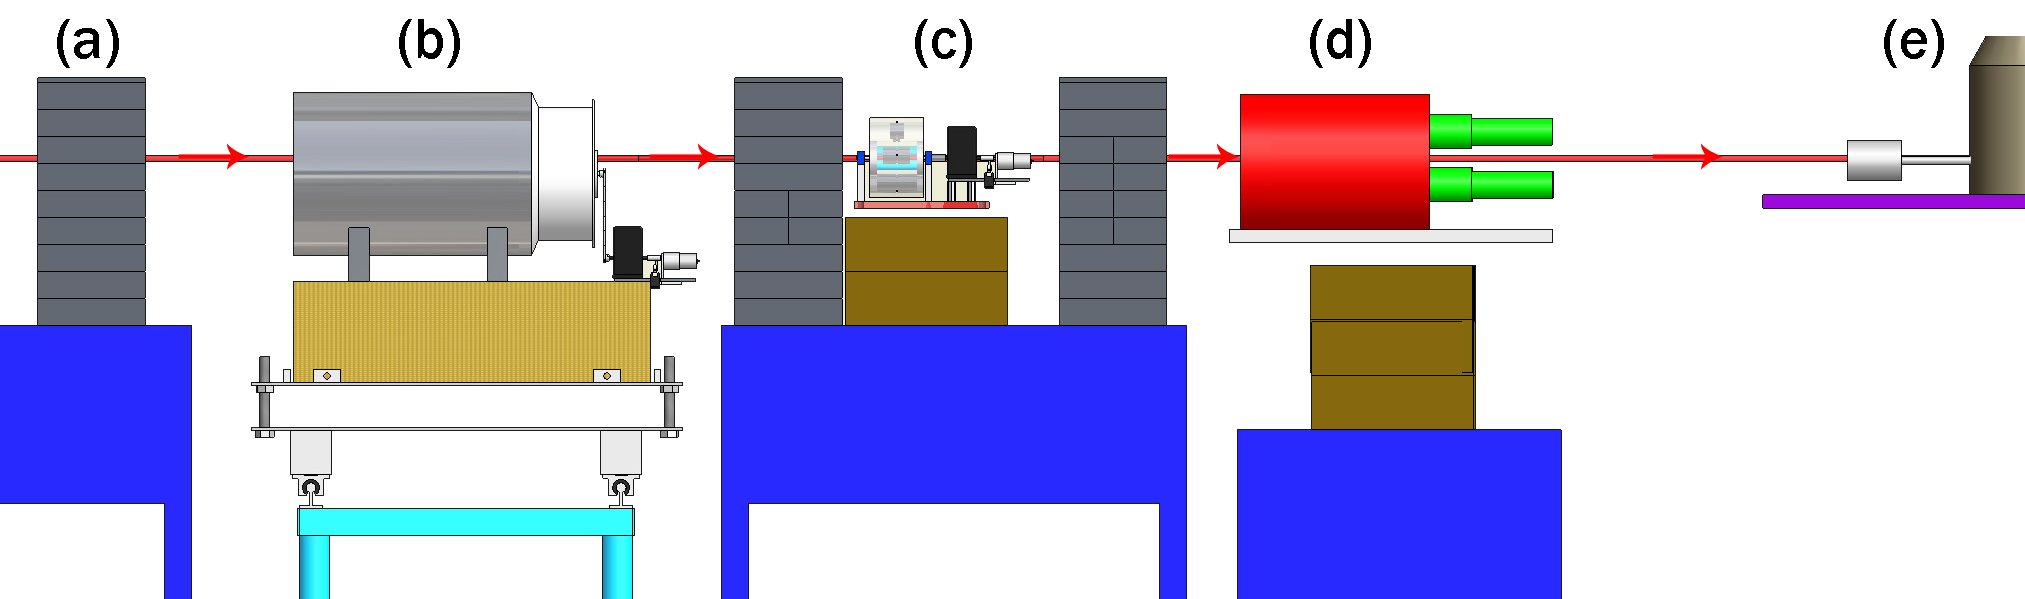
The 2H()3He reaction was used to measure the efficiency for monoenergetic 2.26 MeV neutrons. The associated particle technique was used with the recoil 3He nucleus detected in a siliFcon surface barrier detector inside an evacuated chamber. A schematic diagram of the experiment setup is shown in Fig. 3. The neutron counter was positioned so that its central axis coincided with the symmetry axis of the cone of neutrons associated with the 3He particles detected in the silicon detector on the opposite side of the incident beam axis. The distance from the longitudinal center of the counter to the deuterium target was set so that the diameter of this neutron cone was smaller than the diameter of the central cavity through the detector. The energy of the incident deuteron beam and the detection angle of the silicon detector were set to produce 2.26-MeV neutrons emitted along the central axis of the counter. With this method the efficiency is computed as
| (3) |
where N is the total number of detected 3He-particles and is the total number of neutrons detected in coincidence with the detected 3He particles. This equation takes the detection efficiency of the silicon detector to be unity. The deuterium targets used in these measurements were 100g/cm2 thick deuterated polyethylene (C2D4) evaporated onto a 10 g/cm2 thick carbon foil. The deuteron beam energy incident on the foil was 2.0 MeV, and the average beam current on the C2D4 foil was 20 nA. The cross-sectional profile of the deuteron beam at the foil was circular with a diameter of approximately 0.5 cm. Each of the two silicon detectors (one in-plane and one out-of-plane) had a solid angle acceptance d = /60 sr, and each was located at a scattering angle of = 26.50∘. Neutrons associated with detection of 3He in the in-plane Si detector exited the target at = 117.1∘ along the central axis of the neutron counter. The rear half of the central cavity was plugged with polyethylene to scatter neutrons traveling through the central cavity into the body of the counter. The out-of-plane Si detector was used to measure the rate of accidental coincidences.
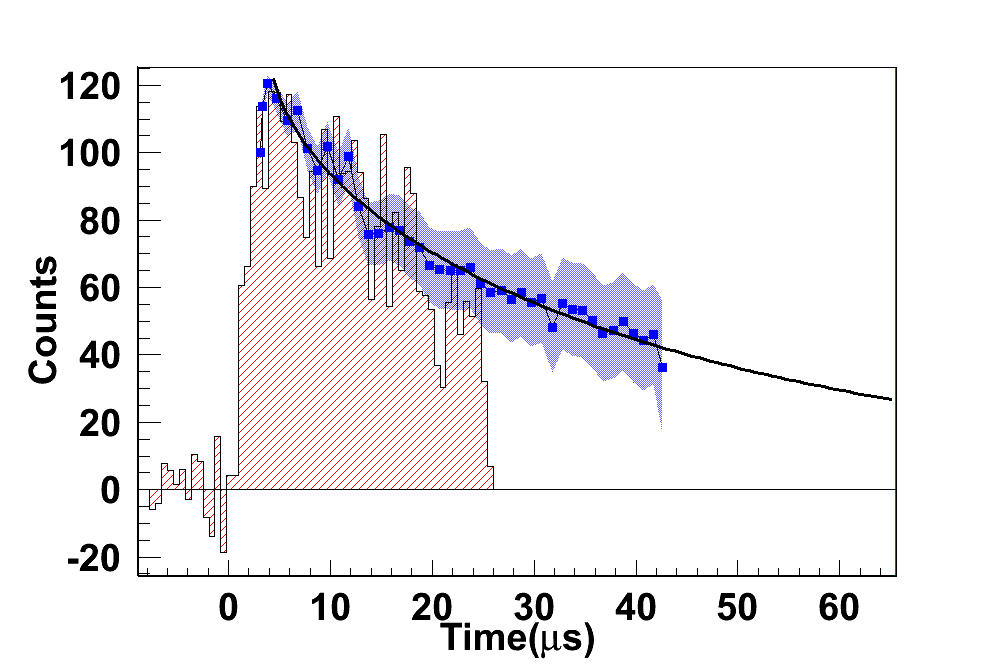
Efficiency and thermalization time were deduced simultaneously using a time-to-amplitude converter (TAC) which recorded the time between a charged particle detection in the silicon detector and a neutron detection in the INVS. A threshold setting effectively discriminated against deuteron elastic scattering events. The effective TAC range was 22.5 s. The TAC was calibrated using a pulser which started and stopped the TAC with known delay. Because the INVS is a thermalization counter, detection efficiency is time-dependent on a microsecond time-scale. A peak in the TAC spectrum at 3 s suggests a source of delay exists caused by charge collection and signal processing in the INVS counter. This delay reduces the effective TAC range to 22.5 s from 25.5 s, which is where the experimental TAC spectrum ends. The present result for neutron detection efficiency over a 22.5 s range is 11.0 1.1%.
III.3 7Li()7Be
The 7Li()7Be reaction was used to measure the energy-dependent detection efficiency over an energy range that overlaps with that covered by the 2H()1H source reaction below about 0.7 MeV and to provide data for a neutron source with the intensity distribution peaked at forward angles relative to the central detector axis Burke et al. (1974); Burke (1972). The cross section for 7Li()7Be reaction is large and has been accurately measured Gibbons and Macklin (1959) making it a good neutron source for calibrating the efficiency of detectors at low energies Sekharan et al. (1976).
III.3.1 Experimental Setup
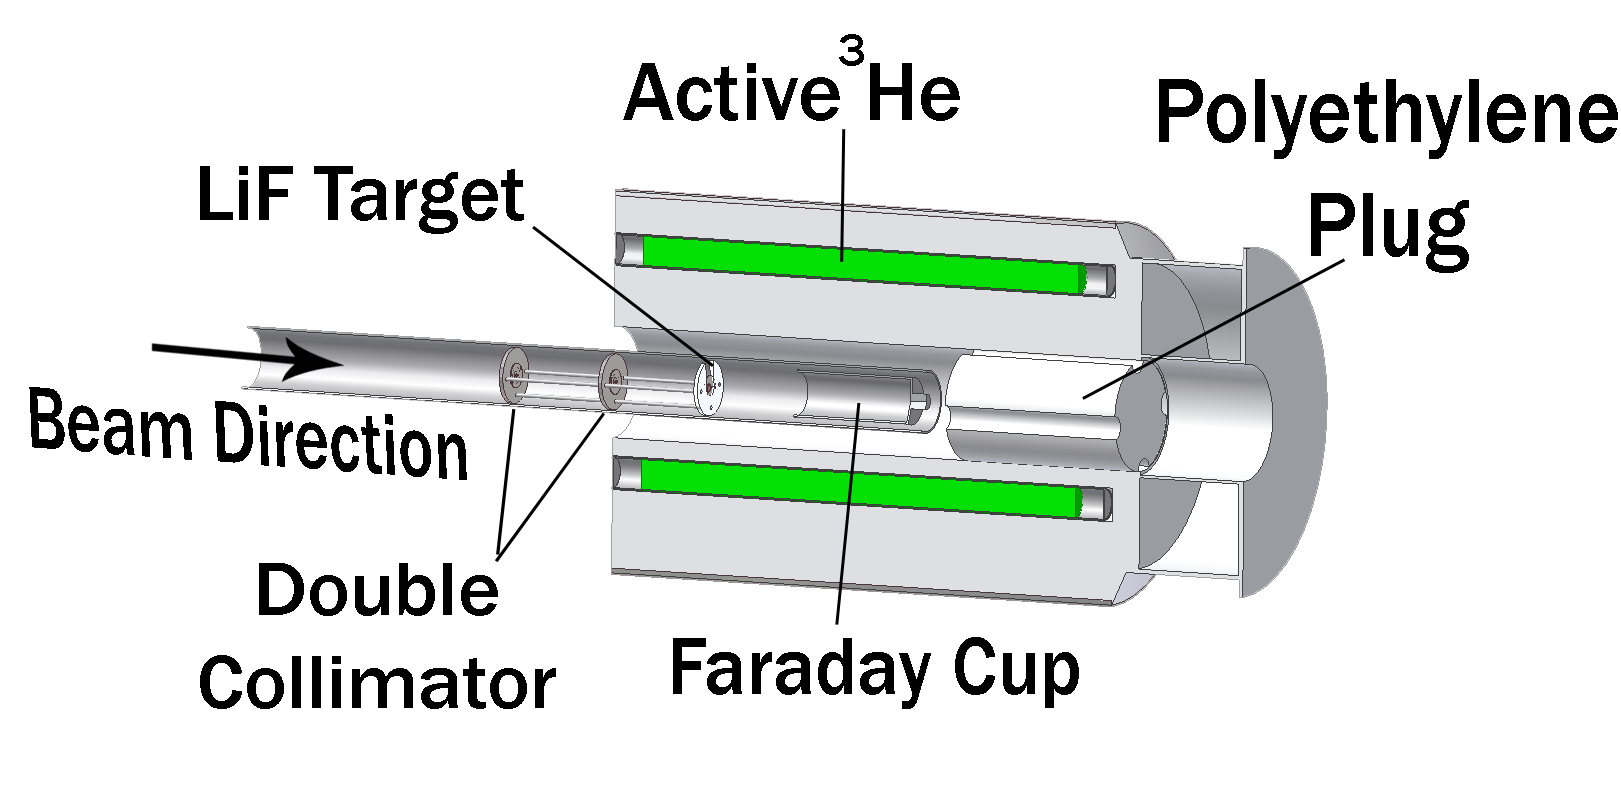
The experimental arrangement is shown in Fig. 5. The proton beam was tuned through a double collimator set onto the LiF neutron production target. The cross-sectional profile of the beam on target was circular with a diameter of 5 mm, and the average beam current on target was 100 nA. The energies of the proton beams incident on the LiF target were between 1.88 and 2.46 MeV. The neutron production target was comprised of 39.8 g/cm2 of LiF evaporated onto a 8.3 g/cm2 thick carbon backing. Targets were located on the axis of the INVS counter inside an evacuated beam pipe at 14.2 cm from the longitudunal center. The transmitted proton beam was collected in a voltage-suppressed Faraday cup at the end of the beam pipe. A polyethylene plug was placed just beyond the end of the beam pipe to increase detection efficiency. Backgrounds were measured by putting beam through both an empty target ring identical to the one that supported the LiF target, and a target ring that supported only a carbon backing. In total, beam-induced and environmental backgrounds amounted to 0.1% of real counts.
III.3.2 Results
The detection efficiency as a function of proton energy was calculated using
| (4) |
where Nn is the total number of neutrons detected, is the number of protons collected in the Faraday cup, is the number of target nuclei per unit area, and is the total cross-section of the 7Li()7Be reaction at proton energy Ep.
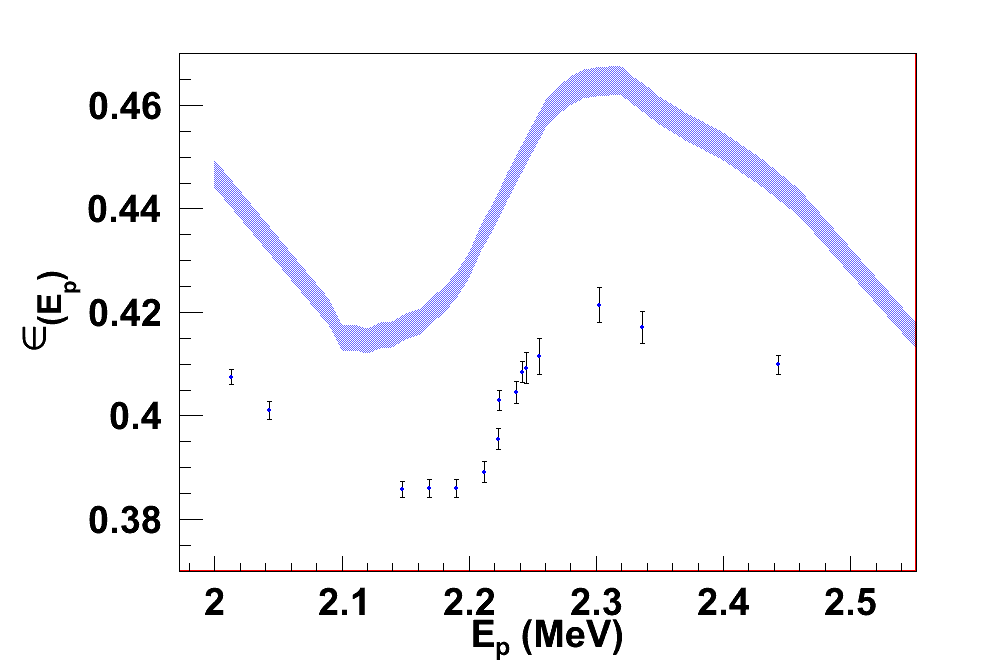
The data (see Fig. 6) display a relative minimum in efficiency near Ep = 2.13 MeV followed by a relative maximum near Ep = 2.32 MeV. These shifts in efficiency coincide with rapid changes in the angular distribution of neutrons. Though statistical uncertainties were very small, systematic uncertainties for target thickness and cross-section contributed 3.5% and 5%, respectively, resulting in an overall systematic uncertainty of 6.6%.
III.4 2H()1H
The 2H()1H measurement was unique among the experiments described here in that it produced nearly monoenergetic neutrons with very small flux uncertainties. Several efficiency measurements were made that highlighted the energy-dependent response of the detector. A schematic of the experimental setup is shown in Fig 7.
III.4.1 Experimental Setup
The target consisted of approximately 3.2 g of 99.8% enriched D2O sealed inside a thin-walled polyethylene tube that was 7.62 cm long. The target was located at longitudinal center, but 2.9 cm above the axial center, and occupied one of four 2.54 cm diameter azimuthal holes in a rotatable graphite cylinder. The other holes were available for other targets. A graphite target and an empty hole were alternately rotated into the beam during experiments to determine beam-induced backgrounds. The samples were remotely rotated into position using a four-position Geneva mechanism which assured reproducible alignment on the -ray beam axis. Most of the data were collected for -ray beams with energies between 2.48 and 4.10 MeV.
Gamma-ray production by inverse-Compton scattering at HIS is well documented Litvinenko et al. (1997); Sun et al. (2009); Weller et al. (2009). The -ray beams used in this experiment were collimated to 1.2 cm in diameter. The size of the beam, and its alignment with the target was confirmed using a -ray beam imaging system Sun (2009).
The -ray beam energy distribution was determined by a high purity germanium (HPGe) detector located on the -ray beam axis. A radioactive 60Co source, and naturally present 40K and 208Tl provided energy calibration. The FWHM of the -ray beam as determined by the HPGe was typically between 1 - 3%. A typical -ray spectrum is shown in Fig. 8.
Relative incident -ray flux was continuously monitored by three scintillating paddles located upstream from the experimental setup. The absolute -ray fluxes were determined by a cylindrical 25.4 cm 35.6 cm NaI detector located behind the active target, on the -ray beam axis. For the -ray beam energies for which it was used, the NaI detector had a total integrated efficiency of nearly 100%; In other words, nearly all -rays will interact within the detector volume and deposit energy. A threshold setting which ignored signals generated from -rays with energy less than 0.6 MeV reduced the efficiency to 97% for all experimental -ray energies as determined by simulations. This threshold setting optimized the ratio of total integrated signals to room background.
After passing through the target, the -ray flux was attenuated by machined lead attenuators to eliminate signal pile-up and dead-time effects. This allowed -ray flux on target of 10/s, and flux at the face of the detector of 10/s. Determination of the absolute beam flux from the signals measured in the NaI detector requires precise quantitative information about the effective attenuation of the beam by the lead attenuators at each -ray energy. The effective -ray attenuation, was determined for each attenuator, at several -ray energies, using the scintillating paddle system for flux normalization.
III.4.2 Background
Two sources of neutron backgrounds existed in this experiment. One source is classified as environmental backgrounds. These can be caused by either cosmic-ray neutron production or natural radioactive sources in the vicinity of the INVS counter. These sources generated 0.2 count/s per 3He tube for a total of 3.6 counts/s. The second background source arose from -ray-beam-induced events. Gamma-rays that scatter from the target can deposit enough energy to register a signal above the threshold setting. This type of background was measured by bombarding a graphite target with the -ray beam. Gamma-ray beam-induced backgrounds amounted to approximately 4.8 counts/106 -rays on target, which was typically 1% of real counts from the heavy water target, and were taken into account in the data analysis.
III.4.3 Results
For the experimental setup used in these measurements the detection efficiency for neutrons from -rays on a heavy water sample can be explicitly calculated from
| (5) |
where Nn is the number of neutrons detected, (Eγ) is the measured -ray attenuation by the lead attenuator at -ray energy Eγ, ( Eγ) is the efficiency of the NaI detector for -rays with energy Eγ, f is the thick target correction factor (described below), is the number of -rays detected, is the number of target nuclei per unit area and is the total cross-section of the 2H()1H reaction at Eγ Schiavilla (2005). The author of Ref. Schiavilla (2005) calculated the 2H()1H total cross-sections with several widely-used N-N potential models, all of which were indistinguishable to within 1%, irrespective of the model used. In addition, this cross-section agrees with the world data which have uncertainties between 3 and 6% Birenbaum et al. (1985); Moreh et al. (1989); De Graeve et al. (1992); Hara et al. (2003).

The f factor in Eqn. 5 accounts for the flux loss due to interactions with atomic electrons as the -rays propagate through the heavy water target. This factor is calculated as,
| (6) |
using NIST attenuation coefficients for heavy water Hubbell and Seltzer (1989) and the mass thickness of the target.
For photodisintegration of the deuteron and are related, in units of MeV, by
| (7) |
where -2.225 is the Q-value for the reaction, and the factor of 2.001 comes from energy sharing between the outgoing proton and neutron. Cross-sections for energies 2.48 MeV Eγ 4.10 MeV were used to ensure 1% accuracy.
The total combined statistical uncertainty in the efficiency measurements made using neutrons from deuteron photodisintegration was 2%. The main source of statistical error was in the attentuation measurements of the lead absorbers. The statistical accuracy of these measurements was determined by the counts in the scintillator paddle system used for relative flux normalization between the absorbers. A minimum of 1% statistical uncertainty was achieved for most energies. The statistical uncertainties in the -ray beam flux measurements and the neutron counting for the heavy water target were typically 0.5%.
The total systematic uncertainty was 3% and was mainly due to three sources. The uncertainty in the deuteron photodisintegration cross section was kept to less than 1% by limiting the energy range of the measurements to 2.48 MeV Eγ 4.14 MeV. Uncertainties in the target thickness and cross section contribute 0.5% and 1% respectively.
IV Discussion and Results:
IV.1 Simulations:
The Monte-Carlo code mcnpx was used to simulate all particle interactions within the INVS counter for each experiment. For all simulations, material densities for the INVS counter were fixed, and standard thermal neutron capture cross-section libraries Chadwick et al. (2006) were used. Variable parameters in each simulation were:
-
1.
the arrangement of materials inside the cavity;
-
2.
the location of the neutron emitting source;
-
3.
the energy and spatial distribution of neutrons.
Absolute detection efficiencies and I/O ratios were extracted from simulations for comparison with each experiment where applicable.
IV.1.1 252Cf
Efficiency measurements of 252Cf were made during the course of the 2H()1H experiment. Consequently, the arrangement of materials inside the INVS cavity was identical for both experiments. The energy distribution of neutrons produced by fissioning 252Cf was modeled as a Watt fission spectrum which has the form
| (8) |
where and are parameters given for 252Cf mcn (2007).
The mcnpx-simulated efficiency of 39.2% agrees with the experimentally determined efficiency of 40.5 1.8 %. The simulated I/O ratio of 1.59 falls short of agreement with the experimentally determined 1.516 0.004 due to a 6% larger efficiency for measurement in the outer ring (see Fig. 12). The source of this discrepancy is unclear.
IV.1.2 2H()3He
The simulation of the measurements made with the 2H()3He reaction were made as follows. A simulated beam of 2.26 MeV neutrons was emitted from inside an evacuated volume, through an aluminum beam-pipe wall, directed toward the axial center of a set of polyethylene plugs that filled most of the detector cavity (see Fig. 3). Because the experiment only recorded counts in the neutron detector during a 22.5 s wide time window after the associated 3He particle was detected, it was necessary to track the neutron detection time in the simulations. Therefore, a time dependent model for detection of neutrons emitted from the 2H()3He reaction was created to compare with experiment. In this model, only neutrons detected before a user-defined time counted toward efficiency. A plot of efficiency vs. time was simulated for times between t = 0 and t = 1000 s (see Fig. 9). To produce a simulated TAC spectrum, a plot of the slope of (t) vs. time was generated for comparison with data (see Fig. 4).
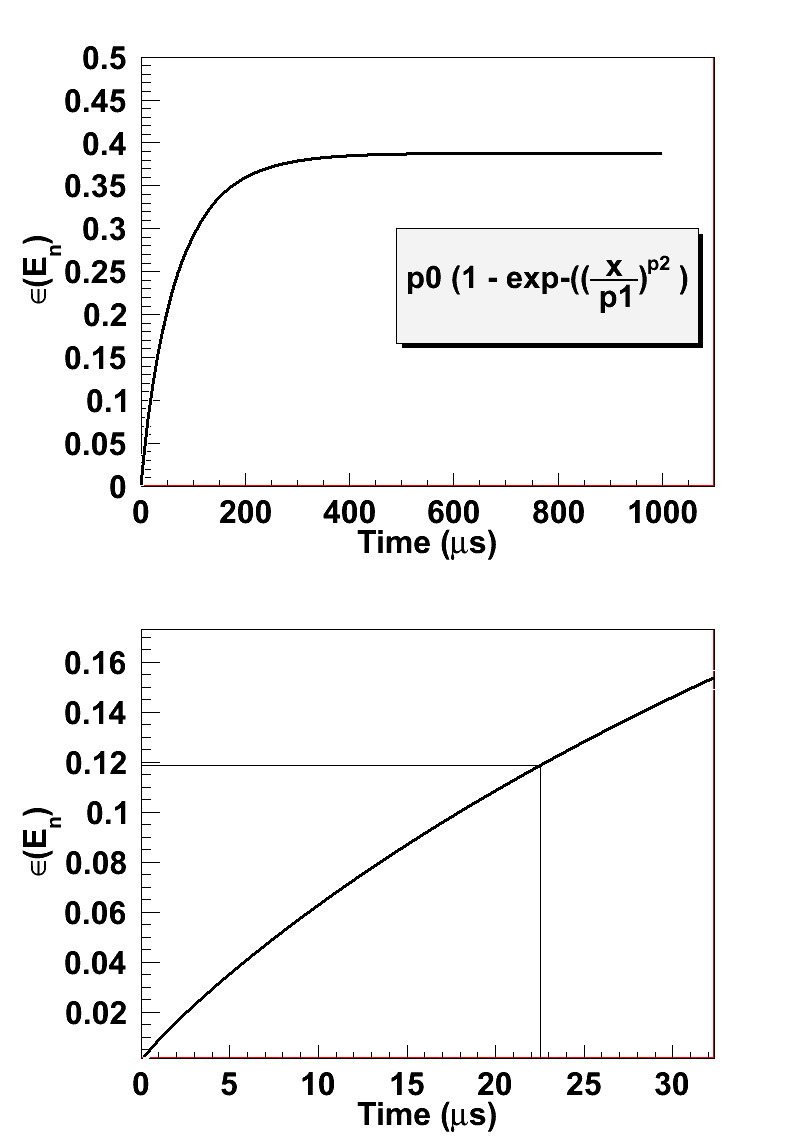
(Bottom) The same plot expanded to show t 35 s. The vertical and horizontal lines identify the experimental window and expected efficiency.
The simulated total efficiency for neutrons collected between 0 and 22.5 s is 11.9% in agreement with experiment. It is noteworthy, that simulations predict a relatively long time (nearly 500 s) before a maximum efficiency of 38.8% detection is realized for 2.26 MeV neutrons from the 2H()3He reaction.
IV.1.3 7Li()7Be and 2H()1H
Simulations for the 7Li()7Be and 2H()1H reactions were carried out in the following way. First, the location of the source was set to match experimental conditions. For a single simulation the source emitted monoenergetic neutrons only between angles and + with constant emission over . After stepping through all of space, the process was repeated for a new neutron energy.
Ultimately, a three-dimensional plot was constructed with neutron energy on the x-axis, emission angle on the y-axis and detection efficiency on the z-axis (see Sect. V). After choosing an incident particle energy, and inputing expected angular distributions for the neutrons in the center-of-mass (CoM) frame, a second Monte Carlo process produced an average efficiency for the given source conditions. This process was repeated for several incident particle energies, and the result was a plot of simulated efficiency as a function of incident particle energy.

For the 7Li()7Be reaction, simulations reproduce very well the shapes of (Ep) for both the inner and outer detector rings (see Fig. 11). Absolute detection efficiency for the outer ring of detectors is in good agreement with experiment. A 13% systematic offset in absolute efficiency is observed for the inner ring of detectors. Known systematic effects can account for a maximum difference of 6.6%. The difficulty with this discrepancy is that it appears to be of a systematic nature, while only affecting the inner ring of the INVS counter. A missing thermal neutron sink in the model may explain the difference. An underestimated amount of aluminum in the modeled beam pipe could have inadequately converted neutrons to -rays, leaving an excess of thermal neutrons in the region of the inner ring of the INVS counter.

For the 2H()1H experiment plots of (En) for the inner ring, the outer ring, and the total show the data trends in good agreement with trends predicted by the simulation. The data for total detection efficiency are systematically lower than simulation by about 5.9%. Data for the inner and outer rings were systematically lower by 6.7% and 3.7% respectively. These data provide a benchmark calibration for this INVS counter with regards to its use in future () experiments.
In the INVS counter a single detected neutron provides no information about the energy of the neutron. However, the average neutron energy from an ensemble of detected neutrons may be gleaned from the observed proportionality
| (9) |
which is easily inverted. The ability to distinguish the signature I/O ratio for En from the I/O ratio for E En becomes more difficult as En increases (see Fig. 10).
The method described above for evaluating detector efficiency is valid irrespective of the target used. A deuteron target was chosen because of the precision with which the () cross section is known for this nucleus. Evaluating the efficiency this way established the energy-dependent response of the detector for future users under certain conditions. The efficiencies determined here are valid for any () reaction measurement that satisfies the following conditions: (a) the target location was fixed to match simulation; (b) the average energy of the emitted neutrons is known; and (c) the CoM angular distribution is known. If backgrounds are low, and the neutron energies are 2.0 MeV, condition (b) may be relaxed, because the neutron energy information may be obtained from the I/O ratio. For neutron energies 500 keV, condition (c) may also be relaxed because the response of the detector is nearly constant with respect to angle of emission.
V Summary and Conclusions:
The goal of this work was to characterize precisely the response of the highly efficient INVS counter using multiple neutron sources with a focus on neutrons of energy 1.0 MeV. The attention to low energy neutrons was motivated by a need to generate high quality () cross-section data. Experiments were carried out and then simulated in detail for comparison. In all simulations, special attention was given to assure accurate reproduction of experimental conditions.
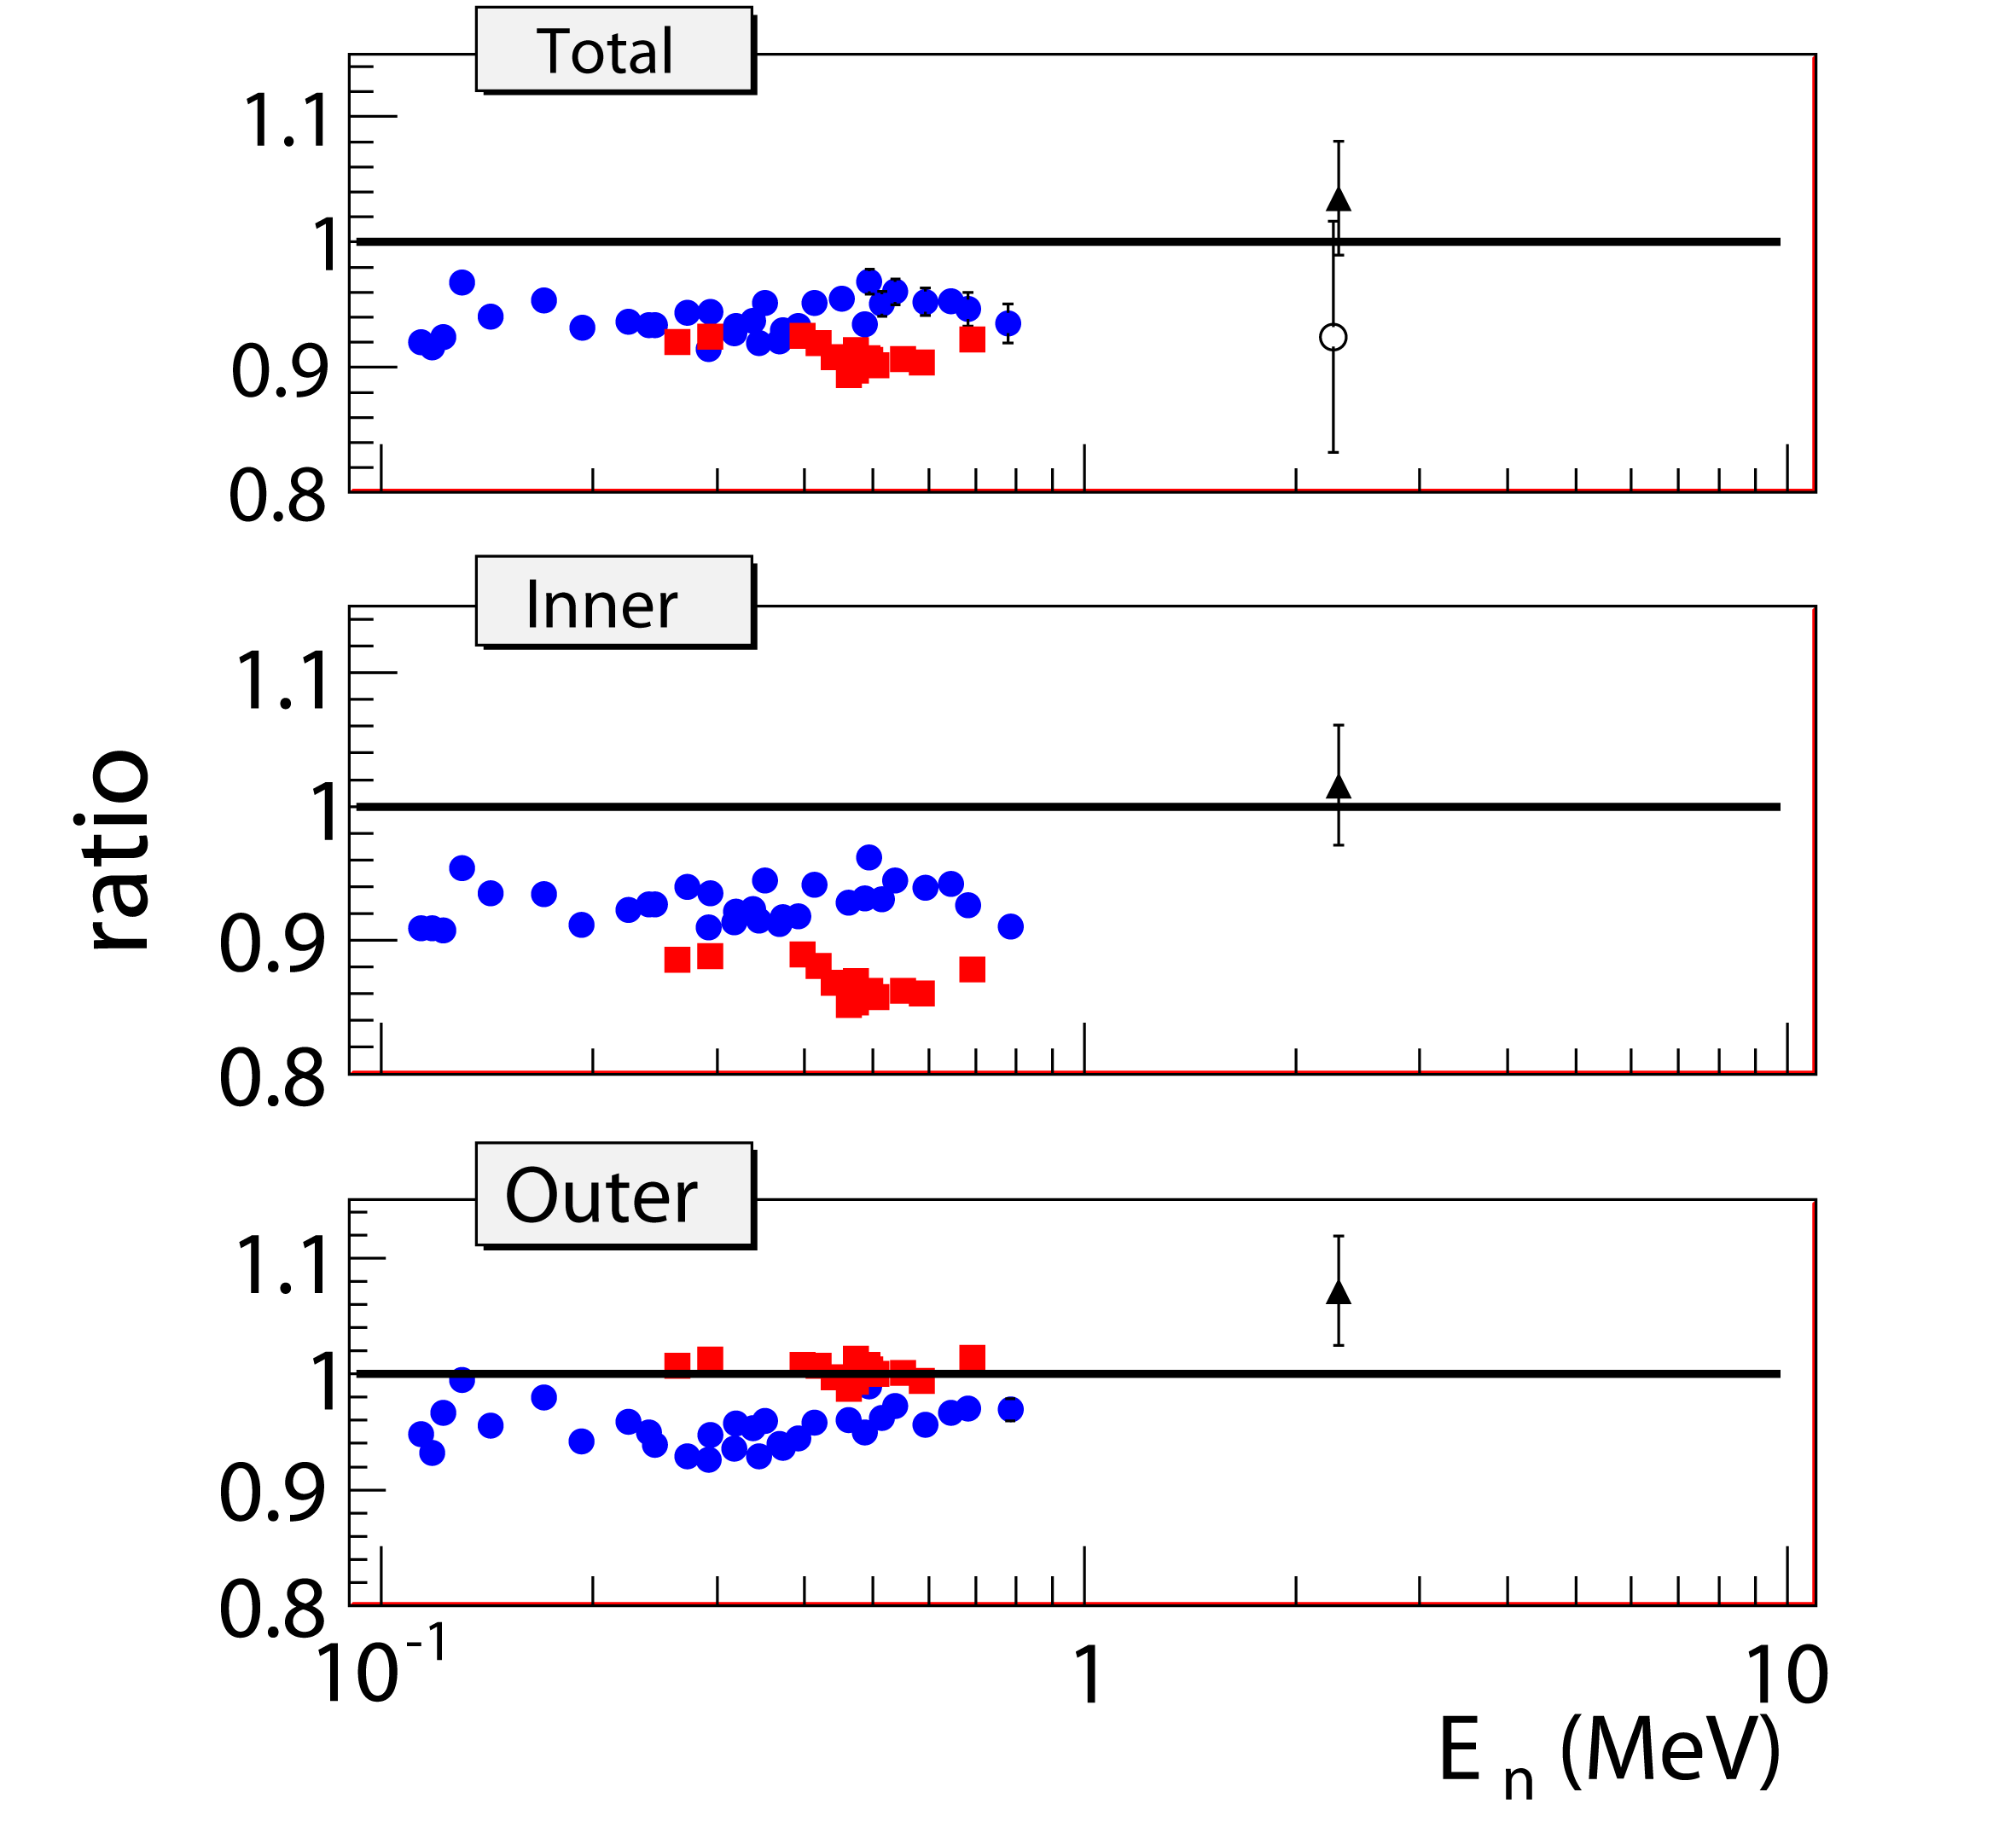
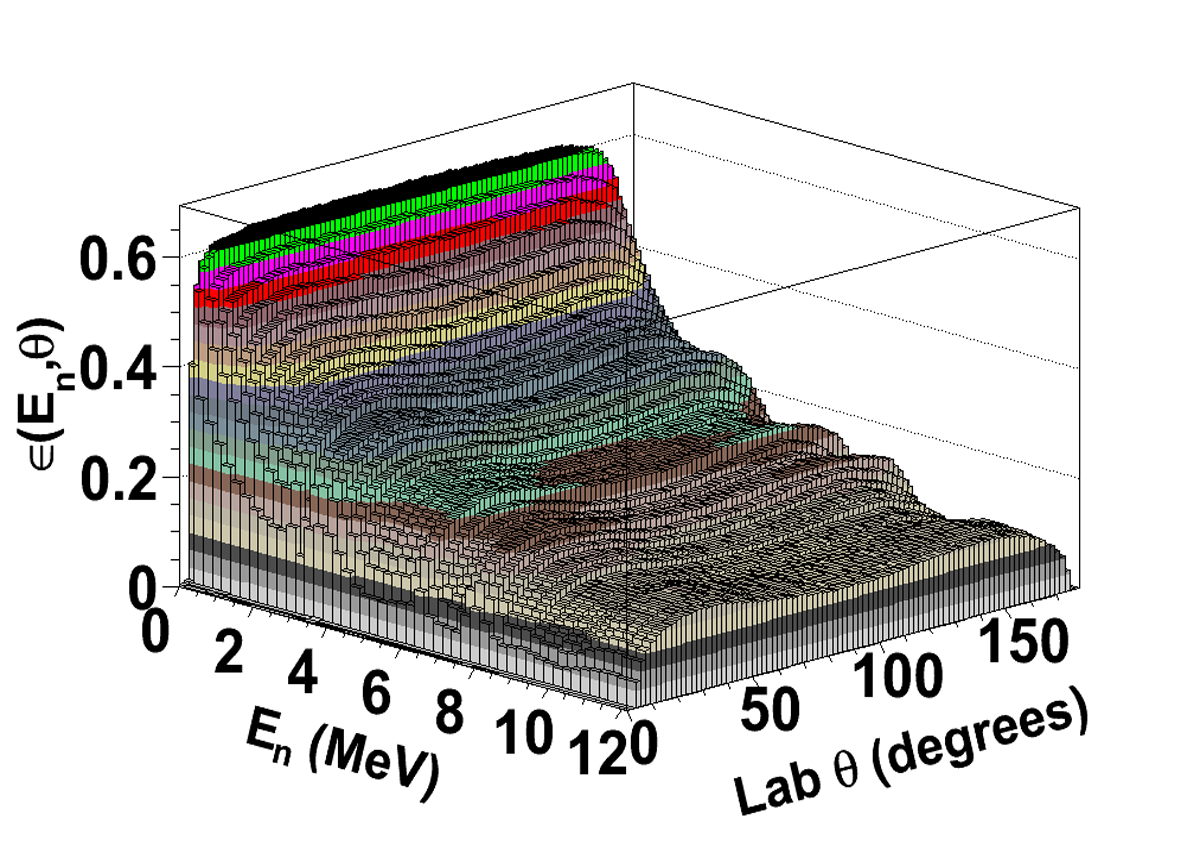
Figure 12 shows the ratio of experimentally determined efficiency to simulated efficiency vs. average neutron energy for each experiment. Ratios have been determined for the inner () and outer() rings separately, as well as for the total ().
Neutrons from the 2H()1H reaction were emitted from within 4 cm from the longitudinal center of the detector with a sin2() distribution in the CoM frame which is hardly changed when converted to the lab frame because of the relatively small momentum of the incident -ray. The arrangement of moderating materials was approximatly symmetric. Under these conditions, simulations reproduce measurements to within a normalization of -6.7% (), -3.7% (), and -5.9% (). These differences are likely the result of effective threshold settings on the signals from the detector tubes. This feature of the effective threshold settings was not included in the simulations.
Neutrons from the 7Li()7Be reaction were emitted far from the longitudinal center of the detector with a Legendre polynomial series distribution in the CoM frame which is significantly changed when converted to the lab frame because of the relatively large momentum of the incident proton. The arrangement of moderating materials was asymmetric - biased to achieve higher detection efficiency for neutrons emitted near close to zero. Under these conditions, absolute detection in is reproduced very well by simulations; however, absolute detection in is systematically 13% smaller than predicted by simulations, resulting in a nearly 10% systematic difference in .
The difference in the level of agreement between simulations and experiment for and for the 7Li()7Be reaction is intriguing. The most likely explanation is that the amount of aluminum in the intervening beam pipe was underestimated in the simulations which caused an excess of thermal neutrons in the vicinity of .
The systematic differences between experiment and simulation for , and for the 2H()1H measurement confirmed the need for a well known, tunable, monoenergetic neutron source. Reliance on simulations alone would have introduced systematic errors in future () measurements on the order of 6%. Using the cross-section of Ref. Schiavilla (2005) as a 1% standard provided tunable monoenergetic neutron sources with fluxes known to 3%. The method for simulating absolute detection efficiencies for the 2H()1H reaction was not significantly influenced by the choice of target material. Thus, using the same techniques, other () cross-sections may be measured with very high accuracy.
For the purpose of planning future () experiments at HIS which seek to use the INVS counter, simulations have been prepared for three likely experimental setups. An analysis program takes as input the geometry, the desired () reaction, the incident particle energy, and the CoM angular distribution of the outgoing neutrons and gives as output the expected detection efficiency and I/O ratio. The capabilities offered by the combination of the HIS facility and this precisely characterized INVS counter make possible absolute photonuclear cross-section measurements with high precision.
Acknowledgements.
Work supported in part by USDOE Office of Nuclear Physics Grants DE-FG02-97ER41041 and DE-FG02-97ER41033. I would like to acknowledge the staff of the UNC Chapel Hill and TUNL machine shops, and experimental collaborators A. Adekola, G. Rusev, S. Stave, M.W. Ahmed and Y. Wu for their help in completing these experiments.References
- Sprinkle Jr. et al. (1993) J. K. Sprinkle Jr., H. O. Menlove, M. C. Miller, and P. A. Russo, Los Alamos National Lab Report No. LA-12496-MS, 11 (1993).
- Weller et al. (2009) H. R. Weller, M. W. Ahmed, H. Gao, W. Tornow, Y. K. Wu, M. Gai, and R. Miskimen, Prog. Part. Nucl. Phys., 62, 257 (2009).
- Thompson (2009) A. K. Thompson, “Source activity,” (2009), private communication.
- Martin et al. (1999) R. C. Martin, J. B. Knauer, and P. A. Balo, Oak Ridge National Laboratory Report (1999).
- Smith et al. (1957) A. B. Smith, P. R. Fields, and J. H. Roberts, Phys. Rev., 108, 411 (1957).
- Burke et al. (1974) C. A. Burke, M. T. Lunnon, and H. W. Lefevre, Phys. Rev. C, 10, 1299 (1974).
- Burke (1972) C. A. Burke, Ph.D. thesis, University of Oregon (1972).
- Gibbons and Macklin (1959) J. H. Gibbons and R. L. Macklin, Phys. Rev., 114, 571 (1959).
- Sekharan et al. (1976) K. K. Sekharan, H. Laumer, B. D. Kern, and F. Gabbard, Nuc. Instr. and Meth., 133, 253 (1976).
- Litvinenko et al. (1997) V. N. Litvinenko et al., Phys. Rev. Lett., 78, 4569 (1997).
- Sun et al. (2009) C. Sun, Y. Wu, G. Rusev, and A. Tonchev, Nuc. Instr. Meth. Phys A, 605, 312 (2009).
- Sun (2009) C. Sun, Ph.D. thesis, Duke University (2009).
- Schiavilla (2005) R. Schiavilla, Phys. Rev. C, 72, 034001 (2005).
- Birenbaum et al. (1985) Y. Birenbaum, S. Kahane, and R. Moreh, Phys. Rev. C, 32, 1825 (1985).
- Moreh et al. (1989) R. Moreh, T. J. Kennett, and W. V. Prestwich, Phys. Rev. C, 39, 1247 (1989).
- De Graeve et al. (1992) A. De Graeve, R. Van de Vyver, A. Zieger, C. Van den Abeele, L. Van Hoorebeke, D. Ryckbosch, H. Ferdinande, F. De Smet, B. Ziegler, P. Wilhelm, and H. Arenhövel, Phys. Rev. C, 45, 860 (1992).
- Hara et al. (2003) K. Y. Hara, H. Utsunomiya, S. Goko, H. Akimune, T. Yamagata, M. Ohta, H. Toyokawa, K. Kudo, A. Uritani, Y. Shibata, Y.-W. Lui, and H. Ohgaki, Phys. Rev. D, 68, 072001 (2003).
- Hubbell and Seltzer (1989) J. H. Hubbell and S. M. Seltzer, NIST Standard Reference Database 126 (1989).
- Chadwick et al. (2006) M. Chadwick et al., Nuclear Data Sheets, 107, 2931 (2006), evaluated Nuclear Data File ENDF/B-VII.0.
- mcn (2007) mcnpx User’s Manual (2007).