A Spitzer IRS Study of Debris Disks around Planet-Host Stars
Abstract
Since giant planets scatter planetesimals within a few tidal radii of their orbits, the locations of existing planetesimal belts indicate regions where giant planet formation failed in bygone protostellar disks. Infrared observations of circumstellar dust produced by colliding planetesimals are therefore powerful probes of the formation histories of known planets. Here we present new Spitzer IRS spectrophotometry of 111 Solar-type stars, including 105 planet hosts. Our observations reveal 11 debris disks, including two previously undetected debris disks orbiting HD 108874 and HD 130322. Combining our 32 m spectrophotometry with previously published MIPS photometry, we find that the majority of debris disks around solar-type stars have temperatures in the range K.
Assuming a dust temperature K, which is representative of the nine debris disks detected by both IRS and MIPS, debris rings surrounding Sunlike stars orbit between 15 and 240 AU depending on the mean particle size. Our observations imply that the planets detected by radial-velocity searches formed within 240 AU of their parent stars. If any of the debris disks studied here have mostly large, blackbody emitting grains, their companion giant planets must have formed in a narrow region between the ice line and 15 AU.
Subject headings:
stars: circumstellar matter — infrared: stars — planets and satellites: formation — Kuiper Belt — stars: planetary systems1. Introduction
Sometimes the giant planets that failed to form reveal as much about the birth environments of other Solar Systems as the giant planets we actually find. Our objective is to characterize circumstellar dust produced by colliding planetesimals orbiting planet hosts and use the orbital radii of such planetesimals to constrain the locations where the known giant planets may have formed. Radial-velocity searches do not yet have the time baseline to detect giant planets more than AU from their host stars. Nevertheless, we expect that giant planets do not reside within observed debris disks—which typically orbit at 10 AU or more—because giant planets scatter planetesimals within a few Roche radii of their orbits (e.g. Bryden et al. [2000], Thommes et al. [2003], Ida & Lin [2004], Goldreich et al. [2004]). As long as planetesimal belts don’t migrate on a large scale, grain temperature measurements that constrain the location of circumstellar dust highlight the regions in long-gone protostellar disks where giant planet formation didn’t succeed.
The “Vega Phenomenon”—an excess of infrared emission caused by circumstellar dust—was first observed by Aumann et al. (1984) using the Infrared Astronomical Satellite. Since then, observations by the Spitzer Space Telescope have revealed the temperatures and locations of scores of extrasolar Kuiper Belts (e.g. Chen et al. [2006], Hillenbrand et al. [2008]). Here we combine new Spitzer IRS spectrophotometry of planet hosts with previously published MIPS data, allowing us to constrain grain temperatures and planetesimal belt locations and exclude regions inhabited by circumstellar debris from the possible giant planet formation zone.
Massive planets with small orbital radii almost certainly formed at larger radii, where they had access to abundant solid material (Bodenheimer et al. 2000), and migrated inwards through either dynamical interactions with massive gas disks (Lin et al. 1996) or Kozai cycles triggered by a companion (Libert & Tsiganis 2009). Migration will disrupt any planetesimal belt in the giant planet’s path, increase the collision rate of planetesimals, and accelerate the evolution of the planetesimal belt to reduce the debris production at older ages. Indeed, migration of the gas-giant planets in our own Solar System and the subsequent disruption of the Kuiper Belt is one possible explanation for the Late Heavy Bombardment that occurred in the inner solar system 3.9 Gyr ago (Gomes et al. 2005). Raymond et al. (2006) found that if migration occurs quickly and the planet settles at an orbital radius AU, the planetesimal disk can regenerate to form terrestrial planets, and consequently may form a long-lived debris disk. However, disk regeneration is suppressed if the migration stops at a radius AU and the debris may dissipate rapidly.
The evidence for brighter debris disks around planet hosts than non-hosts has at times been intriguing (e.g. Beichman et al. 2005, Kóspál et al. 2009), but most studies show no statistically significant differences between the circumstellar dust populations of planet hosts and other stars (Moro-Martín et al. [2007], Bryden et al. [2009]). Despite a few compelling exceptions—for example, the existence and location of Fomalhaut b was predicted through analysis of the shape and surface brightness profile of Fomalhaut’s debris disk (Quillen [2006], Kalas et al. [2008])—statistical analysis indicates that known giant planets tend to be dynamically decoupled from any planetesimal belts orbiting their host stars.
Since 60% of the exoplanets discovered at the time of this writing have semimajor axes AU111Based on histograms provided by the Exoplanet Encyclopedia, http://exoplanet.eu, we expect that few planetesimal belts in the path of migrating planets were able to regenerate according to the Raymond et al. (2006) scenario. The simplest hypothesis, then, is that migratory planets formed nearer their host stars than the dust-producing planetesimal belts generally studied with IRAS and Spitzer. Migrating inward, they left the planetesimal belts intact. Since giant planet formation efficiency decreases with distance from the star (Safronov [1969], Pollack et al. [1996]), we expect that today’s planetesimal belts had too little solid mass to overcome the growth slowdown inherited from their wide orbits. Excepting cases where observations conclusively demonstate that a particular debris disks and giant planet dynamically interact (Quillen [2006], Lovis et al. [2006], Kalas et al. [2008]), the ensemble of debris disks orbiting known radial-velocity planet hosts provides an upper limit to the semi-major axis of the locations where most of the known planets could have formed.
In §2 we describe our sample of target stars. In §3 and §4, we detail our procedure for reducing Spitzer IRS data and detecting infrared excesses. In §5 we discuss our debris disk detections. We focus specifically on the luminosity and location of the dust in §6. Finally, we list our conclusions in §7.
2. Sample Selection and Observations
The main sample of extrasolar planetary systems was selected for Spitzer program 40096 (PI: J. Carpenter) from the compilation reported in the Extrasolar Planets Encyclopaedia (http://exoplanet.eu) as of February 16, 2007. At the time, there were 182 known extrasolar systems containing 212 planets. From this parent sample, we selected extrasolar planetary systems that met the following criteria:
-
1.
The planets were discovered by radial velocity techniques, or from transiting surveys and later confirmed by radial velocity measurements. We excluded planets identified from microlensing surveys, pulsar timing experiments, and direct imaging of star forming regions.
-
2.
Target stars had distances available from Hipparcos parallaxes.
-
3.
Targets had either main-sequence or sub-dwarf luminosity class to focus the survey of solar-analogs.
-
4.
Targets were bright enough to reach a signal to noise ratio of 20 in a spectrophotometric bandpass between 30-34 m within 20 AOR cycles of 120 seconds.
These criteria narrowed the list to 143 planet hosts, all within a distance of 100 pc, containing 171 planets. Stellar age estimates for the sample are available from the detailed spectroscopic work by Valenti & Fischer (2005), and/or Ca II H and K stellar activity measurements (Saffe et al. [2005], Wright et al. [2004]). We cross-correlated this list of stars with the Reserve Object Catalog using a arcminute search area and identified 34 extrasolar planet hosts with previous IRS observations, leaving 109 stars for our IRS observing program. We excluded seven stars observed in program 40096 from our final sample because of poor sky subtraction or stray light from nearby sources.
After the observations were complete, the existence of the planet orbiting HD 188753 (Konacki 2005) was challenged by Eggenberger et al. (2007). Here we present our observations of HD 188753 but classify it as a non-host. Information about our sample, including the number of planets orbiting each star and the 70 m dust luminosity, is given in Table 1. Effective temperatures were taken from the following sources in order of preference: (1) Valenti & Fischer (2005, abbreviated VF05 in Table 1), (2) Santos et al. (2004b), and (3) the planet discovery paper.
We also present observations of nine solar-type stars with previously unpublished data from other IRS programs. From IRS program 41 (PI: G. Rieke), we included the planet hosts HD 50554, HD 52265, HD 117176 (70 Vir), and HD 134987, bringing the total number of planet hosts in our sample to 105. Finally, we included the stars without planets HD 166, HD 33262 and HD 33636 from program 41, and HD 105211 and HD 219482 from program 2343 (PI: C. Beichman). Our final sample includes 111 stars, six of which have no detected planets.
Of the stars in our sample, 109 are FGK dwarfs and two, GJ 876 and GJ 581, are M dwarfs. All but three of the stars have 70 m photometry either from the MIPS component of our observing campaign, described by Bryden et al. (2009), or from previous surveys. All but six of our targets are older than 1 Gyr, which reduces any spurious statistical effects that might result from the well-know correlation between debris disk brightness and stellar age (Su et al. 2006). Thus, our discovered debris disks contain information about the planetesimal populations of mature planetary systems such as our own.
The Infrared Spectrograph (IRS) aboard the Spitzer Space Telescope observed the 102 targets from program 40096 between July 2007 and January 2008 (IRS campaigns 42-47). For each star, we recorded five six-second exposures in the SL1 module to characterize the stellar photosphere between 7 and 14 m. All stars received a minimum exposure time of 30 seconds (five six-second cycles) in the LL2 and LL1 modules, with extra cycles and/or ramp time added as needed for faint targets to detect the photosphere at the 2-3 level in each resolution element. We imposed a maximum integration time of 120 sec with 20 cycles to keep the AORs to a reasonable length. We also required a minimum of five cycles to achieve the redundancy needed to identify cosmic rays and bad pixels, and to compute uncertainties based on repeatability of the spectral extraction. The IRS follow-up observations of 70 m excesses from IRS programs 41 and 2343 went deeper in the LL1 module, reaching per resolution element between 30 and 34 m.
3. Data Analysis
Bad pixels were identified using the campaign-specific rogue pixel masks provided by the Spitzer Science Center. We used the IRSCLEAN package to remove bad pixels from the Spitzer pipeline’s basic calibrated data. Sky subtraction and spectral extraction were performed with the SMART data reduction package developed by the IRS instrument team at Cornell (Higdon et al. 2004). Each star was observed at two positions along the slit, Nod 1 and Nod 2. For each nod, we constructed sky and stray-light correction frames by taking the median of all exposures performed in the same module but opposite nod.
To make the end-to-end spectrum, we clipped unreliable data points from the beginning and end of each order. We retained SL1 data from 7–14m, LL2 data from 14–20m, and LL1 data from 20–35m. We imposed a requirement that the final spectrum be continuous over order crossings to correct for the different slit losses in each order. A smooth spectrum was produced by correcting the LL2 spectrum with a constant scaling factor to match the SL1 flux in the overlap region at 14m, then scaling LL1 fluxes to match LL2 in the 20m overlap region.
The final step in our data reduction process was to create a model of the star’s photosphere. For each FGK star, we used the Atlas9 grid of model atmospheres for stars with solar abundance ratios (Kurucz 1992). Following the recommendations of Bertone et al. (2004), we used the NextGen model atmospheres (Hauschildt et al. 1999) for photospheres of the M Dwarfs GJ 876 and GJ 3021, which have effective temperatures less than 4000 K.
Photosphere models were fitted using Hipparcos parallaxes and Hipparcos/Tycho and magnitudes (Perryman et al. 1997; Høg et al. 2000) transformed to the Johnson photometric system, 2MASS , and magnitudes (Cutri et al. 2003), and the measured temperature of each star from planet-search spectra. Sources of measurements are listed in Table 1. When available, and photometry from Bessell (1990) with assumed mag uncertainties were added to further constrain the photosphere models. Each model photosphere was extrapolated to mid-infrared wavelengths using a simple blackbody extension to the optical and near-infrared fit.
In the next section, we describe our method for detecting non-photospheric emission, the signature of circumstellar dust.
4. Detecting Excess Emission
To construct the infrared excess spectra, we subtracted the model photosphere from the IRS spectrum of each star and calculated the fractional flux in each resolution element relative to the photosphere:
| (1) |
Spitzer MIPS 24 m observations of a sample of FGK dwarfs with median age 4 Gyr have demonstrated that only % of main-sequence Solar-type stars have dust with luminosity at 24 m (Bryden et al. 2006), which originates from asteroid-belt analogs at 3-4 AU from Sunlike host stars. The fractional excess spectrum of a solar-type star with a typical debris disk should stay near zero until between 25 and 30 m, at which point the dust gives it a rising slope. With the low likelihood of detecting short-wavelength excesses in mind, our first step in calculating the fractional excess spectrum was to assume the first 10 resolution elements (20.93-22.45 m) of our clipped LL1 spectra defined the photosphere, such that
| (2) |
where is the frequency interval between 20.93 and 22.45 m.
In the previous section we described using the order overlap regions to correct for differential slit losses, a procedure that produces a smooth but not flux-calibrated spectrum. In order to perform spectrophotometry of our sources it is essential that we avoid the unreliable parts of our spectra—the well-known SL1 order curvature and the LL1 24 m flux deficit111See a description of these problems at http://ssc.spitzer.caltech.edu/irs/features.. Pinning the short-wavelength end of LL1 to the photosphere model defines a flux calibration using an instrumentally reliable part of our spectra that should contain only photospheric emission. In two cases where we did observe a rising fractional excess slope shortward of the 20.93 m LL1 boundary (HD 166 and HD 219482), we used the first 10 resolution elements of LL2 (14.24-15.00 m) to define the photosphere.
Following the approach of Beichman et al. (2006b) and Lawler et al. (2009), we defined a filter spanning 30-34 m which is primarily sensitive to dust with K. Such dust would be located between 8 and 10 AU from a Sunlike star assuming blackbody grains. To search for debris disks, we calculate the frequency-weighted mean excess relative to the photosphere in the 30-34 m filter. The excess measurement error based on uncertainties propagated through the Spitzer pipeline and photospheric fitting error is
| (3) |
In equation 3, is the uncertainty in each resolution element from the Spitzer pipeline propagated through the SMART data reduction, is the frequency of each resolution element, and is the frequency difference between 30 and 34 m. The star flux in equation 3 is simply the frequency-weighted average flux of the photosphere model between 30 and 34 m:
| (4) |
Following Beichman et al. (2006b), we impose a minimum fractional photosphere fitting uncertainty of 2%, which gives the component of the variance. In writing equation 3 we assume that the observational errors in each resolution element are independent.
If the errors reported by the Spitzer pipeline/SMART and the 2% photosphere-fitting uncertainty account for all of the dispersion in our infrared excess measurements, we expect only one source to have more than a flux deficit. However, a closer look at the distribution of excesses in our sample reveals seven stars with 2-3 flux deficits between 30 and 34 m, indicating that there is an extra source of error in our infrared excess measurements. Before conclusively identifying any debris disks, we follow Beichman et al. (2006b) and require that they have a significant infrared excess relative to the dispersion of the entire sample, not just internal measurement and fitting errors. Accordingly, we rank each debris disk candidate by the significance of its infrared excess against the internal error . With such a ranking system we can identify low-luminosity debris disks in high signal-to-noise observations while rejecting debris disk candidates that appear to be bright but also have large measurement errors.
We construct a histogram in the variable
| (5) |
where is the number of standard deviations from a perfect photosphere in the 30-34 m filter and is the frequency-weighted average observed flux. We can calculate by replacing the predicted photospheric flux in equation 4 with the observed flux . Figure 1 shows the resulting histogram along with its best-fit Gaussian function. Since a Gaussian function is an excellent fit to the histogram in Figure 1, the extra error source is random rather than systematic. From the standard deviation of our model Gaussian, we find that the dispersion of across our sample is . Accordingly, we increase our spectrophotometric error estimates by a factor of 1.93 to select only debris disks with or greater excesses. The cross-hatching in Figure 1 demarcates the part of the distribution where the debris disks lie. With the aforementioned detection procedure, we find statistically significant 32 m excesses in the spectra of 11 stars. In the next section we discuss the spectra of our debris disks.

5. Debris Disks
Table 2 shows the results of our 30-34 m spectrophotometry. The HD numbers of debris disks appear in bold in the table. We detect two new debris disks orbiting the planet hosts HD 108874 and HD 130322. We also measure 30-34 m emission from nine other debris disks previously detected at 70 m, four of which orbit planet hosts. The table also gives fractional dust fluxes at 30-34 m and total luminosities for each star in the sample. Assuming the dust is a single-temperature blackbody, its luminosity is
| (6) |
where . When the dust temperature is not known, one can use equation 6 to calculate the minimum dust luminosity, assuming the emission peak of the dust is centered in the spectrophotometric filter. For peak dust luminosity at 32 m, K.
One can calculate the true luminosity ratio by detecting the debris disk at multiple wavelengths. We write equation 6 once each for our 32 m spectrophotometric fluxes and the MIPS 70 m values from the literature and solve the resulting system for and . Note that equation 6 assumes that the dust has a single temperature—debris disks containing a large range of grain sizes or occupying a wide range of distances from the star will have a range of dust temperatures.
Table 2 contains three different types of measurements of : true values, lower limits, and pseudo-upper limits. For stars without any measured infrared excess, we use equation 6 and set to calculate the maximum dust luminosity assuming the excess emission comes from single-temperature dust at 115 K. For cold, faint dust undetected by both MIPS and IRS, the true luminosity may be higher than the maximum value we calculated if the dust emission peaks at very long wavelengths. Lower limits to the dust luminosity arise for debris disks with a detection at only one wavelength and true values come from detections at multiple wavelengths (see §6).
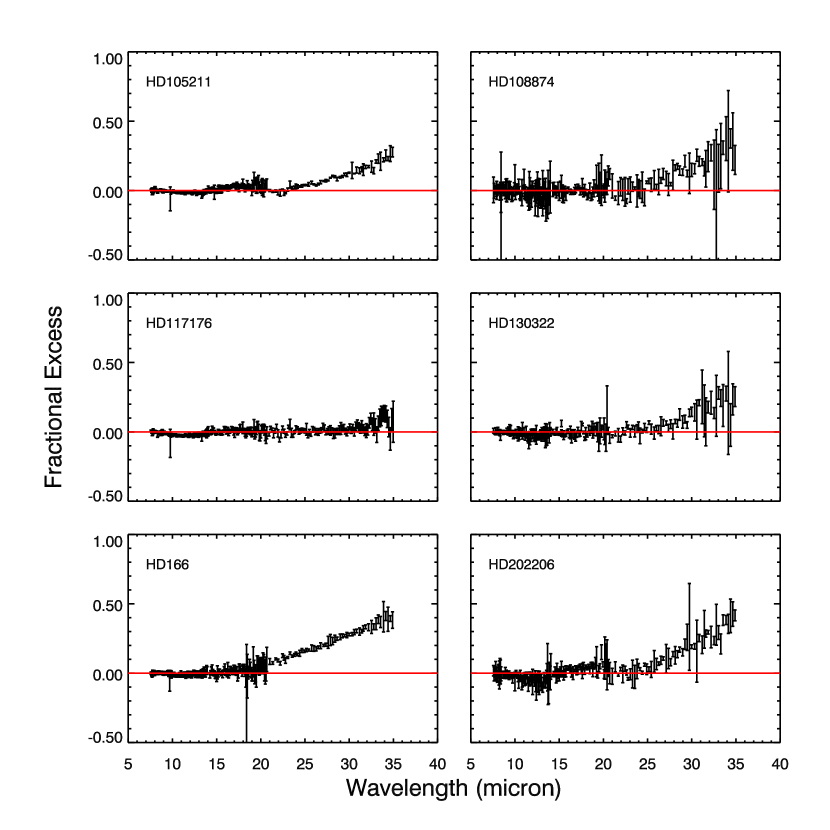
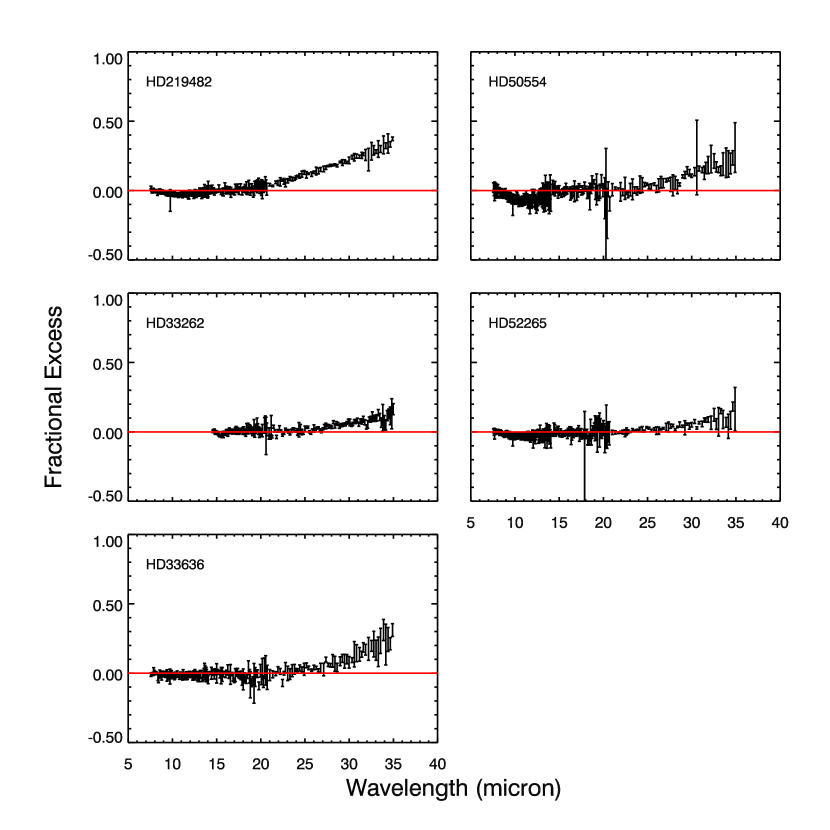
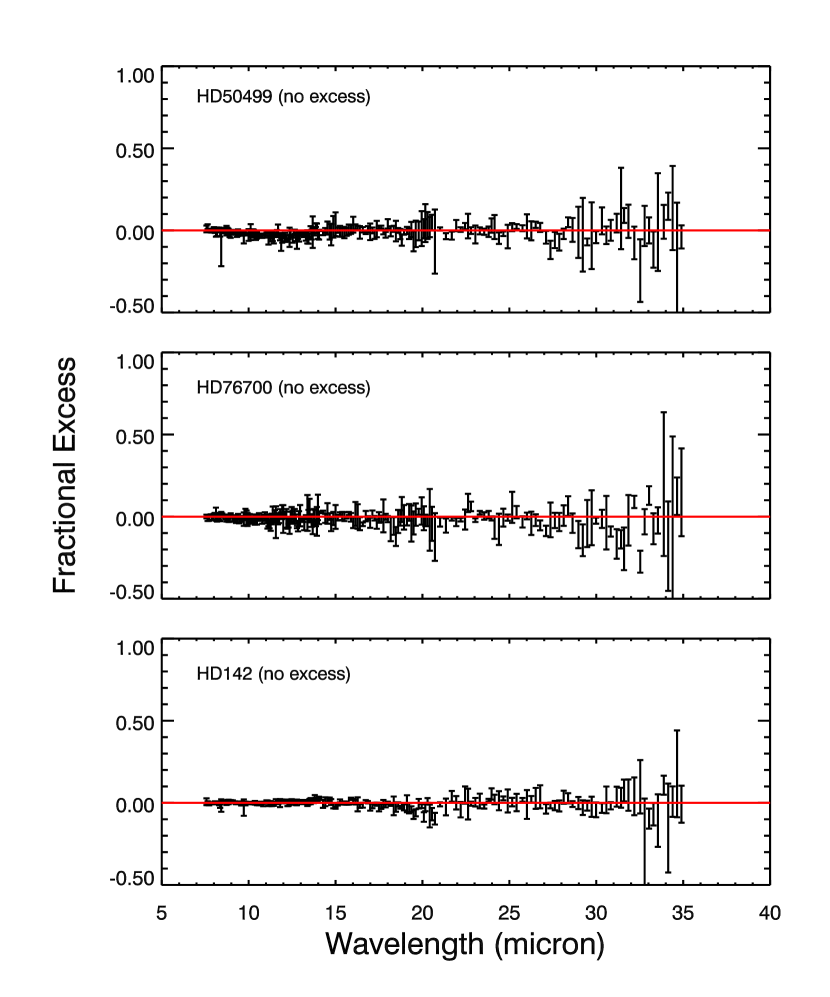
Figures 2 and 3 show the spectra of the debris disks in our sample. Each debris disk has little or no fractional infrared excess in the IRS SL1 and LL2 modules but a positive fractional excess slope in the long wavelengths of the LL1 module. Two of the debris disks, HD 219482 and HD 166, show strong evidence of 24 m emission. For comparison, we also show the spectra of three stars without any significant infrared excess in Figure 4. These spectra tightly hug the line of zero fractional excess at all wavelengths and do not show a positive fractional excess slope in LL1. Note that the spectrum of HD 50499 shows the SL1 order curvature between 10 and 13 m. As explained in §4, we chose the first ten unclipped resolution elements of LL1 (20.93–22.45 m) to define our photosphere in order to avoid this order droop.
Our overall detection rate of debris disks is 11%, but the non-uniform sensitivity and the inclusion of 70 m follow-up observations in our survey bias this statistic. Because of the non-uniformity of our observations, we do not attempt to calculate an error bar for our detection rate. However, our results agree with the IRS study of Beichman et al. (2006b), who found 32 m excesses around % of stars in a sample that also included follow-ups of 70 m excesses. Similarly, Lawler et al. (2009) report a 32 m excess detection rate of %.
The most intrinsically luminous debris disk in our sample is that orbiting the planet host HD 202206, which has . For comparison, the well-studied debris disks orbiting the planet hosts HD 69830 and HD 82943 have luminosity ratios of and respectively (Beichman et al. 2005). All but two of the 111 stars in our sample have a minimum detectability of ; thus only % of the sample has a fractional dust luminosity brighter than . Our result agrees with the % detection rate for excesses of calculated by Bryden et al. (2006).
6. Dust Temperature and Location
We will now determine the location of the debris for the sample of 11 stars with infrared excesses detected at 32 m. Of our 11 detected debris disks, nine also have excess emission at 70 m (Beichman et al. [2006a], Trilling et al. [2008], Bryden et al. [2009], Kóspál et al. [2009]). Table 2 lists the blackbody temperature of each debris disk detected at multiple wavelengths. Beichman et al. (2006a) detected HD 219482’s dust at both 24 and 70 m and calculated K for large grains, in excellent agreement with our value of K. Our K temperature for the dust orbiting HD 166 does not agree with Tanner et al. (2009), who calculated a lower limit of 104 K using the previously published 70 m detection (Trilling et al. 2008) and the 160 m upper limit. However, grain temperature varies with size roughly as
| (7) |
where is the grain radius and is the semimajor axis of the debris orbit (Krugel 2003). Therefore each photometric band is most sensitive to a certain combination of grain size and distance from the star. Different pairs of photometric bands may, therefore, lead to different grain temperature distance estimates (Carpenter et al. 2009).
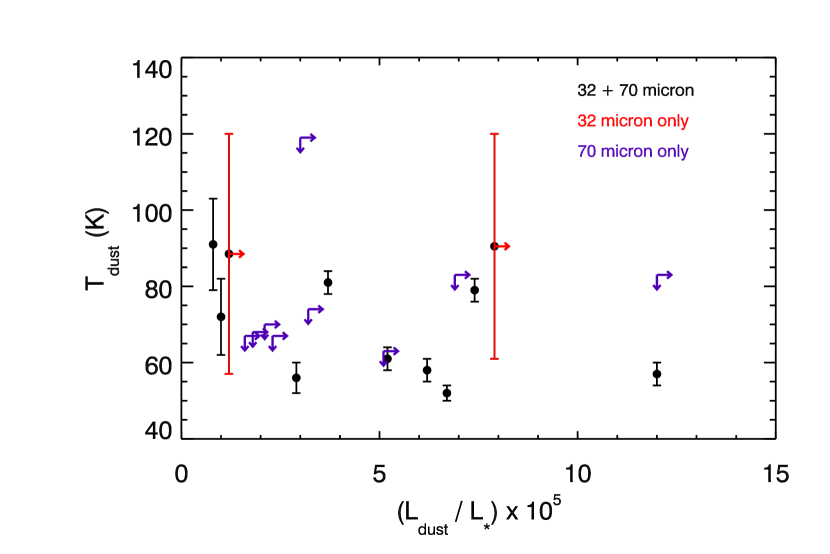
By combining our IRS observations with previous MIPS data, we have obtained temperature estimates for 15 planet hosts and five non-host stars. Figure 5 shows luminosity ratio vs. dust temperature for all debris disks in our sample, whether detected in this study or previous 70 m MIPS work. The warmest temperature of a debris disk detected at multiple wavelengths is 91 K for the dust around HD 33262. Only four stars may possibly host dust warmer than 100 K—HD 142, HD 33262, HD 108874 and HD 130322 have temperature upper limits of 117 K, 103 K, 120 K and 120 K respectively. Our finding that debris disks around solar-type stars are primarily cold agrees with Hillenbrand et al. (2008), who find dust temperatures K for the 25 debris disks in the FEPS Spitzer Legacy Science Program. 70 m debris systems with temperature upper limits only may be true Kuiper Belt analogs, as most have K.
With the exception of three of the upper limits quoted above, all dust temperatures are below the water ice sublimation temperature of K in a zero-pressure medium. However, in optically thin disks photodesorption is the dominant volatile removal mechanism and is efficient well beyond the thermal ice line (Grigorieva et al. 2007). Indeed, the survival timescale for ice deposited in monolayers on the surfaces of small grains in an optically thin disk is of order a few minutes (Chen et al. 2005). Assuming, accordingly, that (a) the dust in each system is rocky or carbonaceous with an albedo near zero and (b) most grains are larger than 10 m and so have absorption coefficients for visible and near-IR irradiation, we can find the distance of the dust from its host star in the blackbody approximation, appropriate for large grains:
| (8) |
where is the star radius. For our solar-type stars with K, we find . Large grains in the debris disks we have discovered at 32 m occupy what would be the region between Saturn and Uranus in our own Solar System.
Smaller grains in the 60–100 K temperature range would reside on larger orbits. We estimate the minimum grain size in our debris disks from the radiation pressure blowout limit (Artymowicz 1988) of
| (9) |
where is the minimum grain size, and are the star luminosity and mass, is the radiation pressure coupling coefficient, and is the internal density of the grains. is a good approximation for Solar-type stars (Krugel 2003). For silicate grains with g cm-3, m. Icy grains with g cm-3 orbiting a Solar-type star have minimum size m. Using equation 7, which applies to grain sizes from approximately 0.03 to 30 m (Kruegel 2003), we find that 70 K silicate grains at the blowout limit orbit AU from Solar-type stars. Low-density icy grains, which would be destroyed quickly by photodesorption, are limited to within AU from their host stars.
In the introduction, we emphasized the lack of any dynamical connection between short-period planets and cold dust—planets detected by radial velocity neither migrated through and destroyed our planetesimal belts, nor dynamically stir them today. Based on the 240 AU maximum orbital radius of grains with temperatures near 70 K, a representative temperature for our detected debris disks, we can restrict the formation locations of the known radial-velocity planets to within AU. In any individual debris system where the bulk of the infrared excess emission comes from large, near-blackbody grains, we can restrict the giant planet formation zone even further, excluding regions beyond 15 AU. In such systems, giant planet formation by core accretion would have been restricted to a narrow belt near the ice line, consistent with the theoretical predictions of Dodson-Robinson et al. (2009b). So far, the orbital radii of the 15 debris disks orbiting planet hosts in this sample provide the only purely observational constraint on where the radial-velocity planets could have formed.
7. Conclusions
We searched a sample of 111 stars, including 105 planet hosts, for 30-34 m excess emission indicating circumstellar dust. Out of 111 stars, 11 showed detectable 32 m spectrophotometric excess. Our debris disk detection rate of 11% is consistent with previous IRS and MIPS 70 m studies of solar-type stars. We have identified two new debris disks orbiting HD 108874 and HD 130322 and calculated dust temperatures and luminosities for the debris disks that had been previously detected at 70 m.
Our IRS data show that the majority of debris systems contain cold dust with K. Here we confirm earlier results from 24 m photometry (Bryden et al. 2006) and IRS spectroscopy (Hillenbrand et al. 2008) demonstrating that excess emission is usually detectable only at wavelengths longer than 30 m. The exception in our survey that has noticeable excess at 20 m, HD 166, is cooler than 80 K. Lower limits to the circumstellar dust temperatures of Solar-type stars come from the MIPS 160 m photometry of Tanner et al. (2009); they find that K for the majority of the debris disks in their sample. While all of our debris disks are colder than the ice sublimation temperature, we expect them to contain mainly bare rock/carbonaceous grains since photoevaporation of ice is extremely efficient in optically thin disks (Grigorieva et al. 2007).
The cold temperatures of most circumstellar dust disks make them excellent candidates for follow-up with the Herschel Space Observatory (Pilbratt et al. 2010). The PACS medium-resolution spectrometer, which covers 55-210 m at a resolution of 1000-4000 and also includes photometric bands, will cover the peak blackbody emission of such disks and provide detailed dust spectral energy distributions. Circumstellar dust SEDs constrain the location of the emitting dust and show whether it occupies a narrow ring—the simplifying assumption used in this work—or a broad, multi-AU band (e.g. Hillenbrand et al. 2008). If any debris disks contain icy dust produced by very recent collisions, PACS may be able to detect H2O gas produced by photoevaporation of the grain mantles.
One question open for debate is why the planetesimal belts surrounding our host stars did not accumulate into giant planets. While planets may shape debris disk edges (Quillen 2006), they will eject planetesimals within a few Roche lobe radii of their orbits (Bryden et al. 2000), so planets and circumstellar dust should not coincide. Planet-formation simulations show that formation of ice giants such as Uranus and Neptune is robust out to AU in disks of several times the minimum-mass solar nebula (Dodson-Robinson et al. [2009a], Dodson-Robinson & Bodenheimer [2010]). Blackbody grains with K reside only 15 AU from solar-type stars.
If most of our debris disk luminosity comes from blackbody grains, a simple explanation for the presence of planetesimal belts in locations that could theoretically host planets is that the majority of protostellar disks do not have enough mass to form ice giants near AU. Gas and ice giant formation by core accretion would then be restricted to a narrow region around the ice line in most disks, as predicted by Dodson-Robinson et al. (2009b). The Sun’s ability to form Uranus and Neptune in the trans-Saturnian region (Dodson-Robinson & Bodenheimer 2010) would be the unusual result of an abnormally massive solar nebula.
If most of the infrared excess emission is produced by small grains near the radiation-pressure blowout limit, we can in general confine the ensemble of radial-velocity planets to formation zones less than 240 AU from host stars. We have therefore presented the first fully observational constraints on the formation locations of the ensemble of radial-velocity planets.
Support for S.D.R.’s work at NASA Exoplanet Science Institute was provided by NASA through the Spitzer Space Telescope Fellowship Program. S.D.R.’s work at University of Texas was supported by the Dean’s Fellowship program of UT’s College of Natural Sciences. J.C. was partially supported by a contract from JPL/Caltech. S.D.R. acknowledges input on IRS data reduction from Joel Green. This research has made use of the following online resources: the SIMBAD database, VizieR catalogue access tool, and Aladin sky atlas operated at CDS, Strasbourg, France; the NASA/IPAC/NExScI Star and Exoplanet Database and the NASA/IPAC Infrared Science Archive, which are operated by the Jet Propulsion Laboratory, California Institute of Technology, under contract with the National Aeronautics and Space Administration; and the Extrasolar Planets Encyclopaedia at http://exoplanet.eu.
References
- Aumann et al. (1984) Aumann, H. H., et al. 1984, ApJ, 278, L23
- Beichman et al. (2005) Beichman, C. A., Bryden, G., Rieke, G. H., Stansberry, J. A., Trilling, D. E., Stapelfeldt, K. R., Werner, M. W., Engelbracht, C. W., Blaylock, M., Gordon, K. D., Chen, C. H., Su, K. Y. L., & Hines, D. C. 2005, ApJ, 622, 1160
- Beichman et al. (2006a) Beichman, C. A., Bryden, G., Stapelfeldt, K. R., Gautier, T. N., Grogan, K., Shao, M., Velusamy, T., Lawler, S. M., Blaylock, M., Rieke, G. H., Lunine, J. I., Fischer, D. A., Marcy, G. W., Greaves, J. S., Wyatt, M. C., Holland, W. S., & Dent, W. R. F. 2006, ApJ, 652, 1674 (2006a)
- Beichman et al. (2006b) Beichman, C. A., Tanner, A., Bryden, G., Stapelfeldt, K. R., Werner, M. W., Rieke, G. H., Trilling, D. E., Lawler, S., & Gautier, T. N. 2006, ApJ, 639, 1166 (2006b)
- Bertone et al. (2004) Bertone, E., Buzzoni, A., Chávez, M., & Rodríguez-Merino, L. H. 2004, AJ, 128, 829
- Bessell (1990) Bessell, M. S. 1990, A&AS, 83, 357
- Bessell (1995) Bessell, M. S. 1995, PASP, 107, 672
- Bodenheimer et al. (2000) Bodenheimer, P., Hubickyj, O., & Lissauer, J. J. 2000, Icarus, 143, 2
- Bryden et al. (2009) Bryden, G., Beichman, C. A., Carpenter, J. M., Rieke, G. H., Stapelfeldt, K. R., Werner, M. W., Tanner, A. M., Lawler, S. M., Wyatt, M. C., Trilling, D. E., Su, K. Y. L., Blaylock, M., & Stansberry, J. A. 2009, ApJ, 705, 1226
- Bryden et al. (2006) Bryden, G., Beichman, C. A., Trilling, D. E., Rieke, G. H., Holmes, E. K., Lawler, S. M., Stapelfeldt, K. R., Werner, M. W., Gautier, T. N., Blaylock, M., Gordon, K. D., Stansberry, J. A., & Su, K. Y. L. 2006, ApJ, 636, 1098
- Bryden et al. (2000) Bryden, G., Lin, D. N. C., & Ida, S. 2000, ApJ, 544, 481
- Butler et al. (2006) Butler, R. P., Wright, J. T., Marcy, G. W., Fischer, D. A., Vogt, S. S., Tinney, C. G., Jones, H. R. A., Carter, B. D., Johnson, J. A., McCarthy, C., & Penny, A. J. 2006, ApJ, 646, 505
- Carpenter et al. (2009) Carpenter, J. M., Mamajek, E. E., Hillenbrand, L. A., & Meyer, M. R. 2009, ApJ, 705, 1646
- Chen et al. (2005) Chen, C. H., Patten, B. M., Werner, M. W., Dowell, C. D., Stapelfeldt, K. R., Stauffer, J. R., Blaylock, M., Gordon, K. D., & Krause, V. 2005, ApJ, 634, 1372
- Chen et al. (2006) Chen, C. H., Sargent, B. A., Bohac, C., Kim, K. H., Leibensperger, E., Jura, M., Najita, J., Forrest, W. J., Watson, D. M., Sloan, G. C., & Keller, L. D. 2006, ApJS, 166, 351
- Cochran et al. (2004) Cochran, W. D., Endl, M., McArthur, B., Paulson, D. B., Smith, V. V., MacQueen, P. J., Tull, R. G., Good, J., Booth, J., Shetrone, M., Roman, B., Odewahn, S., Deglman, F., Graver, M., Soukup, M., & Villareal, M. L., Jr. 2004, ApJ, 611, L133
- Cutri et al. (2003) Cutri, R. M., et al. 2003, The IRSA 2MASS All-Sky Point Source Catalog, NASA/IPAC Infrared Science Archive. http://irsa.ipac.caltech.edu/applications/Gator/
- Dodson-Robinson & Bodenheimer (2010) Dodson-Robinson, S. E., & Bodenheimer, P. 2010, Icarus, 207, 491
- Dodson-Robinson et al. (2009b) Dodson-Robinson, S. E., Veras, D., Ford, E. B., & Beichman, C. A. 2009, ApJ, 707, 79 (2009b)
- Dodson-Robinson et al. (2009a) Dodson-Robinson, S. E., Willacy, K., Bodenheimer, P., Turner, N. J., & Beichman, C. A. 2009, Icarus, 200, 672
- Eggenberger et al. (2007) Eggenberger, A., Udry, S., Mazeh, T., Segal, Y., & Mayor, M. 2007, A&A, 466, 1179 (2007)
- Fischer et al. (2006) Fischer, D. A., Laughlin, G., Marcy, G. W., Butler, R. P., Vogt, S. S., Johnson, J. A., Henry, G. W., McCarthy, C., Ammons, M., Robinson, S., Strader, J., Valenti, J. A., McCullough, P. R., Charbonneau, D., Haislip, J., Knutson, H. A., Reichart, D. E., McGee, P., Monard, B., Wright, J. T., Ida, S., Sato, B., & Minniti, D. 2006, ApJ, 637, 1094
- Fischer et al. (2005) Fischer, D. A., Laughlin, G., Butler, P., Marcy, G., Johnson, J., Henry, G., Valenti, J., Vogt, S., Ammons, M., Robinson, S., Spear, G., Strader, J., Driscoll, P., Fuller, A., Johnson, T., Manrao, E., McCarthy, C., Muñoz, M., Tah, K. L., Wright, J., Ida, S., Sato, B., Toyota, E., & Minniti, D. 2005, ApJ, 620, 481
- Flower (1996) Flower, P. 1996, ApJ, 469, 355
- Goldreich et al. (2004) Goldreich, P., Lithwick, Y., & Sari, R. 2004, ApJ, 614, 497
- Gomes et al. (2005) Gomes, R., Levison, H. F., Tsiganis, K., & Morbidelli, A., 2005, Nature, 435, 466
- Grigorieva et al. (2007) Grigorieva, A., Thébault, Ph., Artymowicz, A., & Brandeker, A. 2007, A&A, 475, 775
- Hauschildt et al. (1999) Hauschildt, P. H., Allard, F., & Baron, E. 1999, ApJ, 512, 377
- Higdon et al. (2004) Higdon, S. J. U., et al. 2004, PASP, 116, 975
- Hillenbrand et al. (2008) Hillenbrand, L. A., Carpenter, J. M., Kim, J. S., Meyer, M. R., Backman, D. E., Moro-Martín, A., Hollenbach, D., Hines, D. C., Pascucci, I., & Bouwman, J. 2008, ApJ, 677, 630
- Høg et al. (2000) Høg, E., et al. 2000, A&A, 355, L27
- Ida & Lin (2004) Ida, S., & Lin, D. N. C. 2004, ApJ, 604, 388
- Johnson et al. (2007) Johnson, J. A., Fischer, D. A., Marcy, G. W., Wright, J. T., Driscoll, P., Butler, R. P., Hekker, S., Reffert, S., & Vogt, S. S. 2007, ApJ, 665, 785
- Johnson et al. (2006) Johnson, J. A., Marcy, G. W., Fischer, D. A., Laughlin, G., Butler, R. P., Henry, G. W., Valenti, J. A., Ford, E. B., Vogt, S. S., & Wright, J. T. 2006, ApJ, 647, 600
- Kalas et al. (2008) Kalas, P., Graham, J. R., Chiang, E., Fitzgerald, M. P., Clampin, M., Kite, E. S., Stapelfeldt, K., Marois, C., & Krist, J. 2008, Science, 322, 1345
- Kennedy & Wyatt (2010) Kennedy, G. M., & Wyatt, M. C. 2010, MNRAS, 493 (in press)
- Konacki (2005) Konacki, M. 2005, Nature, 436, 230
- Kóspál et al. (2009) Kóspál, Á., Ardila, D. R., Moór, A., & Ábrahám, P. 2009, ApJ, 700, L73
- Kruegel (2003) Kruegel, E. 2003. The physics of interstellar dust. IoP series in astronomy and astrophysics (UK: Bristol)
- Kurucz (1992) Kurucz, R. L. 1992, The Stellar Populations of Galaxies, 149, 225
- Lawler et al. (2009) Lawler, S. M., Beichman, C. A., Bryden, G., Ciardi, D. R., Tanner, A. M., Su, K. Y. L., Stapelfeldt, K. R., Lisse, C. M., & Harker, D. E. 2009, ApJ, 705, L89
- Libert & Tsiganis (2005) Libert, A.-S., & Tsiganis, K. 2009, A&A, 493, 677
- Lin et al. (1996) Lin, D. N. C., Bodenheimer, P., & Richardson, D. C. 1996, Nature, 380, 606
- Lo Curto et al. (2006) Lo Curto, G., Mayor, M., Clausen, J. V., Benz, W., Bouchy, F., Lovis, C., Montou, C., Naef, D., Pepe, F., Queloz, D., Santos, N. C., Sivan, J.-P., Udry, S., Bonfils, X., Delfosse, X., Mordasini, C., Fouqué, P., Olsen, E. H., & Pritchard, J. D. 2006, A&A, 451, 345
- Lovis et al. (2006) Lovis, C., and 13 colleagues. 2006, Nature, 441, 305
- Lovis et al. (2005) Lovis, C., Mayor, M., Bouchy, F., Pepe, F., Queloz, D., Santos, N. C., Udry, S., Benz, W., Bertaux, J.-L., Mordasiini, C., & Sivan, J.-P. 2005, A&A, 437, 1111
- Melo et al. (2007) Melo, C., Santos, N. C., Gieren, W., Pietrzynski, G., Ruiz, M. T., Sousa, S. G., Bouchy, F., Lovis, C., Mayor, M., Pepe, F., Queloz, D., da Silva, R., & Udry, S. 2007, A&A, 467, 721
- Moro-Martín et al. (2007) Moro-Martín, A., Carpenter, J. M., Meyer, M. R., Hillenbrand, L. A., Malhotra, R., Hollenbach, D., Najita, J., Henning, T., Kim, J. S., Bouwman, J., Silverstone, M. D., Hines, D. C., Wolf, S., Pascucci, I., Mamajek, E. B., & Lunine, J. 2007, ApJ, 658, 1312
- Nordström et al. (2004) Nordström, B., Mayor, M., Andersen, J., Holmberg, J., Pont, F., Jørgensen, B. R., Olsen, E. H., Udry, S., & Mowlavi, N. 2004, A&A, 418, 989
- Peletier (1989) Peletier, R. F. 1989, Ph.D. Thesis
- Pilbratt et al. (2010) Pilbratt, G. L., Riedinger, J. R., Passvogel, T., Crone, G., Doyle, D., Gageur, U., Heras, A. M., Jewell, C., Metcalfe, L., Ott, S., & Schmidt, M. 2010, A&A, in press (arXiv:1005.5331)
- Perryman et al. (1997) Perryman, M. A. C., et al. 1997, A&A, 323, L49
- Quillen (2006) Quillen, A. 2006, MNRAS, 372, L14
- Raghavan et al. (2006) Raghavan, D., Henry, T. J., Mason, B. D., Subasavage, J. P., Jao, W.-C., Beaulieu, T. D., & Hambly, N. C. 2006, ApJ, 646, 523
- Raymond et al. (2006) Raymond, S. N., Mandell, A. M., & Sigurdsson, S. 2006, Science, 313, 1413
- Rocha-Pinto & Maciel (1998) Rocha-Pinto, H. J., & Maciel, W. J. 1998, MNRAS, 298, 332
- Saffe et al. (2005) Saffe, C., Gómez, M., & Chavero, C. 2005, A&A, 443, 609
- Santos et al. (2004a) Santos, N. C., Bouchy, F., Mayor, M., Pepe, F., Queloz, D., Udry, S., Lovis, C., Bazot, M., Benz, W., Bertaux, J.-L., Lo Curto, G., Delfosse, X., Mordasini, C., Naef, D., Sivan, J.-P., & Vauclair, S. 2004, A&A, 426, L19 (2004a)
- Santos et al. (2004b) Santos, N. C., Israelian, G., & Mayor, M. 2004, A&A, 415, 1153 (2004b)
- Santos et al. (2005) Santos, N. C., Israelian, G., Mayor, M., Bento, J. P., Almeida, P. C., Sousa, S. G., & Ecuvillon, A. 2005, A&A, 437, 1127
- Santos et al. (2003) Santos, N. C., Israelian, G., Mayor, M., Rebolo, R., & Udry, S. 2003, A&A, 398, 363
- Santos et al. (2002) Santos, N. C., Mayor, M., Naef, D., Pepe, F., Queloz, D., Udry, S., Burnet, M., Clausen, J. V., Helt, B. E., Olsen, E. H., & Pritchard, J. D. 2002, A&A, 392, 215
- Sato et aol (2005) Sato, B., Fischer, D. A., Henry, G. W., Laughlin, G., Butler, R. P., Marcy, G. W., Vogt, S. S., Bodenheimer, P., Ida, S., Toyota, E., Wolf, A., Valenti, J. A., Boyd, L. J., Johnson, J. A., Wright, J. T., Ammons, M., Robinson, S., Strader, J., McCarthy, C., Tah, K. L., & Minniti, D. 2005, ApJ, 633, 465
- Sozzetti et al. (2006) Sozzetti, A., Udry, S., Zucker, S., Torres, G., Beuzit, J. L., Latham, D. W., Mayor, M., Mazeh, T., Naef, D., Perrier, C., Queloz, D., & Sivan, J.-P. 2006, A&A, 449, 417
- Su et al. (2006) Su, K. Y. L., Rieke, G. H., Stansberry, J. A., Bryden, G., Stapelfeldt, K. R., Trilling, D. E., Muzerolle, J., Beichman, C. A., Moro-Martín, A., Hines, D. C., & Werner, M. W. 2006, ApJ, 653, 675
- Tanner et al. (2009) Tanner, A., Beichman, C., Bryden, G., Lisse, C., & Lawler, S. 2009, ApJ, 704, 109
- Thommes et al. (2003) Thommes, E. W., Duncan, M. J., & Levison, H. F. 2003, Icarus, 161, 431
- Trilling et al. (2008) Trilling, D. E., Bryden, G., Beichman, C. A., Rieke, G. H., Su, K. Y. L., Stansberry, J. A., Blaylock, M., Stapelfeldt, K. R., Beeman, J. W., & Haller, E. E. 2008, ApJ, 674, 1086
- Valenti & Fischer (2005) Valenti, J. A., & Fischer, D. A. 2005, ApJS, 159, 141 (VF05)
- Wright et al. (2004) Wright, J. T., Marcy, G. W., Butler, R. P., & Vogt, S. S. 2004, ApJS, 152, 261
| HD | Name | Spectral Type | Reference | (mag) | Dist. (pc) | Planets | (70 m) | 70 m Reference | |
|---|---|---|---|---|---|---|---|---|---|
| GJ 581 | M3 | 3310 | Bessell (1995) | 10.57 | 6.3 | 3 | 8.49 | Kospal et al. (2009) | |
| GJ 876 | M4 | 3130 | Bessell (1995) | 10.17 | 4.7 | 3 | 3.2 | Kospal et al. (2009) | |
| Hip 14810 | G5 | 5485 | Wright et al. (2009) | 8.52 | 52.9 | 3 | |||
| 142 | F7V | 6248 | VF05aaVF05 = Valenti & Fischer (2005) | 5.70 | 25.6 | 1 | 0.8 | B09bbB09 = Bryden et al. (2009) | |
| 166 | K0V | 5577 | VF05 | 6.13 | 13.7 | 0 | 6.0 | Trilling et al. (2008) | |
| 1237 | GJ 3021 | G8.5Vk: | 5360 | Santos et al. (2004b) | 6.59 | 17.6 | 1 | 1.0 | B09 |
| 3651 | K0V | 5220 | VF05 | 5.80 | 11.1 | 1 | 1.1 | B09 | |
| 4203 | G5 | 5701 | VF05 | 8.69 | 77.8 | 1 | 23.9 | B09 | |
| 4208 | G7VFe-1H-05 | 5600 | VF05 | 7.79 | 32.7 | 1 | 2.9 | B09 | |
| 8574 | F8 | 6049 | VF05 | 7.11 | 44.2 | 1 | 1.5 | B09 | |
| 10697 | 109 Psc | G5IV | 5680 | VF05 | 6.29 | 32.6 | 1 | 1.3 | B09 |
| 11964 | G5 | 5349 | VF05 | 6.42 | 34.0 | 2 | 1.0 | B09 | |
| 12661 | K0V | 5742 | VF05 | 7.44 | 37.2 | 2 | 6.5 | B09 | |
| 13445 | GJ 86 | K1V | 5150 | VF05 | 6.17 | 10.9 | 1 | ||
| 16141 | G5IV | 5793 | VF05 | 6.78 | 35.9 | 1 | 2.6 | B09 | |
| 17051 | HR 810 | F9VFe+03 | 6038 | Rocha-Pinto & Maciel (1998) | 5.40 | 17.2 | 1 | 0.5 | B09 |
| 19994 | F8V | 6188 | VF05 | 5.06 | 22.4 | 1 | 0.5 | B09 | |
| 20367 | G0 | 6100 | Santos et al. (2004b) | 6.41 | 27.1 | 1 | 1.1 | B09 | |
| 20782 | G1.5V | 5758 | VF05 | 7.38 | 36.0 | 1 | 2.1 | B09 | |
| 23079 | F9.5V | 5927 | VF05 | 7.12 | 34.6 | 1 | 0.9 | B09 | |
| 23127 | G2V | 5752 | VF05 | 8.58 | 89.1 | 1 | 7.3 | B09 | |
| 23596 | F8 | 5903 | VF05 | 7.25 | 52.0 | 1 | 3.1 | B09 | |
| 27442 | Ret | K2III | 4845 | VF05 | 4.44 | 18.2 | 1 | 0.3 | B09 |
| 27894 | K2V | 4875 | Santos et al. (2005) | 9.42 | 42.4 | 1 | 10.6 | B09 | |
| 28185 | G6.5IV-V | 5656 | Santos et al. (2004b) | 7.80 | 39.6 | 1 | 5.7 | B09 | |
| 30177 | G8V | 5607 | VF05 | 8.41 | 54.7 | 1 | 11.2 | B09 | |
| 33262 | Dor | F7V | 6200 | Flower (1996) | 4.72 | 11.7 | 0 | 0.51 | Trilling et al. (2008) |
| 33283 | G4V | 5995 | Johnson et al. (2006) | 8.05 | 86.9 | 1 | 4.9 | B09 | |
| 33564 | F6V | 6250 | Nordstrom et al. (2004) | 5.10 | 21.0 | 1 | 0.5 | B09 | |
| 33636 | G0VH-03 | 5904 | VF05 | 7.06 | 28.7 | 0 | 5.1 | Trilling et al. (2008) | |
| 37124 | G4IV-V | 5500 | VF05 | 7.68 | 33.2 | 3 | 7.2 | B09 | |
| 37605 | K0 | 5475 | Cochran et al. (2004) | 8.69 | 42.9 | 1 | 23.2 | B09 | |
| 40979 | F8 | 6089 | VF05 | 6.73 | 33.3 | 1 | 1.44 | Kospal et al. (2009) | |
| 41004 | HD 41004 A | K1V | 5010 | Santos et al. (2002) | 8.65 | 43.0 | 1 | 6.9 | B09 |
| 45350 | G5 | 5616 | VF05 | 7.88 | 48.9 | 1 | 7.2 | B09 | |
| 46375 | K1IV | 5285 | VF05 | 7.84 | 33.4 | 1 | 17.8 | Kospal et al. (2009) | |
| 49674 | G0 | 5662 | VF05 | 8.10 | 40.7 | 1 | 4.5 | B09 | |
| 50499 | G1V | 6069 | VF05 | 7.21 | 47.3 | 1 | 1.6 | Kospal et al. (2009) | |
| 50554 | F8V | 5928 | VF05 | 6.84 | 31.0 | 1 | 5.85 | Trilling et al. (2008) | |
| 52265 | G0V | 6076 | VF05 | 6.30 | 28.1 | 1 | 2.69 | Trilling et al. (2008) | |
| 63454 | K3V | 4841 | VF05 | 9.37 | 35.8 | 1 | 16.0 | B09 | |
| 65216 | G5V | 5666 | Santos et al. (2003) | 7.97 | 35.6 | 1 | 4.4 | B09 | |
| 68988 | G0 | 5960 | VF05 | 8.20 | 58.8 | 1 | 4.2 | B09 | |
| 70642 | G6VCN+05 | 5705 | VF05 | 7.18 | 28.8 | 1 | 6.3 | B09 | |
| 72659 | G0 | 5919 | VF05 | 7.46 | 51.4 | 1 | 2.2 | B09 | |
| 73256 | G8IV-VFe+05 | 5570 | Udry et al. (2003) | 8.08 | 36.5 | 1 | 5.5 | B09 | |
| 74156 | G0 | 6067 | VF05 | 7.61 | 64.6 | 3 | 3.4 | B09 | |
| 75289 | F9VFe+03 | 6095 | VF05 | 6.36 | 28.9 | 1 | 14.9 | B09 | |
| 76700 | G6V | 5668 | VF05 | 8.13 | 59.7 | 1 | 3.7 | B09 | |
| 81040 | G0 | 5700 | Sozzetti et al. (2006) | 7.72 | 32.6 | 1 | 3.2 | B09 | |
| 83443 | K0V | 5453 | VF05 | 8.24 | 43.5 | 1 | 9.0 | B09 | |
| 88133 | G5IV | 5494 | Fischer et al. (2005) | 8.06 | 74.5 | 1 | |||
| 89307 | G0V | 5897 | VF05 | 7.01 | 30.9 | 1 | 2.8 | B09 | |
| 89744 | F7V | 6291 | VF05 | 5.74 | 39.0 | 1 | 0.9 | B09 | |
| 93083 | K2IV-V | 4995 | Lovis et al. (2005) | 8.33 | 28.9 | 1 | 9.2 | B09 | |
| 99492 | K2V | 4954 | VF05 | 7.57 | 18.0 | 1 | 5.1 | B09 | |
| 102117 | G6V | 5695 | VF05 | 7.47 | 42.0 | 1 | 16.8 | B09 | |
| 102195 | K0 | 5291 | Melo et al. (2007) | 8.06 | 29.0 | 1 | 9.2 | B09 | |
| 105211 | Cru | F2V | 6600ccBased on tabulated values for vs. | Peletier (1989) | 4.15 | 19.7 | 0 | 6.9 | Beichman et al. (2006a) |
| 107148 | G5 | 5797 | VF05 | 8.01 | 51.3 | 1 | 5.6 | B09 | |
| 108147 | F8VH+04 | 6156 | VF05 | 7.00 | 38.6 | 1 | 23.9 | B09 | |
| 108874 | G5 | 5550 | VF05 | 8.74 | 68.5 | 2 | 13.6 | B09 | |
| 109749 | G3V | 5903 | Fischer et al. (2006) | 8.08 | 59.0 | 1 | 6.2 | B09 | |
| 111232 | G8VFe-10 | 5494 | Santos et al. (2004b) | 7.61 | 28.9 | 1 | 6.1 | B09 | |
| 114386 | K3V | 4819 | VF05 | 8.73 | 28.0 | 1 | 6.8 | B09 | |
| 114762 | F9V | 5952 | VF05 | 7.30 | 40.6 | 1 | 3.3 | B09 | |
| 114783 | K0 | 5135 | VF05 | 7.56 | 20.4 | 1 | 3.0 | B09 | |
| 117176 | 70 Vir | G5V | 5544 | VF05 | 5.00 | 18.1 | 1 | 0.97 | Trilling et al. (2008) |
| 117207 | G7IV-V | 5723 | VF05 | 7.26 | 33.0 | 1 | 2.1 | B09 | |
| 117618 | G0V | 5963 | VF05 | 7.17 | 38.0 | 1 | 2.3 | B09 | |
| 118203 | K0 | 5695 | da Silva et al. (2006) | 8.05 | 88.6 | 1 | 13.2 | B09 | |
| 130322 | K0III | 5308 | VF05 | 8.04 | 29.8 | 1 | 7.9 | B09 | |
| 134987 | 23 Lib | G5V | 5750 | VF05 | 6.45 | 25.7 | 2 | 2.70 | Trilling et al. (2008) |
| 136118 | F8 | 6097 | VF05 | 6.93 | 52.3 | 1 | 1.3 | B09 | |
| 142415 | G1V | 5901 | VF05 | 7.34 | 34.6 | 1 | 10.9 | B09 | |
| 143761 | Cr B | GOV | 5823 | VF05 | 5.40 | 17.4 | 1 | 0.6 | B09 |
| 145675 | 14 Her | K0V | 5347 | VF05 | 6.67 | 18.1 | 2 | 1.0 | B09 |
| 147513 | G1VH-04 | 5929 | VF05 | 5.38 | 12.9 | 1 | 1.6 | B09 | |
| 149026 | G0IV | 6147 | Sato et al. (2005) | 8.15 | 78.9 | 1 | 5.2 | B09 | |
| 149143 | G0 | 5884 | Fischer et al. (2006) | 7.89 | 63.5 | 1 | 4.6 | B09 | |
| 154857 | G5V | 5605 | VF05 | 7.24 | 68.5 | 1 | 4.7 | B09 | |
| 159868 | G5V | 5623 | VF05 | 7.24 | 52.7 | 1 | 9.9 | B09 | |
| 160691 | Arae | G3IV-V | 5784 | Santos et al. (2004a) | 5.15 | 15.3 | 4 | 0.9 | B09 |
| 162020 | K2V | 4844 | VF05 | 9.10 | 31.3 | 1 | 28.6 | B09 | |
| 168443 | G6V | 5579 | VF05 | 6.92 | 37.9 | 2 | 14.7 | B09 | |
| 169830 | F7V | 6221 | VF05 | 5.91 | 36.3 | 2 | 1.5 | B09 | |
| 177830 | K0 | 4948 | VF05 | 7.18 | 59.0 | 1 | 1.4 | B09 | |
| 183263 | G2IV | 5936 | VF05 | 7.86 | 52.8 | 2 | 9.1 | B09 | |
| 185269 | G0IV | 5980 | Johnson et al. (2006) | 6.68 | 47.4 | 1 | 2.4 | B09 | |
| 186427 | 16 Cyg B | G3V | 5674 | VF05 | 6.20 | 21.4 | 1 | 1.3 | B09 |
| 187085 | G0V | 6075 | VF05 | 7.22 | 45.0 | 1 | 2.3 | Kospal et al. (2009) | |
| 187123 | G5 | 5814 | VF05 | 7.83 | 47.9 | 2 | 10.6 | B09 | |
| 188015 | G5IV | 5745 | VF05 | 8.24 | 52.6 | 1 | 29.4 | B09 | |
| 188753 | HD 188753 A | G8V | 5750 | Konacki (2005) | 7.40 | 44.8 | 0ddPlanet’s existence under debate; see Eggenberger et al. (2007b) | 8.7 | B09 |
| 190360 | G7IV-V | 5551 | VF05 | 5.71 | 15.9 | 2 | 9.7 | B09 | |
| 192263 | K2V | 4975 | VF05 | 7.79 | 19.9 | 1 | 5.4 | B09 | |
| 192699 | G5 | 5220 | Johnson et al. (2007) | 6.45 | 67.4 | 1 | 1.1 | B09 | |
| 195019 | G3IV-V | 5788 | VF05 | 6.91 | 37.4 | 1 | 2.1 | B09 | |
| 196050 | G3V | 5892 | VF05 | 7.50 | 46.9 | 1 | 2.7 | B09 | |
| 196885 | F8IV | 6185 | VF05 | 6.40 | 33.0 | 1 | 1.0 | B09 | |
| 202206 | G6V | 5787 | VF05 | 8.08 | 46.3 | 2 | 14.3 | B09 | |
| 208487 | G2V | 6067 | VF05 | 7.47 | 44.0 | 1 | 4.9 | B09 | |
| 210277 | G0V | 5555 | VF05 | 6.63 | 21.3 | 1 | 0.8 | B09 | |
| 212301 | F8V | 6256 | Lo Curto et al. (2006) | 7.76 | 52.7 | 1 | 4.9 | B09 | |
| 213240 | G0/G1V | 5967 | VF05 | 6.80 | 40.7 | 1 | 1.1 | B09 | |
| 216435 | G0V | 5999 | VF05 | 6.03 | 33.3 | 1 | 2.2 | B09 | |
| 216770 | G9VCN+1 | 5229 | Mayor et al. (2004) | 8.10 | 37.9 | 1 | 19.0 | B09 | |
| 217107 | G8IV | 5704 | VF05 | 6.18 | 19.7 | 2 | 1.5 | B09 | |
| 219482 | F6V | 6240 | Flower (1996) | 5.66 | 20.6 | 0 | 2.8 | Beichman et al. (2006a) | |
| 222404 | Cep | K1IV | 4916 | Santos et al. (2004b) | 3.23 | 13.8 | 1 | 0.3 | B09 |
| 222582 | G5 | 5726 | VF05 | 7.68 | 41.9 | 1 | 2.3 | B09 | |
| 224693 | G2V | 6037 | Butler et al. (2006) | 8.23 | 94.1 | 1 | 8.0 | B09 |
| HD | Name | aaUpper limits to the dust luminosity are calculated assuming a single-temperature blackbody with K. For cold dust undetected by both MIPS and IRS, the true luminosity ratio may be higher than the value quoted here. See §5 for further discussion of the relationship between observed 30-34 m fluxes and grain luminosity. | (K) bbGrain temperature estimates are based on the blackbody approximation. For a discussion of temperature as a function of grain size, see §6. | ||||
|---|---|---|---|---|---|---|---|
| GJ 581 | 16.1 | 17.1 | 0.99 | 0.06 | |||
| GJ 876 | 24.8 | 25.3 | 0.67 | 0.02 | |||
| Hip 14810 | 7.5 | 7.0 | 0.93 | -0.07 | |||
| 142 | 30.9 | 30.8 | 2.67 | 0.00 | |||
| 166 | 78.9 | 119 | 2.00 | 0.50 | 7.4 | ||
| 1237 | GJ 3021 | 39.9 | 38.7 | 1.71 | -0.03 | ||
| 3651 | 98.6 | 101.0 | 2.29 | 0.02 | |||
| 4203 | 5.8 | 5.9 | 0.40 | 0.01 | |||
| 4208 | 12.8 | 13.1 | 0.87 | 0.02 | |||
| 8574 | 19.2 | 17.7 | 1.57 | -0.08 | |||
| 10697 | 109 Psc | 48.7 | 48.1 | 1.98 | -0.01 | ||
| 11964 | 8.3 | 8.3 | 1.39 | 0.00 | |||
| 12661 | 18.7 | 19.6 | 0.86 | 0.05 | |||
| 13445 | GJ 86 | 90.3 | 88.3 | 3.00 | -0.02 | ||
| 16141 | 32.4 | 31.4 | 1.72 | -0.03 | |||
| 17051 | HR 810 | 107.4 | 108.9 | 2.34 | 0.01 | ||
| 19994 | 126.0 | 124.0 | 2.91 | -0.02 | |||
| 20367 | 76.0 | 76.1 | 1.43 | 0.00 | |||
| 20782 | 20.3 | 20.0 | 1.29 | -0.02 | |||
| 23079 | 20.1 | 21.0 | 1.11 | 0.05 | |||
| 23127 | 5.5 | 4.9 | 0.65 | -0.10 | |||
| 23596 | 24.9 | 25.0 | 1.16 | 0.00 | |||
| 27442 | Ret | 241.0 | 240.9 | 3.52 | -0.30 | ||
| 27894 | 2.5 | 2.5 | 0.67 | -0.02 | |||
| 28185 | 13.2 | 13.1 | 0.59 | -0.01 | |||
| 30177 | 8.4 | 8.0 | 0.51 | -0.05 | |||
| 33262 | Dor | 177.3 | 192.9 | 1.64 | 0.09 | 0.8 | |
| 33283 | 8.5 | 9.5 | 0.81 | 0.12 | |||
| 33564 | 109.6 | 112.3 | 2.78 | 0.03 | |||
| 33636 | 24.4 | 29.7 | 0.85 | 0.22 | 5.2 | ||
| 37124 | 16.4 | 14.9 | 1.18 | -0.09 | |||
| 37605 | 7.6 | 8.4 | 0.51 | 0.11 | |||
| 40979 | 27.4 | 28.7 | 0.90 | 0.05 | |||
| 41004 | HD 41004 A | 11.7 | 12.2 | 0.61 | 0.04 | ||
| 45350 | 6.4 | 6.4 | 0.47 | -0.01 | |||
| 46375 | 10.7 | 11.5 | 6.66 | 0.07 | |||
| 49674 | 10.3 | 10.6 | 0.40 | 0.03 | |||
| 50499 | 18.1 | 18.3 | 0.65 | 0.01 | |||
| 50554 | 25.6 | 31.0 | 0.68 | 0.21 | 6.2 | ||
| 52265 | 41.0 | 44.5 | 0.66 | 0.09 | 2.9 | ||
| 63454 | 7.1 | 7.3 | 0.47 | 0.03 | |||
| 65216 | 11.4 | 10.1 | 0.63 | -0.11 | |||
| 68988 | 8.3 | 8.9 | 0.32 | 0.08 | |||
| 70642 | 23.5 | 23.0 | 0.63 | -0.02 | |||
| 72659 | 16.5 | 17.7 | 0.67 | 0.08 | |||
| 73256 | 12.3 | 11.8 | 0.52 | -0.05 | |||
| 74156 | 12.2 | 11.5 | 0.58 | -0.06 | |||
| 75289 | 38.1 | 31.7 | 1.54 | -0.17 | |||
| 76700 | 10.4 | 10.0 | 0.70 | -0.05 | |||
| 81040 | 16.0 | 16.5 | 0.84 | 0.03 | |||
| 83443 | 10.8 | 9.5 | 0.41 | -0.12 | |||
| 88133 | 14.7 | 14.0 | 0.56 | -0.05 | |||
| 89307 | 25.5 | 25.0 | 0.84 | -0.02 | |||
| 89744 | 53.7 | 53.8 | 2.47 | 0.00 | |||
| 93083 | 10.0 | 10.0 | 0.46 | 0.00 | |||
| 99492 | 30.6 | 31.4 | 1.08 | 0.03 | |||
| 102117 | 19.5 | 20.4 | 1.09 | 0.05 | |||
| 102195 | 13.3 | 13.9 | 0.42 | 0.04 | |||
| 105211 | Cru | 178.5 | 215.6 | 3.30 | 0.21 | 6.7 | |
| 107148 | 10.4 | 9.6 | 0.68 | -0.08 | |||
| 108147 | 29.4 | 29.2 | 0.99 | -0.01 | |||
| 108874 | 5.9 | 7.9 | 0.33 | 0.32 | |||
| 109749 | 8.0 | 7.5 | 0.61 | -0.06 | |||
| 111232 | 54.4 | 54.3 | 1.26 | 0.00 | |||
| 114386 | 12.5 | 13.7 | 0.71 | 0.09 | |||
| 114762 | 19.3 | 19.7 | 1.13 | 0.02 | |||
| 114783 | 21.1 | 20.7 | 1.39 | -0.02 | |||
| 117176 | 70 Vir | 173.0 | 182.1 | 2.87 | 0.05 | 1.0 | |
| 117207 | 21.1 | 18.6 | 1.61 | -0.12 | |||
| 117618 | 21.2 | 20.4 | 1.04 | -0.04 | |||
| 130322 | 13.0 | 16.1 | 0.58 | 0.24 | |||
| 134987 | 23 Lib | 39.9 | 40.4 | 0.76 | 0.01 | ||
| 136118 | 26.7 | 26.3 | 0.88 | -0.01 | |||
| 142415 | 17.6 | 19.2 | 0.59 | 0.09 | |||
| 143761 | Cr B | 87.2 | 87.6 | 2.19 | 0.01 | ||
| 145675 | 14 Her | 53.2 | 50.7 | 2.57 | -0.05 | ||
| 147513 | 110.5 | 115.4 | 2.78 | 0.05 | |||
| 149026 | 7.8 | 7.9 | 0.35 | 0.02 | |||
| 149143 | 10.8 | 11.5 | 0.31 | 0.06 | |||
| 154857 | 29.1 | 29.5 | 0.94 | 0.01 | |||
| 159868 | 23.71 | 21.93 | 0.78 | -0.075 | |||
| 160691 | Arae | 247.1 | 247.3 | 2.36 | 0.00 | ||
| 162020 | 10.2 | 9.5 | 0.36 | -0.07 | |||
| 168443 | 30.4 | 29.8 | 1.70 | -0.02 | |||
| 169830 | 50.2 | 51.3 | 1.31 | 0.02 | |||
| 177830 | 43.4 | 42.4 | 2.48 | -0.02 | |||
| 183263 | 9.7 | 10.8 | 0.51 | 0.12 | |||
| 185269 | 34.5 | 35.0 | 1.43 | 0.02 | |||
| 186427 | 16 Cyg B | 52.6 | 54.2 | 3.74 | 0.03 | ||
| 187085 | 16.7 | 16.9 | 0.80 | 0.01 | |||
| 187123 | 12.5 | 12.8 | 0.57 | 0.03 | |||
| 188015 | 9.1 | 7.5 | 0.91 | -0.18 | |||
| 188753 | HD 188753 A | 24.6 | 24.3 | 1.17 | -0.01 | ||
| 190360 | 91.1 | 94.4 | 1.83 | 0.05 | |||
| 192263 | 22.4 | 21.9 | 1.04 | -0.02 | |||
| 192699 | 84.0 | 85.6 | 2.48 | 0.02 | |||
| 195019 | 31.2 | 32.7 | 0.80 | 0.03 | |||
| 196050 | 14.9 | 16.4 | 1.52 | 0.10 | |||
| 196885 | 25.9 | 1.00 | 0.00 | ||||
| 202206 | 10.4 | 14.3 | 0.35 | 0.38 | 12 | ||
| 208487 | 13.5 | 12.3 | 0.69 | -0.09 | |||
| 210277 | 53.9 | 55.3 | 1.98 | 0.03 | |||
| 212301 | 11.2 | 11.7 | 0.64 | 0.04 | |||
| 213240 | 34.2 | 34.4 | 1.50 | 0.01 | |||
| 216435 | 59.3 | 67.0 | 2.81 | 0.13 | |||
| 216770 | 10.2 | 10.4 | 0.55 | 0.02 | |||
| 217107 | 56.9 | 55.1 | 3.64 | -0.03 | |||
| 219482 | 66.5 | 91.0 | 1.15 | 0.37 | 3.7 | ccOur temperature measurement for the circumstellar dust of HD 219482 agrees with that of Beichman et al. (2006), who calculated K based on 24 and 70 m photometry. | |
| 222404 | Cep | 1622.0 | 1637.0 | 8.36 | 0.01 | ||
| 222582 | 12.4 | 12.1 | 0.59 | -0.03 | |||
| 224693 | 6.3 | 6.1 | 0.62 | -0.03 |