The Type Ib SN 1999dn: One Year of Photometric and Spectroscopic Monitoring. ††thanks: Based on observations collected at the European Organisation for Astronomical Research in the Southern Hemisphere, Chile (ESO programmes 64.H-0604 and 65.H-0292), at the Italian 3.58m Telescopio Nazionale Galileo and the William Herschel Telescope (La Palma, Spain), and at the Copernico telescope (Asiago, Italy).
Abstract
Extensive optical and near-infrared (NIR) observations of the type Ib supernova 1999dn are presented, covering the first year after explosion. These new data turn this object, already considered a prototypical SNIb, into one of the best observed objects of its class. The light curve of SN 1999dn is mostly similar in shape to that of other SNeIb but with a moderately faint peak (M mag). From the bolometric light curve and ejecta expansion velocities, we estimate that about M⊙ of 56Ni were produced during the explosion and that the total ejecta mass was M⊙ with a kinetic energy of at least erg. The spectra of SN 1999dn at various epochs are similar to those of other Stripped Envelope (SE) SNe showing clear presence of H at early epochs. The high explosion energy and ejected mass, along with the small flux ratio [CaII]/[OI] measured in the nebular spectrum, together with the lack of signatures of dust formation and the moderate metallicity environment is not inconsistent with a single massive progenitor (M M⊙) for SN 1999dn.
keywords:
Supernovae and Supernova Remnants: general – Supernovae and Supernova Remnants: 1999dn1 Introduction
In the Supernova (SN) taxonomy, type Ib Supernovae (SNIb) are defined as the subclass of Core-Collapse explosions (CC-SNe) whose early-time spectra are characterized by strong HeI lines (e.g. Wheeler & Levreault, 1985; Turatto, Benetti, & Pastorello, 2007). CC-SNe are thought to descend from massive progenitors (M M⊙) and include also the most frequent, H-dominated type II SNe (SNII) as well as type Ic SNe (SNIc), which appear deprived of both H and He. The physical connection among these subtypes is provided by their location almost exclusively in spiral galaxies (e.g. Hakobyan et al., 2008) and, in particular, by their association to massive star formation regions (e.g. Van Dyk et al., 1999; Anderson & Jones, 2008). An additional evidence of a link between the different subtypes of CCSNe came with the discovery of objects, called type IIb, that metamorphose from type II at early stages to type Ib later on. The prototype of this subclass is SN 1993J in M81, one of the best studied SNe at all wavelengths ever (e.g. Barbon et al., 1995; Richmond et al., 1996b).
While early time spectra of CC-SNe can be very different as a consequence of the different configurations of the progenitors at the moment of their explosions, late time spectra of all CC-SNe are consistently similar with strong emission lines of neutral and singly ionized O and Ca, in addition to H Balmer lines for SNII. The standard scenario is that SNIb descend from massive stars that have lost their H envelope through strong winds or mass transfer to a companion (Heger et al., 2003). If in addition to the H also the He envelope has been removed, then the SN will appear of type Ic. For this reason SNIb, Ic and IIb are often referred to as Stripped Envelope (SE) SNe.
With the improved quality of data, the differences between type Ib and Ic have shown to be subtle, and classifications often controversial. For instance, in SN 1994I, early on considered as the prototypical SNIc, has been found possible signature of He (Filippenko et al., 1995; Clocchiatti et al., 1996); the type Ib SN 1999ex was characterized by weak optical HeI but strong HeI 10830, 20581 lines in the near-IR (Hamuy et al., 2002); the peculiar SN 2005bf (Folatelli et al., 2006) and SN 2008D (Mazzali et al., 2008; Modjaz et al., 2009) underwent a metamorphosis from a broad line type Ic at early times to a typical type Ib at later epochs. The sharp distinction between the two classes seems therefore to be replaced by a continuity of properties in He abundances and/or excitation.
The study of stripped-envelope SNIb/c has received fresh impetus in the past decade because of the association of some of them, in particular the most energetic SNIc (hypernovae), with GRBs of long duration (Galama et al., 1998; Hjorth et al., 2003; Malesani et al., 2004). More recently a few SNIc have been associated with less energetic X-ray flashes (Fynbo et al., 2004; Modjaz et al., 2006; Pian et al., 2006). An X-ray flash was also detected in the type Ib SN 2008D, which was attributed either to shock break-out at the star surface (Soderberg et al., 2008) or to the effect of mildly relativistic jets due to the collapse of a 30 M⊙ star to a black hole (Mazzali et al., 2008).
Despite this renewed interest the objects with detailed observations remain few. In particular, it is not well ascertained if SNIb do exist as a distinct class or if there is a uniform distribution of objects from SNII to SNIc with decreasing H (and He) content in the outer layers. In this context, SN 1999dn is interesting because it has been adopted several times in the past to describe the average properties of SNIb (e.g. Branch et al., 2002; Chornock et al., 2010).
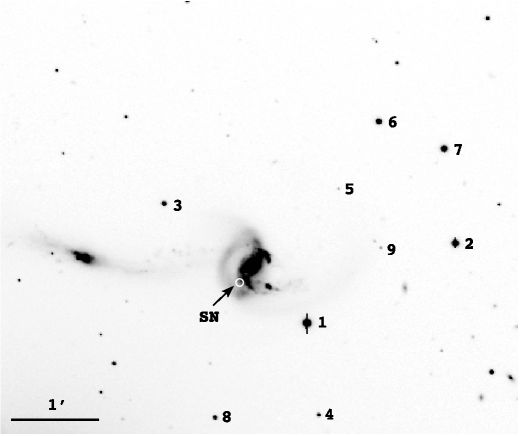
SN 1999dn was discovered by Qiu et al. (1999a) on two unfiltered CCD images obtained on Aug. 19.76 and 19.82 UT, respectively, in the Wolf-Rayet galaxy NGC 7714. The SN position is R.A.(2000.0)=23h36m14s.7; Dec(2000.0)= +02o09′ 08.8, 9.9E, 9.4S of the galaxy nucleus (Qiu et al., 1999a), in a region of steep background variation (Fig. 1). The parent galaxy, NGC 7714, is classified as SBb peculiar, and identified by Weedman et al. (1981) as a prototypical starburst galaxy. A second SN (2007fo), has been recently discovered 2.5W, 12.4N of the galaxy nucleus (Khandrika & Li, 2007), which showed similarly prominent He I lines and was also classified as SNIb (Desroches et al., 2007). Another highly reddened SN candidate was detected 2W, 5N of the galaxy nucleus on UKIRT archival K-band images taken on 1998, Dec. 5 (but not in H band, i.e. (H–K) Mattila et al., 2002).
A series of spectra of SN 1999dn has been taken soon after the discovery by different groups which classified the SN as type Ia (Qiu et al., 1999b) and as type Ic because of the lack or weakness of He lines (Ayani et al., 1999; Turatto et al., 1999). Few days later the HeI lines emerged and the SN was re-classified as a SNIb/c by Pastorello et al. (1999). A week later the HeI lines strengthened again making the spectra of this SN very similar to those of other type Ib’s.
Due to the early discovery, SN 1999dn was observed by several groups (Deng et al., 2000; Matheson et al., 2001). It soon became one of the best–observed SNIb and a test case for extensive modeling (Deng et al., 2000; Branch et al., 2002; Ketchum, Baron, & Branch, 2008; James & Baron, 2010). In this paper we present original data collected at La Silla, La Palma and Asiago, and analyze them together with published material. The joint set of observations gives good multicolor photometry and dense spectral sampling, starting one week before maximum up to over two months. The SN has been recovered at late time in imaging (Van Dyk et al., 2003) and spectroscopy (Taubenberger et al., 2009).
2 Observations
UBVRIJHK′ photometry of SN 1999dn was obtained at ESO-La Silla and TNG-La Palma. Ten photometric nights were used to calibrate a local sequence of stars through comparison with photometric standard stars (Landolt, 1992). In turn, the local sequence was used to calibrate observations obtained during non-photometric nights. The magnitudes of the local sequence, labeled in Fig. 1, are reported in Tab. 1. The estimated errors (mean standard deviation) are reported in parentheses. Due to the small field of view of Arnica only star 1 was always included in the NIR frames, which then is the reference to check the calibration of the JHK′ photometry. The averages of the measurements of this stars in three nights are reported in the footnote of Tab. 1 along with their standard deviations. The moderate dispersions of the measurements and their consistency with the 2MASS Point Source Catalogue (difference ) (Skrutskie et al., 2006) add confidence to the photometric calibration.
| star | U | B | V | R | I |
|---|---|---|---|---|---|
| 1∗ | 15.20(05) | 14.73(03) | 13.84(01) | 13.43(03) | 12.86(02) |
| 2 | 15.76(06) | 15.45(04) | 14.65(02) | 14.20(02) | 13.80(03) |
| 3 | 17.91(13) | 17.35(06) | 16.38(02) | 15.83(01) | 15.36(04) |
| 4 | 19.36(16) | 18.58(08) | 17.62(03) | 17.07(09) | 16.56(06) |
| 5 | 22.82: | 21.57(09) | 19.95(07) | 18.73(03) | 17.44(04) |
| 6 | 16.19(02) | 16.20(04) | 15.44(05) | 14.97(03) | 14.55(06) |
| 7 | 15.68(05) | 15.69(03) | 15.03(02) | 14.64(02) | 14.27(02) |
| 8 | 19.83(09) | 18.43(09) | 17.02(04) | 16.13(04) | 15.47(11) |
| 9 | 22.71(09) | 21.31(09) | 19.72(04) | 18.70(05) | 17.58(12) |
∗ J, H, K
The new photometric measurements of the SN are listed in Tab. 2. Observations were obtained on 19 different epochs up to one year after explosion. Data reduction followed standard procedures making use of a PSF fitting technique for the SN measurements. The mean photometric errors, estimated with artificial stars experiments, are given in parentheses.
| date | JD∗ | U | B | V | R | I | J | H | K′ | instr. |
|---|---|---|---|---|---|---|---|---|---|---|
| 25/08/99 | 51415.71 | 16.93(06) | 16.80(05) | 16.18(04) | 15.96(04) | 15.82(06) | DF | |||
| 28/08/99 | 51418.79 | 16.93(06) | 16.81(05) | 16.10(04) | 15.80(04) | 15.72(06) | DF | |||
| 03/09/99 | 51424.77 | 17.23(06) | 17.01(05) | 16.24(04) | 15.92(04) | 15.65(06) | DF | |||
| 06/09/99 | 51427.77 | 17.62(06) | 17.15(05) | 16.30(05) | 15.95(06) | 15.66(06) | DF | |||
| 11/09/99 | 51433.49 | 18.59(06) | 17.71(05) | 16.59(04) | 16.11(05) | 15.69(05) | OIG | |||
| 14/09/99 | 51435.76 | 18.71(06) | 17.80(03) | 16.64(03) | 16.15(03) | 15.81(04) | OIG | |||
| 15/09/99 | 51436.50 | 18.97(09) | 17.87(05) | 16.76(03) | 16.28(03) | 15.85(03) | EF2 | |||
| 18/09/99 | 51439.77 | 19.28(09) | 18.14(05) | 16.91(03) | 16.41(03) | 15.95(03) | EF2 | |||
| 20/09/99 | 51441.58 | 15.38(15) | 15.16(10) | 14.92(30) | ARN | |||||
| 03/10/99 | 51455.48 | 15.78(10) | 15.50(10) | 15.31(20) | ARN | |||||
| 07/10/99 | 51459.47 | 19.99(09) | 19.01(06) | 17.81(05) | 17.09(05) | 16.63(05) | OIG | |||
| 02/11/99 | 51485.35 | 20.14(15) | 19.59(06) | 18.32(06) | 17.56(06) | 16.88(06) | OIG | |||
| 03/11/99 | 51485.58 | 19.53(05) | 18.32(03) | 17.57(05) | DF | |||||
| 04/11/99 | 51486.52 | 19.47(06) | 18.30(03) | 17.58(04) | 16.95(05) | DF | ||||
| 10/12/99 | 51523.33 | 20.28(10) | 19.89(08) | 18.82(07) | 18.02(07) | 17.30(07) | OIG | |||
| 27/12/99 | 51540.32 | 19.94(08) | 19.11(07) | 18.20(07) | 17.59(07) | OIG | ||||
| 27/12/99 | 51540.37 | 17.93(20) | 17.46(25) | 17.64(30) | ARN | |||||
| 28/06/00 | 51723.69 | 22.57(35) | 20.78(20) | Dol | ||||||
| 31/08/00 | 51788.60 | 21.93(50) | EF2 |
∗ 2400000+
DF = ESO/Danish 1.5m telescope + DFOSC
OIG = Telescopio Nazionale Galileo + OIG CCD Camera
EF2 = ESO 3.6m telescope + EFOSC2
ARN = Telescopio Nazionale Galileo + ARNICA IR Camera
Dol = Telescopio Nazionale Galileo + Dolores
The journal of the spectroscopic observations (Tab. 3) gives for each spectrum the date of observation (col.1), the phase relative to the adopted maximum (cfr. Sect. 3; col.2), the instrument (col.3), the exposure time (col.4), the wavelength range (col.5) and the resolution derived from the average FWHM of the night-sky lines (col.6). In order to improve the signal-to-noise ratio, the average of the two spectra taken on 3 and 4 September 1999 is shown in Fig. 6, after checking that there was negligible evolution. In some spectra the telluric absorptions have not been removed because of the lack of suitable standard stars with sufficient signal–to-noise ratio. In other cases, it has been impossible to remove the contamination by the underlying HII region whose lines can be either under– (e.g. day +370) or over–subtracted (day +0.8). The absolute flux calibration was verified against the B, V and R photometry. In case of disagreement, the spectra were corrected by applying a constant factor. In fact the slit was normally aligned along the parallactic angle, in order to minimize atmospheric differential light losses (Filippenko, 1982).
3 Photometry
The UBVRIJHK′ light curves of SN 1999dn are shown in Fig. 2. The figure includes also the R-band data from Fig. 27 of Matheson et al. (2001) (shifted by 15.85 mag to match our observations), the late time observations of Van Dyk et al. (2003) and the pre-discovery limit by Qiu et al. (1999a). Only in the R band the light curve has been well monitored before and around maximum. A low order polynomial fit of all points around the peak provides JD (30 Aug. 1999) at R mag, in good agreement with the estimate by Matheson et al. (2001) (31 Aug. 1999). In the other bands the observations started a few days later and the uncertainties on the epochs of maxima are larger (cfr. Tab. 4). Following common convention we adopt the epoch of B maximum (JD 2451418.0) as reference which is 3.5 days before the reference epoch used by Matheson et al. (2001) and, later, by Branch et al. (2002), Ketchum, Baron, & Branch (2008) and James & Baron (2010).
The peak of the light curve is asymmetric with a steep rise to maximum followed by a slow decline for about 10 days and a faster decrease afterwards. The contrast between maximum and inflection point as well as the width of the maximum light seems to be color dependent, with shorter wavelengths having narrower peaks and larger magnitude differences. A color dependence is visible also in the decline rate during the late radioactive tail, longer wavelengths having steeper slopes (cfr. Tab. 4). Only three epochs of NIR photometry are available: two during the early post peak decline and one in the radioactive tail. Though scanty the NIR photometry has been very useful for the construction of the bolometric flux (Sect.3.2).
| Date | phase∗ | inst.∗∗ | exp. | range | resol. |
|---|---|---|---|---|---|
| (days) | (min) | (Å) | (Å) | ||
| 25/08/99 | –2.3 | DF | 45 | 3600-9000 | 9 |
| 28/08/99 | +0.8 | DF | 45 | 3500-9000 | 9 |
| 03/09/99 | +6.8 | DF | 45 | 3500-9000 | 9 |
| 09/09/99 | +12.5 | WHT | 45 | 3200-7550 | 3.5 |
| 14/09/99 | +17.5 | EK | 30 | 3470-7470 | 18 |
| 14/09/99 | +17.8 | EF2 | 15 | 3400-7450 | 14 |
| 3/11/99 | +67.6 | DF | 120 | 3500-9000 | 10 |
| 4/11/99 | +68.6 | DF | 120 | 3500-9000 | 10 |
| 31/08/00 | +370.7 | EF2 | 60 | 6000-10250 | 12 |
∗relative to the estimated epoch of B maximum (JD=2451418).
See note to Table 2 for coding, plus WHT = WHT 4.2m telescope + ISIS and EK = Asiago 1.8m telescope + AFOSC.
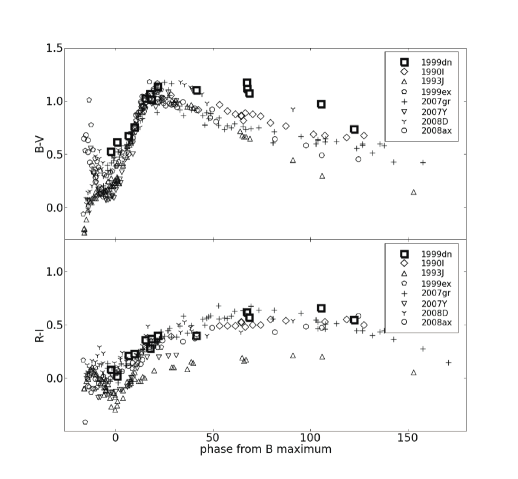
A comparison of the colour evolutions of SN 1999dn with several other SNIb/c is illustrated in Fig. 3. All objects have been dereddened according to values reported in Tab 5. An overall similarity is found among all objects of this variegated class but in the pre-maximum phase. At maximum light the B–V colors are between +0.1 to +0.6 mag and become redder afterward, reaching a maximum value (0.9 to 1.2 mag) at about 20d because of the cooling due to expansion. Thereafter the B–V colors slowly turn bluer due to the progressive increase of the emission line strengths. A good coverage before maximum is available only for the helium rich SNe 1993J, 1999ex, 2008D and 2008ax, which show very different behaviors. Whereas the blue-band light curves of the type IIb SN 1993J showed an early peak attributed to the emergence of the shock breakout, SN 2008ax, the other SNIIb of the sample, showed evidence of its emergence only in the very early UV light curve (Roming et al., 2009), but not in the optical (Pastorello et al., 2008; Taubenberger et al., 2010) and thus the color curve had an opposite behavior, starting red and turning bluer. Already one week before maximum the B–V curves of both objects reach similar values (B–V mag) and evolve similarly afterwards. The pre-maximum difference may be attributed to the fact that SN 2008ax had a more compact progenitor and a lower density wind than SN 1993J (, 2010). An early peak in the blue light curves is also visible in SN 2008D and possibly in SN 1999ex. Indeed both objects show early B–V colors comparable to SN 1993J. However, the blue color peak is very short in SN 1999ex and the evolution extremely fast, with the B–V color reddening by over 1 mag in only 3 days and resembling the general trend described for SN 2008ax thereafter. The behavior of SN 1999ex leaves room for the presence of early, short shock breakout signatures also in other objects.
The colors of SN 1999dn are available only from around maximum, but the spectral evolution in the week before (cfr. Sect. 4) indicates that the SED has become bluer and bluer from day –6 to maximin light, which suggests a color evolution for SN 1999dn more similar to SNe 1999ex and 2008ax than to SN 1993J. After reaching a maximum value of B–V similar to all other SNIb/c, SN 1999dn remained unusually red up to over 100 days. The adoption of an higher extinction correction might reduce the difference (cfr. Sect. 3.1).
The R–I color evolutions of SE–SNe are smoother and remain confined between mag at maximum and mag later on. All objects show similar evolution and SN 1999dn is in the troop. The outlier here is SN 1993J, which remains bluer at all epochs.

| position (2000.0)a | 23h36m14.81s | +02o09m08s.4 |
|---|---|---|
| parent galaxy | NGC 7714, SBb pecb with starburstc | |
| offset wrt nucleus | 9.9E | 9.4S |
| adopted distance modulus | ||
| SN heliocentric velocity | km s-1 | |
| adopted reddening | EMW(B–V | Etot(B–V |
| peak time | peak observed | peak absolute | |
|---|---|---|---|
| (JD–2451000) | magnitude | magnitude | |
| U | |||
| B | |||
| V | |||
| R | |||
| I | |||
| uvoir | L erg s-1 | ||
| rise to max | days | ||
| explosion day | Aug. 1999 |
| late time decline | interval | late time decline | interval | |
| mag (100d)-1 | days | mag (100d)-1 | days | |
| U | 0.37 | 67 –105 | ||
| B | 0.81 | 67–122 | ||
| V | 1.79 | 67–306 | 1.43 | 67–122 |
| R | 1.44 | 67–370 | 1.17 | 67–122f |
| I | 1.64 | 67–515 | 1.19 | 67–122 |
| uvoir | 1.49 | 67–122 |
| M(56Ni) | 0.11 M⊙ |
|---|---|
| M(ejecta) | 4–6 M⊙ |
| explosion energy | 5.0–7.5 erg |
3.1 Reddening and absolute magnitudes
The interstellar NaID lines arising both from our and the parent galaxy are well seen in the low-resolution spectra at about 5893 and 5945 Å, respectively. Therefore the reddening of SN 1999dn cannot be neglected. Schlegel et al. (1998) give a galactic reddening E mag in the direction to NGC 7714. We have measured the EWs of the NaID components in the spectra of SN 1999dn on the spectrum of highest signal–to–noise and resolution (WHT on 9 Sept., res. 3.5 Å) and found an EWMW(NaID) Å and EWN7714(NaID) Å. These values are in good agreement with the average of EW measurements performed on all other available spectra with no evidence of significant time evolution. Assuming that the gas/dust properties in NGC 7714 and the Galaxy are the same, we estimate a total redening E mag. A similar value E mag is obtained by using the average relation between E(B–V) and EW (Turatto, Benetti, & Cappellaro, 2003). Finally, the match of the color curves of SN 1999dn to those other SE SNe (cfr. Sect. 3) suggests a consistent, though formally slightly higher reddening, E(B–V). Throughout this paper we adopt for SN 1999dn a total reddening E mag (A mag).
Since there is no direct measurements of the distance to NGC 7714, we use the Hubble’s law. From the wavelength of the interstellar NaID absorption features we derive a recession velocity of km s-1, which is consistent with the heliocentric radial velocity reported by LEDA111http://leda.univ-lyon1.fr ( km s-1). LEDA provides also a velocity corrected for the Local Group infall into the Virgo cluster km s-1. Adopting H km s-1Mpc-1, we derive a distance modulus mag which is used throughout this paper222A similar value () is obtained adopting the distance relative to the Virgo cluster in the 220 model (Kraan-Korteweg, 1995) with D(Virgo)=15.3 Mpc (Freedman et al., 2001)..
Adopting the above mentioned values for extinction and distance, we obtain the following absolute magnitudes at maximum , , , and , where in the computation of the errors we adopted an uncertainty of km s-1 on the Hubble distance modulus due to possible peculiar motion.
We note that, after rescaling to a common distance scale, our determination of is 0.5 mag brighter than that derived by Richardson, Branch, & Baron (2006), but in good agreement with the mean value of given by Li et al. (2010) for a sample of six SNIb, SN 1999dn included. In comparison to the subsamples studied in Li et al., SN 1999dn remains about 0.80 mag brighter than their unweighted mean for the SE SNe (SNIc+Ib+IIb).
| SN | Host Galaxy | SN type | Etot(B–V) | (m-M) | main references |
|---|---|---|---|---|---|
| 1999dn | NGC 7714 | Ib | 0.10 | 32.95 | Sect. 3.1 of this paper |
| 1990I | NGC 4650A | Ib | 0.16 | 32.90 | Elmhamdi et al. (2004) |
| 1993J | NGC 3031 | IIb | 0.30 | 27.80 | Barbon et al. (1995); Richmond et al. (1996b) |
| 1994I | NGC 5194 | Ic | 0.45 | 29.75 | Richmond et al. (1996a); Dessart et al. (2008) |
| 1999ex | IC 5179 | Ib | 0.28 | 33.19 | Stritzinger et al. (2002) |
| 2004aw | NGC 3997 | Ic | 0.37 | 34.17 | Taubenberger et al. (2006) |
| 2005bf | MCG +00-27-5 | Ib/c | 0.05 | 34.46 | Folatelli et al. (2006) |
| 2007Y | NGC 1187 | Ib | 0.11 | 31.13 | LEDA, Stritzinger et al. (2009) |
| 2007gr | NGC 1058 | Ic | 0.09 | 29.84 | Valenti et al. (2008a); Hunter et al. (2009) |
| 2008D | NGC 2770 | Ib | 0.66 | 32.29 | Mazzali et al. (2008); Modjaz et al. (2009) |
| 2008ax | NGC 4490 | IIb | 0.40 | 29.92 | Pastorello et al. (2008); Taubenberger et al. (2010) |
3.2 Bolometric light curve
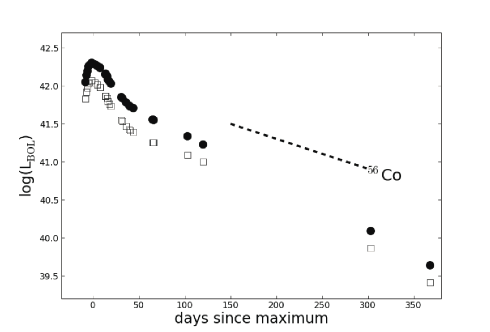
With the available photometry it has been possible to build the UBVRIJHK′ bolometric light curve up to 1yr (Fig. 4). When magnitudes in a bandpass were not available in a given night, the values were linearly interpolated. The light curves with a short temporal extension, e.g. those in the NIR, were extrapolated assuming constant colors. For this reason the bolometric flux during the rising branch and those at the latest epochs are based mainly on R band observations and should be regarded as uncertain. The photometry was corrected for extinction using R. At the effective wavelengths of each filter monochromatic fluxes were computed; these were then integrated from the U to K′ bands using the trapezoid approximation, and converted to luminosity. The peak of the bolometric light curve is reached between the V and the R maxima on JD at a luminosity L erg s-1.
The contribution of the NIR bands is substantial at all the epochs in which NIR data are available (LJHK/L 0.5, 0.5 and 0.4 at day 20, 40 and 121, respectively). This is more than a factor two larger than the value derived for SNIb 2007Y (Stritzinger et al., 2009) and for SN 2008D (Modjaz et al., 2009), but similar to values derived for SNIIb 2008ax (Taubenberger et al., 2010). In the photospheric phase, the optical+NIR SED deduced from SN 1999dn photometry is consistent with a blackbody energy distribution with temperatures as derived from optical spectra (cfr. Sect. 4). The decline rate between 67d and 122d is 1.49 mag (100d)-1, close to the average value of type Ia SNe. This value is significantly larger than the decline rate of 0.98 mag (100d)-1 predicted if all the energy from the decay of 56Co into 56Fe was fully thermalized. No significant slope variation is observed up to day 370 ( [67d-305d]).
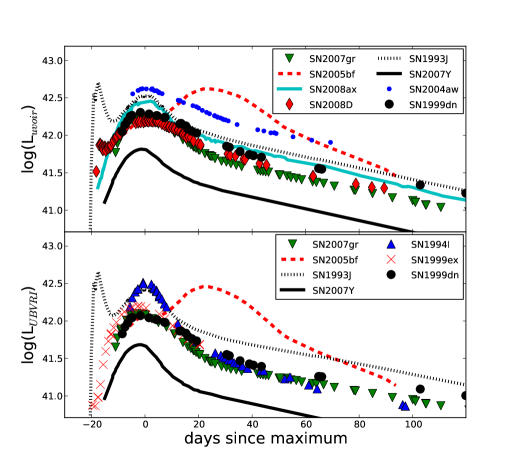
In Fig. 5 we compare the bolometric light curve of SN 1999dn with those of other SE SNe.
Unfortunately not all have coverage from optical to NIR
wavelengths. The comparison has been done both for the extended (UBVRIJHK′, top panel)
and the optical-only (UBVRI, bottom panel) bolometric curves.
The rise to maximum can be very different.
The type IIb SN 1993J shows an early bright spike about 20d before
a broader secondary maximum. For the other SNIb caught early-on, SN 1999ex (bottom panel), the bolometric light curve shows just an hint of the shock breakout.
For the peculiar SN 2005bf a slow rise to a first maximum
is observed followed about 25d later by a second brighter maximum.
The type Ib SN 2007Y and the type Ic SNe 1994I, 2004aw and 2007gr were not detected sufficiently early after the explosion and do not show any feature in the rising branch.
The first reliable photometry of SN 1999dn has been obtained 6 days before B maximum (8.5d before R maximum), while the available pre-discovery limit does not put stringent constraints on the date of explosion. The direct comparison with other SNIb/c suggests a rise time (relative to B maximum) similar to SN 2007gr, i.e. days (Hunter et al., 2009).
The contribution of the JHK′ bands to the bolometric flux of SN 1999dn stands out: while in the UBVRI domain it has almost the same luminosity as the type Ic SN 2007gr, in the it outpasses it by about 0.12 dex.
The asymmetric peak of SN 1999dn, with a relatively fast rise and slow decline, reminds of the behavior of SN 2007gr, but with even slower decline. After maximum the bolometric light curve remains relatively broad and closely resembles in shape that of SN 2004aw, but remains about 0.3 dex fainter at all epochs.
This simple comparison indicates that adopting the Arnett model (Arnett, 1982) at the early times, when the diffusion approximation is valid, the amount of 56Ni synthesized in the explosion of SN 1999dn is between 0.10 and 0.15 M⊙ (MNi(2007gr)=0.076 M⊙, Hunter et al. (2009); MNi(2004aw)=0.30 M⊙, Taubenberger et al. (2006)).
Broad light curves are indicative of large diffusion time and hence of
either a large ejected mass or a small kinetic energy. The comparison of the expansion velocity of SN 1999dn (cfr. Sec. 4.1) with other SE SNe suggests that the long diffusion time is due to a
large ejecta mass of SN 1999dn, much larger than that of the narrow-peak SN 1994I (cfr. Fig. 5).
A more detailed discussion of the explosion parameters is given in Sect. 5.
4 Spectroscopy
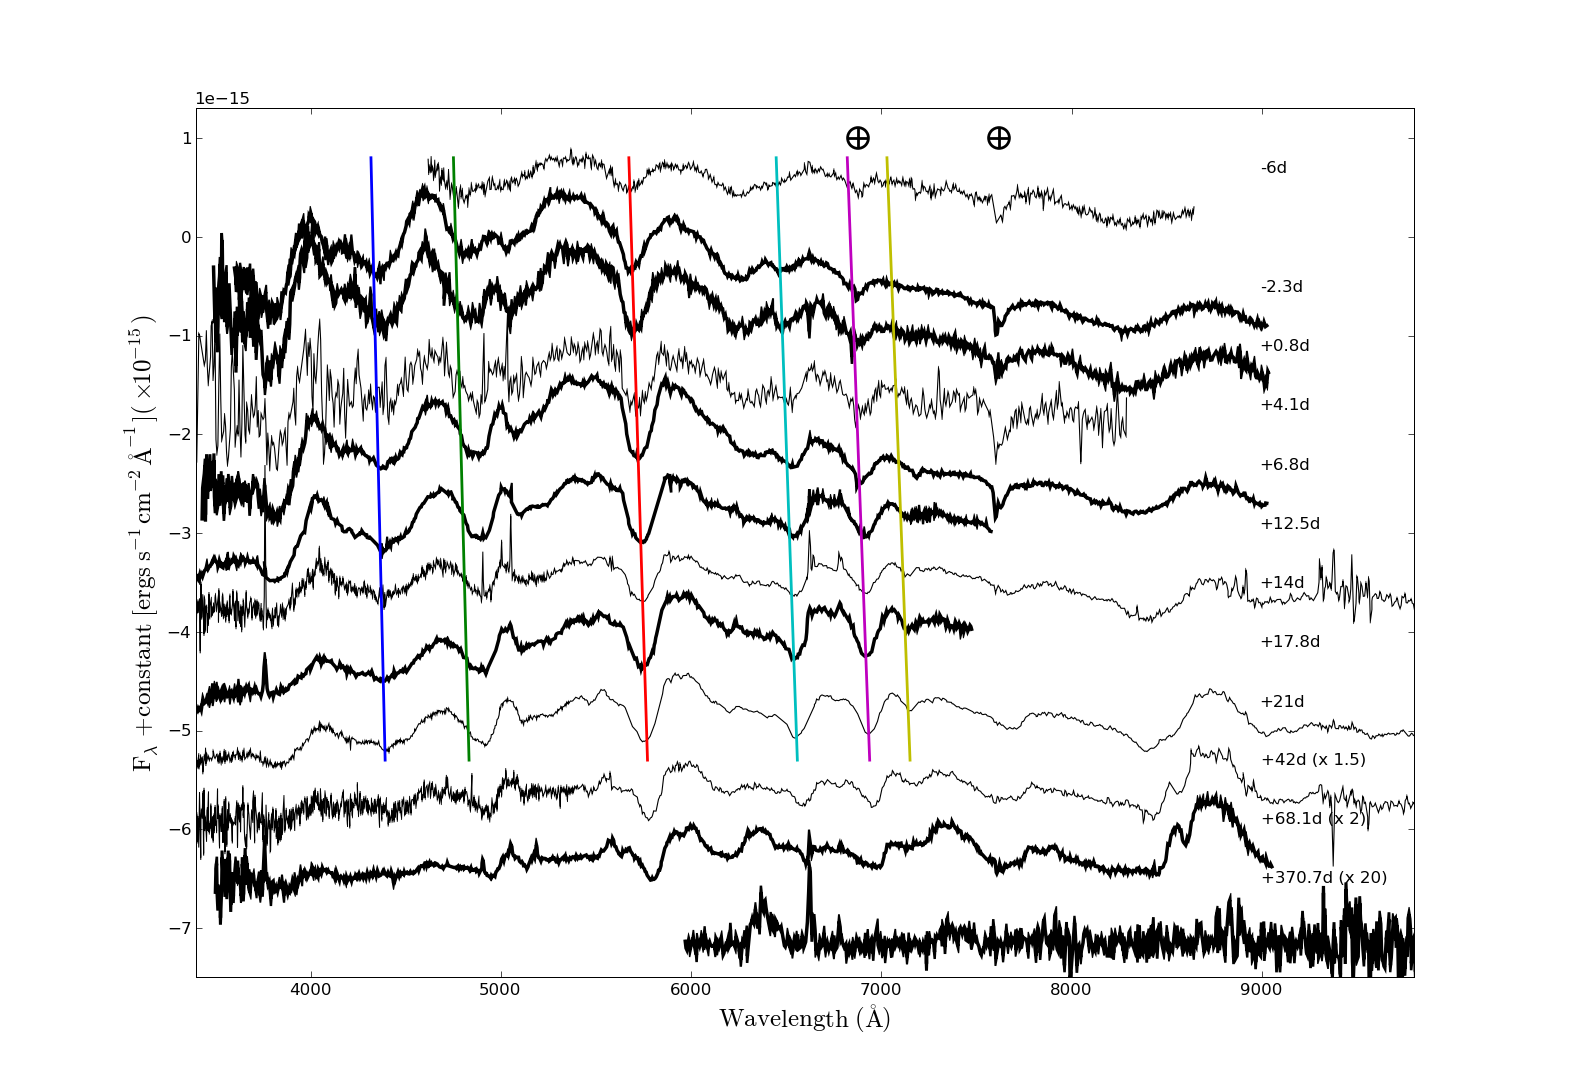
The entire spectroscopic evolution of SN 1999dn from about 1 week before maximum to over 1yr is illustrated in Fig. 6, thanks to the spectra listed in Tab. 3 and those published by Deng et al. (2000) and Matheson et al. (2001). The SN evolution is therefore well sampled at all crucial phases. We stress again that the phases adopted here, are relative to the date of B maximum (JD 2451418.0) and differ from those used in previous papers (cfr. Sect. 3).
The first spectrum (–6d, Aug.21) has been subject to deep scrutiny. Deng et al. (2000) have modeled it with SYNOW using a black-body temperature Tbb=7500 K and photospheric velocity vph=16000 km s-1. Besides the broad absorptions at 4750 and 4950 Å (restframe) due to FeII, and at about 8200 Å due to CaII IR, the spectrum is dominated by the HeI and which contribute to the strong 5620 Å and 6820 Å features. The broad absorption at about 6200 Å has attracted the attention of Deng et al. and other modelers and will be extensively discussed in Sect. 4.1. This spectrum has been modeled also by Branch et al. (2002) who used SYNOW with line optical depths varying as and instead of ( km s-1) as in Deng et al. (2000). The spectrum was well reproduced with Tbb K and vphkm s-1and the same contributing ions. Ketchum, Baron, & Branch (2008) modeled this and the other spectra around maximum with their non-LTE code PHOENIX trying both a standard solar and a three times higher metallicity. Although they adopted a smaller extinction (E(B–V)=0.052 mag) and later explosion epoch (12 days before Aug.31) with respect to the values that we now consider more realistic (cfr. Tab. 4), their fit is good also for the non-thermal HeI lines. The other features were identified with CaII, FeII and OI. Similar results were obtained also by James & Baron (2010), who correct the spectrum only for galactic extinction (Baron, private communication). Their model parameters (Tmod=6000 K and vkm s-1) are slightly smaller than the values (Tbb K and vphkm s-1) we derive by fitting the de-reddened spectrum. Note that our Tbb is a color temperature, different from Tmod which is much closer to an effective temperature, while the afore mentioned SYNOW Tbb has little physical significance (Deng et al., 2000).
Our new observations provide a good coverage of the epoch of maximum with spectra on days –2.3 and +0.8. At this phase the object has become bluer and hotter, reaching Tbb and 7800 K, respectively. The line contrast is now higher with more pronounced absorption troughs and broad emissions. The HeI lines have become stronger so that the line is clearly identified in addition to the and lines. In the blue strong H & K CaII and FeII lines are visible which indicate photospheric expansion velocities vph and 10000 km s-1, respectively.
The next available spectrum on day +4.1, Aug. 31, though quite noisy, has been modeled using both SYNOW (Tbb K and vph km s-1, Deng et al., 2000; vph kms, Branch et al., 2002) and PHOENIX (Ketchum, Baron, & Branch, 2008) giving an effective temperature of 6000–6500 K and vph=10000 km s-1. The features are well fit by the same ions as on day –6 (CaII, FeII, HeI and OI). The model with standard solar metallicity reproduces fairly well also the He lines both in absorption and in emission. Again the best fit temperature by James & Baron (2010) is lower (Tmod=5250 K). Our black–body fit to the dereddened spectrum of day +4.1 provides Tbb K which is lower than the values derived for the two bracketing epochs (Tbb and 7000 K for day +0.8 and 6.8, respectively) possibly because of a poor instrument response calibration. The position of the Fe lines at about 5000 Å corresponds to vph km s-1, in good agreement with the velocities derived in the spectral modeling.
Of much better quality (S/N) is the spectrum obtained on day +6.8. The fit to the SED provides TbbK, and the expansion velocity from the FeII lines decreases to vph km s-1.
In the following week the evolution slows down. Two spectra are available on day +12.5 and +14, the former with an excellent signal–to–noise (S/N) and resolution (3.5 Å), the latter with wider spectral range (Matheson et al., 2001). Our analysis provides a similar temperature, Tbb K in both spectra, but significantly different photospheric velocities (vph and 4900 km s-1, respectively). Both the Galactic NaID lines as well as those originating in the host galaxy are well resolved, as mentioned in Sect. 3.1. HeI is very broad and possibly heavily contaminated by NaID. Also the lines at and clearly stand out, whereas others ( and ) are less pronounced (the former probably blended with MgII). The well developed HeI lines make the spectrum closely resemble that of prototypical Type Ib supernovae. Ketchum, Baron, & Branch (2008) have studied the spectrum of day +14: again the solar metallicity model fits the observations better, though the CaII and HeI absorptions are too strong. TiII starts to contribute significantly to the FeII dominated region below 5000 Å.
Three spectra have been obtained on Sept. 14 (day +17.5 to +17.8) at different telescopes (cfr. Tab. 3 and Deng et al., 2000). The SEDs of our two spectra are similar (Tbb K) but the S/N ratio of that obtained with EFOSC2 (plotted in Fig. 6) is definitely higher. The Deng et al. (2000) spectrum, significantly bluer (Tbb K), has been used in the modeling both by Deng et al. (2000) and Ketchum, Baron, & Branch (2008). Again the standard composition model seems to be preferred though with too strong HeI and CaII absorptions. The index of the density profile was decreased from 13 to 10 to improve the fit.
The subsequent spectra (day +21 and +42, i.e. Sept. 17 and Oct. 8) come from Matheson et al. (2001). At both epochs the main features and the SEDs have not changed significantly with respect to day +18. We measure Tbb K on the dereddened spectrum, in good agreement with the temperature adopted in the modeling (respectively 4800 and 4600 K, Branch et al., 2002; James & Baron, 2010). The measured expansion velocities are vph and 4600 km s-1, respectively. In the latter spectrum one can notice that the CaIR triplet starts to be resolved with an absorption at about 8360 Å, corresponding to a velocity km s-1. As the temperature of the SN has decreased to about 5500K, the region bluer than 5000 Å is largely dominated by TiII lines (Ketchum, Baron, & Branch, 2008). This explains why the high metallicity model fails to reproduce the observations causing too strong absorptions.
The latest spectrum of the photospheric series (day +68) is the average of two spectra taken with the same instrument on two consecutive nights. The HeI lines are still visible as well as the underlying continuum (Tbb K). Nevertheless, the progressive transition to the nebular phase can be recognized. In particular, the broad [OI] 6300,6364 and[CaII] 7291-7323 ([OII] 7320,7330) features start to appear clearly.
The characterizing features of the nebular spectra of SNIb/c are, indeed, [OI] and [CaII] emission lines. These are well developed at the epoch of our last spectroscopic observation (day 371). Once deblended into its two components, the [OI] line has an overall gaussian profile centered slightly redward of the restframe position (6309Å) with FWHM km s-1, though the relatively poor signal–to–noise ratio still allows for the presence of additional structures in the line profile (Taubenberger et al., 2009). In any case there is no evidence for profile distortion or a blueshift due to dust formation as detected in other objects (e.g. SN 1990I, Elmhamdi et al., 2004) in the same [OI] line.
4.1 The expansion velocities and the presence of Hydrogen
Hydrogen lines at early epochs distinguish the spectra of SNIIb from other SE SNe. Actually, faint H lines have been revealed unambiguously in the type Ib SN 2000H and, with lower confidence, in other SNIb (Branch et al., 2002; James & Baron, 2010). These authors concluded that H is present with low optical depths in SNIb in general and that it is located in a detached shell with velocities as high as 11000–13000 km s-1. In this context, some attention has been paid in the previous spectral analyses of SN 1999dn (Deng et al., 2000; Branch et al., 2002; Ketchum, Baron, & Branch, 2008; James & Baron, 2010) to a broad feature present in the spectra around maximum at about 6200 Å.
The feature seen in the first epoch (day –6) was attributed by Deng et al. (2000) to H or CII 6580, arising in a detached layer with velocity v=19000 or 20000 km s-1, respectively. Also Branch et al. (2002) interpreted the feature as due to H from a detached layer of H at 18000 km s-1. The possible alternative identification as SiII, proposed by Woosley & Eastman (1997) for SN 1984L, results in an expansion velocity (7300 km s-1) significantly lower than that of any other ion and is, therefore, considered unlikely. Similar identifications were proposed for the spectra of day +4.1 (H, Branch et al., 2002, possibly blended with CII, Deng et al., 2000) and day +17 and +21 (CII, Deng et al., 2000, or FeII, Branch et al., 2002). The spectra were revisited by Ketchum, Baron, & Branch (2008). They found that at early times, when the 6200 Å feature is strong and broad, an uniform atmosphere of three times solar metallicity, devoid of any H, could provide a plausible explanation, making the feature a blend of FeII lines and SiII 6355. At later times the feature splits into multiple, distinct, weaker features, and solar metallicity fits better. However, they admit that higher metallicity in the outer envelope (as seen in the early time spectra) is difficult to explain, also in the light of our direct determination of a somewhat sub-solar metallicity for the SN environment (c.f.r. Sect 5). The simpler interpretation of the 6200 Å feature, therefore, seems to be the presence of H. The new, specific analysis by James & Baron (2010) confirms this identification and could suggest a H mass of M M⊙ in an outer shell of solar composition above the He core.
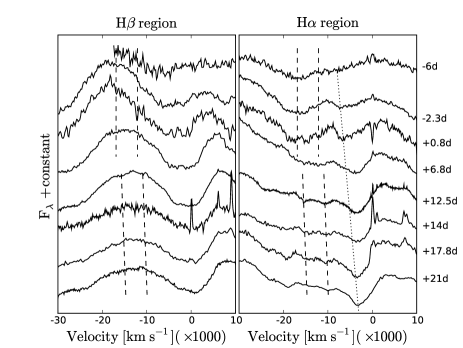
With this work we add new, high signal-to-noise spectra around maximum, and readdress the issue of the possible presence of H. In Fig. 7 we have zoomed into the H (right panel) and H (left panel) regions of the best available spectra. To guide the eye in the right panel we have drawn two vertical dashed lines corresponding to velocities of and km s-1 at the earliest epoch, assuming the H identification. The dotted line at lower velocity indicates the position of HeI (the same as in Fig. 6). The line is tilted to roughly match the velocity decrement. Contrary to HeI, the 6200 Å feature appears at constant velocity ( km s-1) up to maximum light, while a notch at about km s-1 might be present. Should these features be due to single lines and not to the conspiring effect of line blending (e.g. FeII and SiII), the constancy in expansion velocity is an indication of detached layers. Note that the blue wing of the strong HeI line extends outward to about km s-1 on day –6 and km s-1 on day +0.8, close to the estimated velocity of the fastest H layer.
By day +6.8 the broad 6200Å feature has disappeared. Starting on day +12.5 down to day +21 two distinct, resolved features spaced by about the same amount as before are clearly visible. They were noted by Ketchum, Baron, & Branch (2008) who suggested the same possible interpretation with FeII, SiII, CII and TiII. The slower component, if identified with H, shows marginally higher velocity than HeI 6678 and slows down with time at the same rate ( km s-1 in 10d).
To check whether this pair of lines are due to H, we have drawn two lines at corresponding velocities on the left panel of Fig. 7 relative to H. Although the H optical depth is expected to be significantly smaller than that of H, we note that possible signatures of H are recognizable at the expected positions in the spectra of days –2.3 and +12.5, the latter having the best signal–to–noise and spectral resolution. Though not compelling, we consider this an additional evidence that H is present in the spectrum of SN 1999dn both in a detached layer above the photosphere and mixed with HeI.
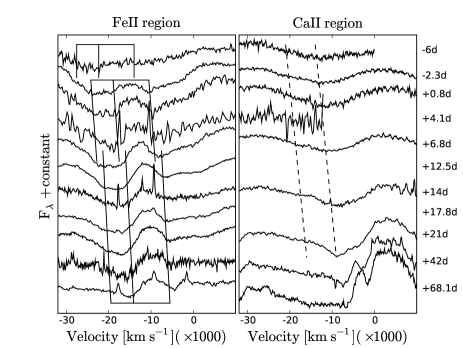
A 6250Å feature was identified as H in the early spectra of the peculiar SN 2005bf at comparable velocity ( km s-1) on the basis of the detection of similar tiny features at the corresponding position of H (Folatelli et al., 2006). Also CaII and FeII lines had components with similar expansion velocity. For this reason we have investigated the possible presence of high velocity features for both these ions also in SN 1999dn. In Figure 8 the spectral regions of interest are plotted in analogy to those in Fig. 7. Broad and shallow FeII lines seem present early on also in SN 1999dn at about km s-1, a velocity exceeding that measured for HeI ( km s-1) and expected for the photosphere on day –6. The FeII lines are easily detected at smaller velocity in the following spectra. Strong, broad CaII IR triplet absorption is detected at a velocity comparable to that of HeI. In the spectra of highest signal-to-noise ratio (day +6.8 and +14) one may also see another component about 5000 km s-1 faster but the first detection of high velocity features of CaII starting at this epoch makes the identification unlikely. We conclude that, in addition to H, there is evidence of weak high-velocity FeII features before maximum.
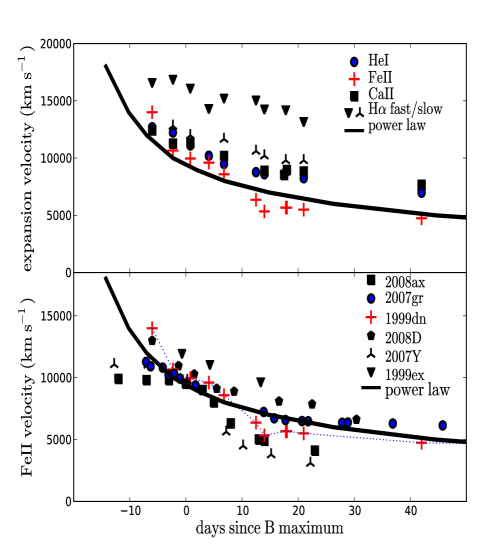
In Fig. 9 (top panel) we summarize the evolution of the line velocities as a function of time. The standard deviation of the velocities derived for HeI lines is km s-1, possibly due to blending of various lines (e.g. NaID for 5876, contamination by telluric features for 7065, or by narrow H emission of the parent galaxy for 6678). We estimate uncertainties of the same order for the possible H lines because of their weakness. The photospheric velocity of SN 1999dn is in agreement with those of other normal SNIb (Branch et al., 2002) and is well fitted by the power-law, with . As for other SNIb, HeI seems to be undetached at the first epoch but detached afterward. The lowest velocity of the HeI layer is measured at about 6000 km s-1. The faster H is detached at all epochs with velocity ranging between km s-1. The slower H component remains about 1500 km s-1 faster than HeI at all epochs. The two H components somehow bracket the H velocities of other SNIb reported in Fig. 23 of Branch et al. (2002).
The bottom panel of Fig. 9 compares the FeII velocity of SN 1999dn with those of other SE SNe. SN 1999dn has an expansion velocity smaller than SN 1999ex, but higher than other objects, e.g. SN 2007Y. Only at early phases the velocity seems to deviate from the power-law fit by Branch et al. (2002). At these early phases the expansion velocity is, in fact, more similar to that shown by the energetic SN 2008D. The overall normal velocity behavior indicates that the broad (slowly evolving) light curve of SN 1999dn after the peak is probably not due to a low expansion velocity but to a larger ejected mass.
4.2 SN 1999dn and other Stripped Envelope SNe
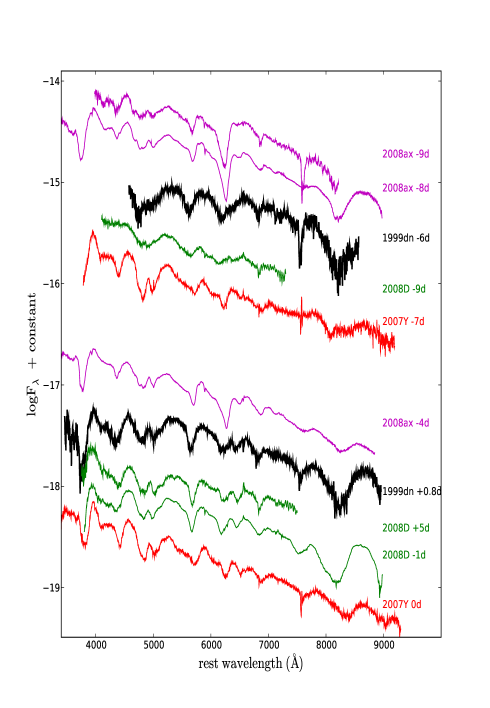
We have compared the spectra of SN 1999dn with those of other SNe by means of GELATO, the spectra comparison tool developed by Harutyunyan et al. (2008) which compares input spectra with those present in our archive. Not unexpectedly, the best match is always with those of other SE SNe. In Fig. 10 we show the comparison with a number of well studied objects during the pre-maximum and maximum phase. At these epochs the objects that match SN 1999dn best are the extensively studied SNIIb SN 2008ax (Pastorello et al., 2008; Chornock et al., 2010; Taubenberger et al., 2010) and the energetic SN 2008D (Mazzali et al., 2008; Modjaz et al., 2009).
For the first spectrum of SN 1999dn (–6d) the closest match is with SN 2008ax on days –9 and –8 (Pastorello et al., 2008; Taubenberger et al., 2010). The strong H, which unequivocally marks the presence of H in SN 2008ax at this epoch, corresponds in position to the 6200 Å feature of SN 1999dn. Note, however, that the spectra of SN 2008ax that best match those of SN 1999dn are at an earlier phase, probably because of a faster expansion velocity of SN 1999dn. At this epoch, the numerical match with SN 2008D is poorer because its expansion velocity at such epoch is even higher (Mazzali et al., 2008). There is also a general resemblance to SN 2007Y, but the expansion velocity of SN 1999dn is significantly larger.
Also at maximum SN 1999dn best matches SN 2008D and SN 2008ax before their B maxima. The SED of SN 1999dn, however, is slightly redder. The 6200 Å feature corresponds to the fast blue wing of the H absorption of SN 2008ax.
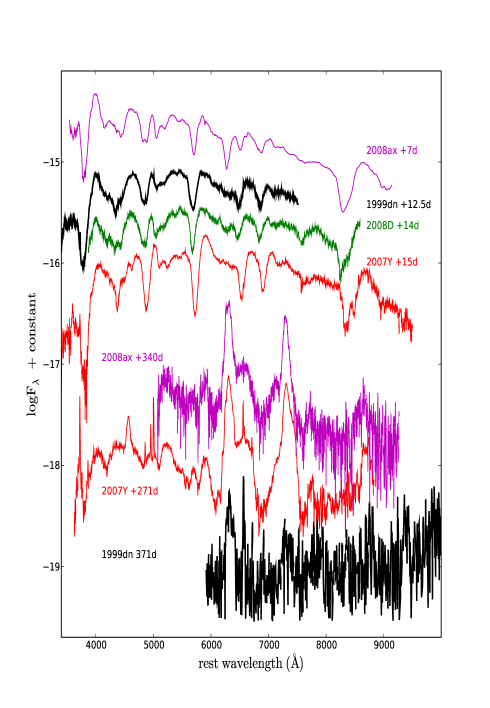
The comparison after maximum is shown in Fig. 11. On day +12.5 (top) the spectra of all objects are very similar. While H in SN 2008ax is still very strong, the 6200 features of both SN 1999dn and SN 2007Y have dimmed and two notches are left where the broad absorption was before (cfr. Fig. 7). Again, due to smaller expansion velocity (cfr. Fig. 9), the absorptions in SN 2007Y are redder than in SN 1999dn.
A late-time (371d) red-grism spectrum has been obtained for SN 1999dn (Fig. 11 bottom). In both SN 2008ax and SN 2007Y, a broad shoulder on the red edge of [OI] , 6364 is clearly visible, which might be interpreted as a sign of interaction of a fast (v km s-1) shell with circumstellar material. However, the late time interaction scenario is not fully consistent and other interpretations have been proposed, though not proved (cfr. Taubenberger et al., 2010). At the same position only unresolved H, [NII] and [SII] lines from an underlying HII region are discernible in SN 1999dn, a sign that there is not (yet) CSM interaction. [OI] , 6364 and [CaII] , 7323 ([OII] , 7330) are clearly visible, with a [CaII]/[OI] flux ratio of .
5 Discussion
SN 1999dn was extensively studied in the last decade but our new data allow a better determination of the main parameters (cfr. Tab. 4). The light curve results to be 0.5 mag brighter (MV) than previously estimated, but still fainter than the average of SNIb/c (MV, H0=72 km s-1Mpc-1, Richardson, Branch, & Baron, 2006). The multicolor observations (Sect. 3) have shown a relatively strong NIR flux. This large NIR flux is intrinsic, since the EW(NaID), the broad band colors and the SED all suggest SN 1999dn to be only mildly reddened (E(B-V), cfr. Sect. 3.1). The NIR accounts for about 50% of the flux during the advance photospheric phase. The bolometric light curve reaches the same luminosity as SNe 2007gr and 1999ex, but is brigther than SN 2007Y, and has a width similar to that of SN 2004aw (cfr. Fig. 5). It is known that the peak luminosity gives hints on the ejected 56Ni mass, while the width carries information on the total mass of the ejecta and kinetic energy. To extract in a self consistent manner information on the ejected mass (Mej), the nickel mass, (M(56Ni)), and the kinetic energy (EK), we have employed a toy model of the bolometric light curve (Valenti et al., 2008b). Our procedure is based on a two-component analytical model to account for the photospheric and nebular phases. During the photospheric phase (t d past explosion) a homologous expansion of the ejecta, spherical symmetry, and a concentration of the radioactive 56Ni exclusively in the core are assumed (Arnett, 1982). At late times (t d past explosion), the model includes the energy contribution from the 56Ni–56Co–56Fe decay, following the works of Sutherland & Wheeler (1984) and Cappellaro et al. (1997). The incomplete trapping of –rays and positrons has been accounted for using the Clocchiatti & Wheeler (1997) prescriptions for both photospheric and nebular phases. The bolometric light curve model suggests a 56Ni mass M(56Ni) M⊙. A comparison with the values from Table 2 of Hunter et al. (2009), obtained with similar methods, shows indeed that M(56Ni) is marginally larger than in SN 2007gr (0.076 M⊙), and SN 2007Y (0.06 M⊙, Stritzinger et al., 2009), but smaller than 2004aw (0.3 M⊙). Using an average opacity of 0.06 g/cm (as in Valenti et al., 2008b) and a scale velocity vsc=v km s-1, we obtain an ejected mass M M⊙ and kinetic energy E erg. Surprisingly, but not totally unexpected because of the broadness of bolometric light curve of SN 1999dn, these values are comparable to those obtained for the energetic SN 2008D associated to an X–ray flash (Mazzali et al., 2008). In fact our toy model makes use of the scale velocity of the explosion (vsc=vph, which are similar for SNe 1999dn and 2008D) without taking into account possible differences in the density profiles.
In the case of SN 1999dn this may cause an over-estimate of the physical parameters, the real values being at the lower boundary of those ranges. A more precise determination should rely on more detailed codes. A comparison between the physical parameters deduced, for a sample of well studied SNIb, with our toy model with those derived by more sophisticated codes will be given in Valenti et al 2010 (in preparation). Anyway, even considering the possibility that some physical values for SN 1999dn are slightly over-estimate, the supernova seems to belong to the group of relatively massive and energetic SNe Ib.
We noticed in Sect. 4.1 that the evolution of the photospheric velocity of SN 1999dn (as well as those of HeI and H) are in general very similar to those of other SNIb which implies, following Branch et al. (2002), comparable density profiles, masses and kinetic energies above the photospheres. As noticed by those authors, the strong similarity does not leave much room for asymmetries in SNIb, which is confirmed by the [OI] line profile of SN 1999dn at late time (Taubenberger et al., 2009). Only the earliest (–6d) measurement of the FeII velocity is significantly larger than the power law fit by Branch et al..
The previously available spectra of SN 1999dn before and after maximum light have been extensively modeled by means of both the highly parametrized SYNOW (Deng et al., 2000; Branch et al., 2002) and the more sophisticated non-LTE PHOENIX codes (Ketchum, Baron, & Branch, 2008; James & Baron, 2010). The latter successfully reproduces all main features of the spectra with a homogeneous stellar atmosphere of H, He, C, N, Ne, Na, Mg, Si, Ca and Fe with the main features identified as HeI, OI, CaII and FeII at all epochs. Also the HeI absorptions were successfully reproduced including ray deposited by the radioactive decay of 56Co.
Our new spectra confirm the presence of evolving features around 6200 Å during the first weeks (Sect. 4). Up to maximum light the region is dominated by a broad and strong feature which, if attributed to H, implies expansion velocities of about 17000 km s-1 (cfr. Sect. 4.1 and Fig. 7). At subsequent epochs (days +6.8 to +21) our new, superior quality spectra confirm the presence of minor features (cfr. Ketchum, Baron, & Branch, 2008) in the same region. Whether these components are due to H is not clear but the detection in the highest signal–to–noise spectra of weak absorptions at the same velocities with respect to H seems to support the existence of two H layers, one detached at velocities v to km s-1, comparable to that of H in other SNIb (Branch et al., 2002), the other only marginally faster than HeI ( km s-1, cfr. Fig. 9) and possibly located in the outer He layer. The high FeII velocity at the earliest epoch (–6d) seems compatible with the existence of high–velocity H–rich layers.
SN 2007Y and other SNIIb show evidence of interaction of the fast expanding H-rich layer with the CSM (Fig. 11, bottom) about one year past maximum light. This is not the case in SN 1999dn, indicating that no major mass loss episodes have occurred in the last decade before the explosion (assuming wind velocities km s-1, typical of WR progenitors). There is also no evidence of dust formation at any time, neither from photometric (light and color curves) nor from spectroscopic observations (line positions and shapes).
On the spectrum obtained at WHT on Sept. 9, 1999, we have measured the O3N2 index (Pettini & Pagel, 2004) of the region adjacent to SN 1999dn along the slit of the spectrograph, corresponding to projected linear distance of pc at the adopted distance of the SN. Relation (3) of Pettini & Pagel (2004) thus provides an oxygen abundance at the SN location (where the first error is statistical and the second one is is the 95% spread of the calibrating relation), which is in excellent agreement with the estimate of Modjaz et al. (2010) (8.32) and slightly lower than the solar abundance (Asplund et al., 2009) and close to the average metallicity derived for the sites of a sample of fifteen SNIb, which includes also SN 1999dn, studied in Modjaz et al.
A search for the progenitor of SN 1999dn has been carried out on HST archive images (Van Dyk et al., 2003). The progenitor was not detected down to M mag and (U–V) mag (these values do not change significantly with our assumptions on H0 and E(B–V)). Unfortunately this determination does not strongly constraints the nature of the progenitor either as a massive, single WR star (e.g. M M⊙ at Z=0.02, Georgy et al., 2009), or as a star of lower initial mass in an interacting binary system (e.g. M M⊙ at Z=0.02, Yoon, Woosley, & Langer, 2010). However the lack of signatures of dust favors the single, massive star scenario, given the fact that while the radiation field of single WR stars is expected to prevent dust formation in their local environment, while binarity in WR stars seems to provide the necessary physical conditions for it (Crowther, 2007, and references therein).
The moderate metallicity environment (, slightly sub-solar) in which SN 1999dn exploded is not inconsistent with the single scenario. In fact, the binary channel for producing WR stars in WR galaxies (as NGC 7714) is important just at lower () metallicity (e.g. Lopez-Sanchez & Esteban, 2010), while the probability of forming single WR stars increases with the metallicity because it is easier to reach the WR phase due to the metallicity-dependence of the stellar wind (e.g. Lopez-Sanchez & Esteban, 2010, and references therein). The lower mass limit for having a WR progenitor decreases from M⊙ at Z=0.004 to M⊙ at Z=0.02 (Georgy et al., 2009). As a consequence the progenitor of SN 1999dn could be a single WR star having a main sequence mass M⊙.
Also the relatively small flux ratio [CaII]/[OI], known for being constant with time (cfr. the spectra collection by Taubenberger et al., 2009) is consistent with a single massive star scenario. In fact, Fransson & Chevalier (1987, 1989) have shown that this ratio is a diagnostic of the core mass of the progenitor, with higher ratios indicative of smaller cores. The ratios measured for SN 1993J, SN 2007Y and SN 2008ax are 0.6, 1.0 and 0.9, respectively (Stritzinger et al., 2009; Taubenberger et al., 2010). Since the core mass is strongly dependent on the progenitor ZAMS mass, thus we have an indication that the progenitor of SN 1999dn is more massive than the above mentioned SNe.
6 Conclusions
We have presented detailed photometric observations and new spectra of SN 1999dn from before maximum to the nebular phase. These new data turn this object, already considered a prototypical SNIb, into one of the best observed objects of this class.
SN 1999dn was a moderately faint SNIb (M mag) which produced 0.11 M⊙ of 56Ni. With a toy model we have estimated an ejected mass of 4–6 M⊙ with E erg. Due to the rough approximation of the model, these values may be slightly over-estimated. Our analysis on SN 1999dn confirms that, contrary to early belief, a prototypical SN Ib may produce several foe of kinetic energy and eject several solar masses.
Overall the main parameters of the explosion are comparable to those of the type Ic SN 2004aw and the massive type Ib SN 2008D, much higher than those of the low-energy and low-ejected-mass SN 2007Y. Higher explosion energy and ejected mass, along with the small flux ratio [CaII]/[OI], the lack of signatures of dust formation and the relatively high-metallicity environment point toward a single massive progenitor (M M⊙). On the other hand, none of these evidences completely rule out the scenario of a less massive star in a binary system.
The spectra of SN 1999dn at various epochs are similar to those of other SE SNe that show clear presence of H at early (type IIb SNe 1993J and 2008ax, type Ib SNe 2000H, 2007Y and 1999ex) or late (SNe 1993J, 2008ax, 2007Y) epochs. Such similarities, coupled to the fact that accurate spectral modeling (e.g. Ketchum, Baron, & Branch, 2008) did not find other satisfactory explanations for the puzzling 6200Å feature, lead us to support its identification with detached H. We conclude, therefore, that it is likely that residual H can be recognized in the spectra of most SNIb if observed sufficiently early on.
Acknowledgments
The SN 1999dn spectra published by Deng et al. (2000) and Matheson et al. (2001) have been retrived from the Suspect database (
http://bruford.nhn.ou.edu/~suspect/index1.html
). We acknowledge the usage of the HyperLeda database (
http://leda.univ-lyon1.fr
)
We thank the referee, Chornock, R., for his helpful comments. SB, MT, EC and FB are partially supported by the PRIN-INAF 2009 with the project ”Supernovae Variety and Nucleosynthesis Yields”.
References
- Anderson & Jones (2008) Anderson, J.P., James, P.A. 2008, MNRAS, 390, 1527
- Arnett (1982) Arnett W.D., 1982, ApJ, 253, 785
- Asplund et al. (2009) Asplund M., Grevesse N., Sauval A. J., Scott P., 2009, ARA&A, 47, 481
- Ayani et al. (1999) Ayani, K., Furusho, R., Kawakita, H., Fujii, M., Yamaoka, H., 1999, IAUC 7244, 1
- Barbon et al. (1995) Barbon R., Benetti S., Cappellaro E., Patat F., Turatto M., Iijima T., 1995, A&AS, 110, 513
- Branch et al. (2002) Branch D., et al., 2002, ApJ, 566, 1005
- Cappellaro et al. (1997) Cappellaro E., Mazzali P. A., Benetti S., Danziger I. J., Turatto M., della Valle M., Patat F., 1997, A&A, 328, 203
- (8) Chevalier, R. A., & Soderberg, A. M. 2010, ApJL, 711, L40
- Chornock et al. (2010) Chornock R., et al., 2010, arXiv:1001.2775
- Clocchiatti et al. (1996) Clocchiatti A., Wheeler J. C., Brotherton M. S., Cochran A. L., Wills D., Barker E. S., Turatto M., 1996, ApJ, 462, 462
- Clocchiatti & Wheeler (1997) Clocchiatti, A., Wheeler, J.C. 1997, ApJ, 491, 375
- Crowther (2007) Crowther P. A., 2007, ARA&A, 45, 177
- Deng et al. (2000) Deng, J.S., Qiu, Y.L., Hu, J.Y., Hatano, K., Branch, D., 2000, ApJ 540, 452
- Desroches et al. (2007) Desroches, L.B., Wang, X., Ganeshalingam, M., Filippenko, A., 2007, CBET 1001
- Dessart et al. (2008) Dessart L., et al., 2008, ApJ, 675, 644
- Elmhamdi et al. (2004) Elmhamdi A., Danziger I. J., Cappellaro E., Della Valle M., Gouiffes C., Phillips M. M., Turatto M., 2004, A&A, 426, 963
- Filippenko (1982) Filippenko A. V., 1982, PASP, 94, 71
- Filippenko et al. (1995) Filippenko A. V., et al., 1995, ApJ, 450, L11
- Fransson & Chevalier (1989) Fransson C. & Chevalier R., 1989, ApJ, 343, 323
- Fransson & Chevalier (1987) Fransson C. & Chevalier R., 1987, ApJ, 322, 15
- Freedman et al. (2001) Freedman W. L., et al., 2001, ApJ, 553, 47
- Folatelli et al. (2006) Folatelli G., et al., 2006, ApJ, 641, 1039
- Fynbo et al. (2004) Fynbo J.P.U., et al., 2004, ApJ, 609 962
- Galama et al. (1998) Galama T. J., et al., 1998, Nature, 395, 670
- Georgy et al. (2009) Georgy C., Meynet G., Walder R., Folini D., Maeder A., 2009, A&A, 502, 611
- Hakobyan et al. (2008) Hakobyan A. A., Petrosian A. R., McLean B., Kunth D., Allen R. J., Turatto M., Barbon R., 2008, A&A, 488, 523
- Hamuy et al. (2002) Hamuy M., et al., 2002, AJ, 124, 417
- Harutyunyan et al. (2008) Harutyunyan A. H., et al., 2008, A&A, 488, 383
- Heger et al. (2003) Heger A., Fryer C. L., Woosley S. E., Langer N., Hartmann D. H., 2003, ApJ, 591, 288
- Hjorth et al. (2003) Hjorth J., et al., 2003, Nature, 423, 847
- Hunter et al. (2009) Hunter, D. et al, 2009, A&A, 508, 371
- James & Baron (2010) James, S. & Baron, E., 2010, ApJ, 718, 957
- Khandrika & Li (2007) Kandrika, H., Li, W., 2007, CBET 997
- Ketchum, Baron, & Branch (2008) Ketchum W., Baron E., Branch D., 2008, ApJ, 674, 371
- Kraan-Korteweg (1995) Kraan-Korteweg R. C., 1995, yCat, 7098, 0
- Landolt (1992) Landolt, A.U., 1992, AJ 104, 340
- Li et al. (2010) Li, W. et al., 2010, MNRAS submitted, arXiv:1006.4612
- Lopez-Sanchez & Esteban (2010) Lopez-Sanchez A. R., Esteban C., 2010, arXiv:1004.0051
- Malesani et al. (2004) Malesani D., et al., 2004, ApJ, 609, L5
- Matheson et al. (2001) Matheson, T., Filippenko, A.V., Li, W., Leonard, D.C., 2001, ApJ 121, 1648
- Mattila et al. (2002) Mattila S., Meikle P., Walton N., Greimel R., Ryder S., Alard C., Lancon A., 2002, IAUC, 7865, 2
- Mazzali et al. (2008) Mazzali P. A., et al., 2008, Sci, 321, 1185
- Modjaz et al. (2006) Modjaz M., et al., 2006, ApJ, 645, L2
- Modjaz et al. (2009) Modjaz M., et al., 2009, ApJ, 702, 226
- Modjaz et al. (2010) Modjaz M., et al., 2010, ApJL, submitted, arXiv:1007.0661v1
- Pastorello et al. (1999) Pastorello, A., Turatto, M., Rizzi, L., Cappellaro, E., Benetti, S., Patat, F., 1999, IAUC 7245
- Pastorello et al. (2008) Pastorello A., et al., 2008, MNRAS, 389, 955
- Pettini & Pagel (2004) Pettini M., Pagel B. E. J., 2004, MNRAS, 348, L59
- Pian et al. (2006) Pian E., et al., 2006, Nature, 442, 1011
- Qiu et al. (1999a) Qiu, Y.L., Qiao, Q.Y., Hu, J.Y., 1999, IAUC 7241
- Qiu et al. (1999b) Qiu, Y.L., Huang, l., Yao, B., Li, H., 1999, IAUC 7244
- Roming et al. (2009) Roming, P. W. A., et al., 2009, ApJL, 704, L118
- Richardson, Branch, & Baron (2006) Richardson D., Branch D., Baron E., 2006, AJ, 131, 2233
- Richmond et al. (1996a) Richmond M. W., et al., 1996, AJ, 111, 327
- Richmond et al. (1996b) Richmond M. W., Treffers R. R., Filippenko A. V., Paik Y., 1996, AJ, 112, 732
- Schlegel et al. (1998) Schlegel, D.J., Finkbeiner, D.P., Davis, M., 1998, ApJ 500, 525
- Soderberg et al. (2008) Soderberg A. M., et al., 2008, Nature, 453, 469
- Stritzinger et al. (2002) Stritzinger M., et al., 2002, AJ, 124, 2100
- Stritzinger et al. (2009) Stritzinger M., et al., 2009, ApJ, 696, 713
- Skrutskie et al. (2006) Skrutskie M. F., et al., 2006, AJ, 131, 1163
- Sutherland & Wheeler (1984) Sutherland P. G., Wheeler J. C., 1984, ApJ, 280, 282
- Taubenberger et al. (2006) Taubenberger, S., et al., 2006, MNRAS, 371, 1459
- Taubenberger et al. (2009) Taubenberger, S., et al., 2009, MNRAS, 397, 677
- Taubenberger et al. (2010) Taubenberger, S., et al., 2010, MNRAS, submitted
- Turatto et al. (1999) Turatto, M., Rizzi, L., Salvo, M., Cappellaro, E., Benetti, S., Patat, F., 1999, IAUC 7244
- Turatto, Benetti, & Cappellaro (2003) Turatto M., Benetti S., Cappellaro E., 2003, fthp.conf, 200
- Turatto, Benetti, & Pastorello (2007) Turatto M., Benetti S., Pastorello A., 2007, AIPC, 937, 187
- Valenti et al. (2008a) Valenti S., et al., 2008, ApJ, 673, L155
- Valenti et al. (2008b) Valenti S., et al., 2008, MNRAS, 383, 1485
- Valenti et al. (2011) Valenti S., et al., in preparation
- Van Dyk et al. (1999) Van Dyk S. D., Peng C. Y., Barth A. J., Filippenko A. V., 1999, AJ, 118, 2331
- Van Dyk et al. (2003) Van Dyk S. D., Li, W., Filippenko A. V., 2003, PASP, 115, 1
- Weedman et al. (1981) Weedman, D.W., Feldman, F.R., Balzano, V.A., et al., 1981, ApJ 248, 105
- Wheeler & Levreault (1985) Wheeler J. C., Levreault R., 1985, ApJ, 294, L17
- Woosley & Eastman (1997) Woosley S. E., Eastman R. G., 1997, thsu.conf, 821
- Yoon, Woosley, & Langer (2010) Yoon S.-C., Woosley S. E., Langer N., 2010, arXiv:1004.0843