11email: pasquale.panuzzo@cea.fr 22institutetext: INAF - Osservatorio Astronomico di Padova, Vicolo dell’Osservatorio 5, I-35122 Padova, Italy
22email: roberto.rampazzo@oapd.inaf.it, alessandro.bressan@oapd.inaf.it, francesca.annibali@oapd.inaf.it, lucio.buson@oapd.inaf.it, marcel.clemens@oapd.inaf.it 33institutetext: SISSA, Via Beirut 4, I-34014 Trieste, Italy 44institutetext: INAOE, Luis Enrique Erro 1, 72840, Tonantzintla, Puebla, Mexico
44email: ovega@inaoep.mx 55institutetext: STSci, 3700 San Martin Drive Baltimore, MD 21218, USA 66institutetext: Institut für Astronomie der Universität Wien, Türkenschanzstraße 17, A-1180 Wien, Austria
66email: werner.zeilinger@univie.ac.at
Nearby early–type galaxies with ionized gas VI. The Spitzer-IRS view
Abstract
Context. A large fraction of early-type galaxies (ETGs) shows emission lines in their optical spectra, mostly with LINER characteristics. Despite the number of studies, the nature of the ionization mechanisms is still debated. Many ETGs also show several signs of rejuvenation episodes.
Aims. We aim to investigate the ionization mechanisms and the physical processes of a sample of ETGs using mid-infrared spectra.
Methods. We present here low resolution Spitzer-IRS spectra of 40 ETGs, 18 of which from our proposed Cycle 3 observations, selected from a sample of 65 ETGs showing emission lines in their optical spectra. We homogeneously extract the mid-infrared (MIR) spectra, and after the proper subtraction of a “passive” ETG template, we derive the intensity of the ionic and molecular lines and of the polycyclic aromatic hydrocarbon (PAH) emission features. We use MIR diagnostic diagrams to investigate the powering mechanisms of the ionized gas.
Results. The mid-infrared spectra of early-type galaxies show a variety of spectral characteristics. We empirically sub-divide the sample into five classes of spectra with common characteristics. Class-0, accounting for 20% of the sample, are purely passive ETGs with neither emission lines nor PAH features. Class-1 show emission lines but no PAH features, and account for 17.5% of the sample. Class-2, in which 50% of the ETGs are found, as well as having emission lines, show PAH features with unusual ratios, e.g. . Class-3 objects (7.5% of the sample) have emission lines and PAH features with ratios typical of star-forming galaxies. Class-4, containing only 5% of the ETGs, is dominated by a hot dust continuum. The diagnostic diagram [Ne III]15.55m/[Ne II]12.8m vs. [S III]33.48m/[Si II]34.82m, is used to investigate the different mechanisms ionizing the gas. According to the above diagram most of our ETGs contain gas ionized via either AGN-like or shock phenomena, or both.
Conclusions. Most of the spectra in the present sample are classified as LINERs in the optical window. The proposed MIR spectral classes show unambiguously the manifold of the physical processes and ionization mechanisms, from star formation, low level AGN activity, to shocks (H2), present in LINER nuclei.
Key Words.:
Galaxies: elliptical and lenticular, cD – Galaxies: fundamental parameters – Galaxies: evolution – Galaxies: ISM1 Introduction
The view that early-type galaxies (ETGs) are inert stellar systems, essentially devoid of gas and dust, has radically changed over the last 20 years, since the increase in instrumental sensitivity across the electromagnetic spectrum has revealed the presence of a complex interstellar medium (ISM). Nebular emission lines are commonly found in the inner regions of ETGs: in the optical, the documented detection fractions for “unbiased” samples are 55%–60% (Phillips et al. 1986), 72% (ellipticals, E) –85% (lenticulars, S0) (Macchetto et al. 1996), 66% (E) –83% (S0) (Sarzi et al. 2006), and 52% (Yan et al. 2006). By means of optical emission line ratios (e.g. [O III]5007/H and [NII]6584/H, Baldwin et al. 1981), it has also been shown (e.g. Phillips et al. 1986; Goudfrooij et al. 1998; Kewley et al. 2006; Annibali et al. 2010a) that the emission in ETGs is “indistinguishable” from that of low-ionization nuclear emission-line regions (LINERs, Heckman 1980).
Despite the large number of studies, the excitation mechanism in LINERs is still highly debated. Low accretion-rate AGNs are good candidates because they are capable of reproducing the observed optical emission line ratios. This mechanism is supported by the presence of compact X-ray and/or nuclear radio sources (e.g. González-Martín et al. 2009), UV and X-ray variability (e.g. Maoz et al. 2005; Pian et al. 2010), and broad emission lines in the optical spectra, besides the fact that massive black holes (BHs) appear to be a generic component of galaxies with a bulge (e.g. Kormendy et al. 2004). On the other hand, evidence is growing for a deficit of ionizing photons from weak AGNs (e.g. Eracleous et al. 2010), suggesting that more than one excitation mechanism may operate in LINERs. Fast shocks (Koski et al. 1976; Heckman 1980; Dopita et al. 1995; Allen et al. 2008) and photoionization by old post-asymptotic giant branch (PAGB) stars (Trinchieri et al. 1991; Binette et al. 1994; Stasińska et al. 2008) have been proposed as alternative mechanisms. However, we have shown in Annibali et al. (2010a, Paper IV hereafter) that PAGB stars can account for the ionizing photon budget only in the weakest LINERs, or in off-nuclear regions. Indeed, for almost 80% of our sample, either low accretion-rate AGNs and/or fast shocks in a relatively gas poor environment are needed.
The high sensitivity of the Infrared Spectrograph (IRS) on board the Spitzer Space Telescope opened the mid-infrared (MIR) window to the study of ETGs. This spectral window is particularly rich in information on the ISM, excitation mechanisms and galaxy evolution.
Bressan et al. (2006) showed that the MIR spectra of the majority of the massive ETGs in clusters show neither Polycyclic Aromatic Hydrocarbons (PAHs) features nor emission lines, and exhibit only the broad silicate emission feature around 10m arising from circumstellar dust around oxygen-rich AGB stars, superimposed on a stellar photospheric continuum. ETGs with such MIR spectra, with either un-excited, or likely absent (see Clemens et al. 2010), ISM, represent the class of passively evolving ETGs and can be considered the fossil record of galaxy evolution.
Another interesting result from Spitzer is that several ETGs exhibit PAH emission features with “unusual” ratios (e.g. Kaneda et al. 2005, 2008): usually strong emission features at 6.2, 7.7, and 8.6 m are weak in contrast to prominent features at 12.7 and 11.3 m. This may reflect peculiar physical conditions in the ISM, where the PAH emission is not powered by star formation activity.
MIR diagnostic diagrams were presented by Sturm et al. (2006), and Dale et al. (2006, 2009) to study ISM excitation mechanisms. Sturm et al. (2006) compared the MIR properties (SED, PAHs, and emission line ratios) of IR-luminous and IR-faint LINERs. They found that IR-luminous LINERs have MIR SEDs that are similar to those of starburst galaxies, and are situated in different regions of the diagnostic diagrams than IR-faint LINERs. From the presence of strong [O IV]25.9m emission, indicative of highly ionized gas, they suggested a low-luminosity AGN powering source in 90% in both subsamples (see also Rupke et al. 2007). Dale et al. (2006, 2009) devised MIR diagnostic diagrams based on both ionic lines and PAH features, which are particularly suitable in distinguishing between AGN and starburst excitation.
The present paper is part of a series dedicated to the study of nearby ETGs with emission lines, selected from the original optical sample of 65 galaxies in Rampazzo et al. (2005, Paper I hereafter) and Annibali et al. (2006, Paper II hereafter), and it presents the MIR properties of 40 ETGs obtained from low-resolution Spitzer-IRS spectra. We analyze and subdivide spectra into empirical classes, according to their properties, and propose these latter represent possible phases of the nuclear evolution induced by an accretion event.
The paper is organized as follows. Section 2 presents an overview of the sample, summarizing some of the results obtained from the optical. In Sect. 3, we describe the procedure adopted to extract the spectra. In Sect. 4 we analyze the MIR spectra and propose an empirical classification of ETG spectra based on their properties and on the measurement of the ionic/molecular emission lines and PAH features. In Sect. 5, we investigate MIR diagnostic diagrams. In Sect. 6 we discuss how MIR spectral classes can be interpreted as characteristic of different phases in an evolutionary scenario. Our conclusions are presented in Sect. 7.
| ident | RSA | RC3 | Vhel | Age | Z | [/Fe] | ||
|---|---|---|---|---|---|---|---|---|
| km s-1 | Gal. Mpc-3 | km s-1 | Gyr | |||||
| NGC 1052 | E3/S0 | E4 | 1510 | 0.49 | 215 | 14.5 4.2 | 0.032 0.007 | 0.34 0.05 |
| NGC 1209 | E6 | E6: | 2600 | 0.13 | 240 | 4.8 0.9 | 0.051 0.012 | 0.14 0.02 |
| NGC 1297 | S02/3(0) | SAB0 pec: | 1586 | 0.71 | 115 | 15.5 1.2 | 0.012 0.001 | 0.29 0.04 |
| NGC 1366 | E7/S01(7) | S0 sp | 1231 | 0.16 | 120 | 5.9 1.0 | 0.024 0.004 | 0.08 0.03 |
| NGC 1389 | S01(5)/SB01 | SAB(s)0-: | 912 | 1.50 | 139 | 4.5 0.6 | 0.032 0.005 | 0.08 0.02 |
| NGC 1407 | E0/S01(0) | E0 | 1779 | 0.42 | 286 | 8.8 1.5 | 0.033 0.005 | 0.32 0.03 |
| NGC 1426 | E4 | E4 | 1443 | 0.66 | 162 | 9.0 2.5 | 0.024 0.005 | 0.07 0.05 |
| NGC 1453 | E0 | E2 | 3886 | … | 289 | 9.1 2.8 | 0.034 0.009 | 0.22 0.05 |
| NGC 1533 | SB02(2)/SBa | SB0- | 790 | 0.89 | 174 | 11.9 6.9 | 0.023 0.020 | 0.21 0.10 |
| NGC 1553 | S01/2(5)pec | SA(r)0 | 1080 | 0.97 | 180 | 4.8 0.7 | 0.031 0.004 | 0.10 0.02 |
| NGC 2974 | E4 | E4 | 1919 | 0.26 | 220 | 13.9 3.6 | 0.021 0.005 | 0.23 0.06 |
| NGC 3258 | E1 | E1 | 2792 | 0.72 | 271 | 4.5 0.8 | 0.047 0.013 | 0.21 0.03 |
| NGC 3268 | E2 | E2 | 2800 | 0.69 | 227 | 9.8 1.7 | 0.023 0.004 | 0.34 0.04 |
| NGC 3557 | E3 | E3 | 3088 | 0.28 | 265 | 5.8 0.8 | 0.034 0.004 | 0.17 0.02 |
| NGC 3818 | E5 | E5 | 1701 | 0.20 | 191 | 8.8 1.2 | 0.024 0.003 | 0.25 0.03 |
| NGC 3962 | E1 | E1 | 1818 | 0.32 | 225 | 10.0 1.2 | 0.024 0.003 | 0.22 0.03 |
| NGC 4374 | E1 | E1 | 1060 | 3.99 | 282 | 9.8 3.4 | 0.025 0.010 | 0.24 0.08 |
| NGC 4552 | S01(0) | E | 340 | 2.97 | 264 | 6.0 1.4 | 0.043 0.012 | 0.21 0.03 |
| NGC 4636 | E0/S01(6) | E0-1 | 938 | 1.33 | 209 | 13.5 3.6 | 0.023 0.006 | 0.29 0.06 |
| NGC 4696 | (E3) | E+1 pec | 2958 | 0.00 | 254 | 16.0 4.5 | 0.014 0.004 | 0.30 0.10 |
| NGC 4697 | E6 | E6 | 1241 | 0.60 | 174 | 10.0 1.4 | 0.016 0.002 | 0.14 0.04 |
| NGC 5011 | E2 | E1-2 | 3159 | 0.27 | 249 | 7.2 1.9 | 0.025 0.008 | 0.25 0.06 |
| NGC 5044 | E0 | E0 | 2782 | 0.38 | 239 | 14.2 10. | 0.015 0.022 | 0.34 0.17 |
| NGC 5077 | S01/2(4) | E3+ | 2806 | 0.23 | 260 | 15.0 4.6 | 0.024 0.007 | 0.18 0.06 |
| NGC 5090 | E2 | E2 | 3421 | … | 269 | 10.0 1.7 | 0.028 0.005 | 0.26 0.04 |
| NGC 5638 | E1 | E1 | 1676 | 0.79 | 165 | 9.1 2.3 | 0.024 0.008 | 0.24 0.05 |
| NGC 5812 | E0 | E0 | 1970 | 0.19 | 200 | 8.5 2.1 | 0.027 0.008 | 0.22 0.05 |
| NGC 5813 | E1 | E1-2 | 1972 | 0.88 | 239 | 11.7 1.6 | 0.018 0.002 | 0.26 0.04 |
| NGC 5831 | E4 | E3 | 1656 | 0.83 | 164 | 8.8 3.5 | 0.016 0.011 | 0.21 0.09 |
| NGC 5846 | S01(0) | E0+ | 1714 | 0.84 | 250 | 8.4 1.3 | 0.033 0.005 | 0.25 0.03 |
| NGC 5898 | S02/3(0) | E0 | 2122 | 0.23 | 220 | 7.7 1.3 | 0.030 0.004 | 0.10 0.03 |
| NGC 6868 | E3/S02/3(3) | E2 | 2854 | 0.47 | 277 | 9.2 1.8 | 0.033 0.006 | 0.19 0.03 |
| NGC 7079 | SBa | SB(s)0 | 2684 | 0.19 | 155 | 6.7 1.1 | 0.016 0.003 | 0.21 0.05 |
| NGC 7192 | S02(0) | E+: | 2978 | 0.28 | 257 | 5.7 2.0 | 0.039 0.015 | 0.09 0.05 |
| NGC 7332 | S02/3(8) | S0 pec sp | 1172 | 0.12 | 136 | 3.7 0.4 | 0.019 0.002 | 0.10 0.03 |
| IC 1459 | E4 | E | 1802 | 0.28 | 311 | 8.0 2.2 | 0.042 0.009 | 0.25 0.04 |
| IC 2006 | E1 | E | 1382 | 0.12 | 122 | 8.1 1.7 | 0.027 0.005 | 0.12 0.04 |
| IC 3370 | E2 pec | E2+ | 2930 | 0.20 | 202 | 5.6 0.9 | 0.022 0.004 | 0.17 0.04 |
| IC 4296 | E0 | E | 3737 | … | 340 | 5.2 1.0 | 0.044 0.008 | 0.25 0.02 |
| IC 5063 | S03(3)pec/Sa | SA(s)0+: | 3402 | … | 160 | … | … | … |
| Ident | PI | ID | SL1 | SL2 | LL2 | LL1 |
|---|---|---|---|---|---|---|
| [sCycle] | [sCycle] | [sCycle] | [sCycle] | |||
| NGC~1052 | Kaneda | 30483 | 602 | 602 | 302 | 302 |
| NGC~1209 | Rampazzo | 30256 | 606 | 606 | 12016 | 1208 |
| NGC~1297 | Rampazzo | 30256 | 6019 | 6019 | 12014 | 1208 |
| NGC~1366 | Rampazzo | 30256 | 6011 | 6011 | 12014 | 1208 |
| NGC~1389 | Rampazzo | 30256 | 609 | 609 | 12014 | 1208 |
| NGC~1407 | Kaneda | 3619/30483 | 602 | 602 | 302 | 302 |
| NGC~1426 | Rampazzo | 30256 | 6012 | 6012 | 12014 | 1208 |
| NGC~1453 | Bregman | 3535 | 148 | 148 | 306 | … |
| NGC~1533 | Rampazzo | 30256 | 603 | 603 | 1205 | 1203 |
| NGC~1553 | Rampazzo | 30256 | 603 | 603 | 1203 | 1203 |
| NGC~2974 | Kaneda | 3619/30483 | 602 | 602 | 303 | 303 |
| NGC~3258 | Rampazzo | 30256 | 608 | 608 | 12014 | 1208 |
| NGC~3268 | Rampazzo | 30256 | 609 | 609 | 12014 | 1208 |
| NGC~3557 | Kaneda | 30483 | 603 | 603 | 303 | 303 |
| NGC~3818 | Rampazzo | 30256 | 6019 | 6019 | 12014 | 1208 |
| NGC~3962 | Kaneda | 3619/30483 | 602 | 602 | 303 | 303 |
| NGC~4374 | Rieke | 82 | 604 | 604 | 1204 | 1204 |
| NGC~4552 | Bregman | 3535 | 148 | 148 | 306 | … |
| NGC~4636 | Bressan | 3419 | 603 | 603 | 1205 | … |
| NGC~4696 | Kaneda | 3619/30483 | 602 | 602 | 303 | 303 |
| NGC~4697 | Bregman | 3535 | 148 | 148 | 306 | … |
| NGC~5011 | Rampazzo | 30256 | 606 | 606 | 12012 | 1208 |
| NGC~5044 | Rampazzo | 30256 | 19 | 19 | 14 | 8 |
| NGC~5077 | Rampazzo | 30256 | 6012 | 6012 | 12014 | 1208 |
| NGC~5090 | Kaneda | 30483 | 604 | 604 | 303 | 303 |
| NGC~5638 | Bregman | 3535 | 148 | 148 | 306 | … |
| NGC~5812 | Bregman | 3535 | 606 | 606 | 12012 | 1208 |
| NGC~5813 | Bregman | 3535 | 148 | 148 | 306 | … |
| NGC~5831 | Bregman | 3535 | 148 | 148 | 306 | … |
| NGC~5846 | Bregman | 3535 | 148 | 148 | 306 | … |
| NGC~5898 | Rampazzo | 30256 | 6011 | 6011 | 12014 | 1208 |
| NGC~6868 | Rampazzo | 30256 | 606 | 606 | 12013 | 1208 |
| NGC~7079 | Rampazzo | 30256 | 6019 | 6019 | 12014 | 1208 |
| NGC~7192 | Rampazzo | 30256 | 6012 | 6012 | 12014 | 1208 |
| NGC~7332 | Rampazzo | 30256 | 607 | 607 | 12014 | 1208 |
| IC~1459 | Kaneda | 30483 | 603 | 603 | 302 | 302 |
| IC~2006 | Bregman | 3535 | 148 | 148 | 306 | … |
| IC~3370 | Kaneda | 3619/30483 | 602 | 602 | 303 | 303 |
| IC~4296 | Antonucci | 20525 | 2402 | 2402 | 1203 | 1203 |
| IC~5063 | Gorjan | 30572 | 142 | 142 | 301 | 301 |
2 Sample overview
The 40 galaxies presented in this paper are a subset of the original sample of 65 ETGs described in Rampazzo et al. (2005, Paper I) and Annibali et al. (2006, Paper II) (hereafter the R05A06 sample).
The R05A06 sample was selected from a compilation of ETGs exhibiting evidence of an ISM in at least one of the following bands: IRAS 100 m, X-rays, radio, HI and CO (Roberts et al. 1991). All galaxies belong to the Revised Shapley Ames Catalog of Bright Galaxies (RSA) (Sandage et al. 1987) and have recessional velocities lower than 5000 km s-1. For the major fraction of the sample, the X-ray luminosities are fainter than erg s-1 (O’Sullivan et al. 2001), far below the luminosities of powerful AGNs. Because of the selection criteria, the sample may be biased towards the presence of emission lines.
The 40 ETGs in the present sample are partly derived from the Spitzer archive while 18 have been observed as part of our original Cycle 3 proposal. At the time of the proposal submission, 19 ETGs out of 65 were already observed during Cycle 1 and Cycle 2. According to our optical data, some of them are among the more “active” ETGs in the R05+A06 sample. Observing constraints apart, our 18 targets have been selected rejecting ETGs with F60μm/K 0.6, where F60μm is the IRAS flux at 60m and KStot the total 2MASS KS-band magnitude, to include also “less active” ETGs in our MIR analysis.
We detail the main properties of the galaxies in the sample studied here in Table 1. Column (1) gives the galaxy identification; Cols. (2) and (3) provide the galaxy morphological classification according to RSA (Sandage et al. 1987) and RC3 (De Vaucouleurs et al. 1991) respectively: only in a few cases do the two catalogues disagree in the distinction between E and S0 classes; Col. (4) provides the galaxy systemic velocity from NED222NASA/IPAC Extragalactic Database (NED), Vhel, which is lower than 5000 km s-1; Col. (5) provides the richness parameter in (galaxy) per Mpc-3 (Tully 1988). The galaxies of our sample are mainly located in low density environments, with varying from 0.1, characteristic of very isolated galaxies, to 4, which is characteristic of denser galaxy regions in the Virgo cluster. For comparison, in the Tully (1988) catalogue, =1.50 for NGC 1389, which is a Fornax cluster member. In Col. (6) we report the galaxy’s central velocity dispersion, , derived within an aperture of 1/8 of the effective radius, re.
The sample exhibits a large age spread, with SSP-equivalent ages ranging from a few Gyrs to a Hubble time (Annibali et al. 2007, Paper III hereafter). The metallicities and [/Fe] ratios are supersolar. Both the total metallicity and [/Fe] exhibit a positive correlation with the central velocity dispersion, indicating that the chemical enrichment was more efficient and the duration of the star formation shorter in more massive galaxies. Recent star formation episodes appear frequent in the lowest density environments.
A large fraction of the galaxies (50%) exhibit morphological and kinematical peculiarities (see Appendix A in Paper IV). NGC 1553, NGC 2974, NGC 4552, NGC 4696, NGC 5846, NGC 7192, and IC 1459 present shell structures, and NGC 1533, NGC 2974, and IC 5063 exhibit ring/arm-like features, clearly visible in far-UV imaging (Marino et al. 2010, Paper V hereafter). Noteworthy features, as reported in the literature, are provided in the on-line notes in R05A06.
The optical emission line properties of the R05A06 sample were analyzed in Paper IV. The good signal-to-noise ratio of the optical spectra allowed us to analyze the emission lines out to a galactocentric distance of half of the effective radius . Thanks to a proper subtraction of the underlying stellar continuum, we were able to detect even very faint emission lines, concluding that emission is present in 89% of the sample. It is interesting that, despite the sample selection criteria, the incidence of emission is not too far from that in other samples of ETGs, such as that of SAURON (de Zeeuw et al. 2002).
From the nuclear () emission line ratios, the majority of the galaxies are classified as LINERs, while Seyferts and transition/composite (HII-LINERs) objects are present in minor fractions. The nuclear (r) emission can be attributed to photoionization by PAGB stars alone only for 22% of the LINER/composite sample. On the other hand, we cannot exclude an important role of PAGB stellar photoionization at larger radii. For the major fraction of the sample, the nuclear emission is consistent with excitation caused by either a low-accretion rate AGN or fast shocks (200–500 km/s) in a relatively gas poor environment (n cm-3), or both. The derived [S II]6717/6731 ratios are consistent with the low gas densities required by the shock models. The average nebular oxygen abundance is slightly less than solar, and a comparison with the results obtained from Lick indices in Paper III reveals that it is 0.2 dex lower than that of the stars. This suggests an external origin for at least part of the gas.
3
| Galaxy | H2 0–0 S(7) | H2 0–0 S(6) | H2 0–0 S(5) | Ar II] | HPf | H2 0–0 S(4) | Ar III] | H2 0–0 S(3) | S IV] | H2 0–0 S(2) |
| name | 5.51m | 6.11m | 6.91m | 6.99m | 7.46m | 8.03m | 8.99m | 9.66m | 10.51m | 12.28m |
| NGC 1052 | 17.8 3.1 | 8.7 2.7 | 31.5 7.8 | 81.0 2.7 | … | 6.7 2.0 | 17.0 2.9 | 63.3 10.7 | … | 11.2 3.9 |
| NGC 1209 | … | … | … | 4.8 1.0 | … | … | 3.5 0.9 | … | … | 1.4 0.2 |
| NGC 1297 | … | … | 2.8 0.3 | 3.3 0.3 | … | 0.5 0.1 | 1.2 0.3 | 5.1 0.5 | 0.6 0.2 | 2.1 0.1 |
| NGC 1366 | … | … | … | … | … | … | … | … | … | … |
| NGC 1453 | … | 8.5 1.7 | … | 9.0 1.1 | 3.9 0.6 | … | … | 7.1 1.7 | 2.2 1.0 | 1.1 0.2 |
| NGC 1533 | … | … | … | 2.2 0.5 | 3.8 1.2 | … | … | 3.6 0.7 | … | 1.8 0.4 |
| NGC 1553 | … | 1.5 0.3 | 5.9 0.8 | 10.6 1.2 | … | 3.7 0.4 | … | 10.8 2.7 | 3.7 0.8 | 6.2 0.6 |
| NGC 2974 | 9.0 2.5 | 3.8 0.5 | 16.1 0.8 | 18.7 1.4 | … | 4.2 0.3 | … | 30.9 1.7 | 4.1 0.6 | 13.3 0.8 |
| NGC 3258 | … | … | 4.1 0.3 | 8.5 0.5 | … | 2.3 0.1 | 0.8 0.1 | 5.1 0.8 | 0.7 0.2 | 4.2 0.2 |
| NGC 3268 | … | … | 6.1 0.6 | 7.7 0.5 | … | 1.6 0.1 | 0.5 0.1 | 4.5 0.7 | 1.6 0.3 | 2.4 0.2 |
| NGC 3557 | … | … | … | 5.4 0.6 | … | … | … | … | … | … |
| NGC 3962 | … | … | 3.1 0.7 | 8.6 1.0 | … | 4.5 0.4 | 2.5 0.7 | 16.6 1.5 | 2.2 0.6 | 4.8 0.3 |
| NGC 4374 | … | … | 7.4 1.0 | 24.4 2.2 | … | 1.3 0.1 | 6.9 1.5 | 8.3 2.0 | 5.2 1.2 | 3.6 0.5 |
| NGC 4552 | … | … | … | … | … | … | … | 10.4 3.4 | … | 2.8 0.9 |
| NGC 4636 | … | … | … | … | … | … | … | … | … | … |
| NGC 4696 | … | … | 3.5 0.8 | 8.4 0.9 | … | … | … | 6.4 0.9 | … | 1.5 0.1 |
| NGC 4697 | 14.5 3.2 | 8.2 1.1 | 7.4 1.2 | 12.9 1.1 | 0.3 0.1 | 6.4 0.5 | 8.2 1.2 | 8.2 2.0 | … | 1.6 0.1 |
| NGC 5011 | … | … | … | 7.2 1.0 | … | … | 2.1 0.6 | 3.6 0.6 | 1.8 0.5 | … |
| NGC 5044 | 6.4 1.3 | 1.8 0.4 | 14.9 0.9 | 14.6 0.5 | … | 2.9 0.2 | 1.8 0.3 | 23.4 1.1 | 1.2 0.3 | 10.6 0.4 |
| NGC 5077 | … | … | 6.2 1.1 | 9.1 0.8 | 3.5 0.6 | 1.7 0.2 | 2.6 0.6 | 9.4 0.9 | 1.2 0.5 | 2.8 0.4 |
| NGC 5090 | … | 3.5 0.9 | 7.0 0.6 | 9.2 0.8 | … | 1.8 0.2 | 3.0 0.8 | … | 3.1 0.5 | … |
| NGC 5813 | … | 7.5 1.5 | 6.4 0.6 | 15.3 1.3 | … | 2.9 0.4 | 3.6 1.0 | 6.3 0.9 | … | … |
| NGC 5846 | … | … | … | … | … | … | … | 0.5 0.1 | … | 0.6 0.1 |
| NGC 5898 | … | … | … | … | … | … | … | 4.1 1.4 | … | 0.9 0.2 |
| NGC 6868 | 7.0 2.0 | 3.5 1.0 | 20.2 1.4 | 16.3 1.0 | … | 6.0 0.5 | 4.0 0.6 | 23.9 1.5 | 1.4 0.4 | 8.9 0.3 |
| NGC 7079 | … | … | 2.1 0.5 | 1.6 0.3 | … | 1.0 0.1 | 1.4 0.3 | 5.0 0.5 | 0.5 0.1 | 1.2 0.1 |
| NGC 7192 | … | … | … | 2.6 0.8 | … | … | … | … | … | … |
| NGC 7332 | … | … | … | … | … | … | … | 3.9 0.2 | … | … |
| IC 1459 | … | … | 5.0 1.6 | 21.2 1.5 | … | … | … | 10.3 2.4 | … | 2.6 0.5 |
| IC 3370 | … | … | 4.2 0.3 | 4.8 0.4 | … | … | 2.3 0.3 | 3.7 0.4 | … | 2.2 0.2 |
| IC 4296 | … | … | … | … | … | … | … | … | … | 2.2 0.5 |
| IC 5063 | … | … | 133.8 27.7 | 106.5 29.6 | … | … | 176.3 44.8 | 244.9 49.9 | 788.5 123.9 | … |
3
| Galaxy | Ne II] | Ne V] | Ne III] | H2 0–0 S(1) | Fe II] | S III] | Ar III] | Ne V] | O IV]a𝑎aa𝑎aThe two lines are blended in LL1 spectra: the values reported are the result of a line de-blending. | Fe II]a𝑎aa𝑎aThe two lines are blended in LL1 spectra: the values reported are the result of a line de-blending. |
| name | 12.81m | 14.32m | 15.55m | 17.03m | 17.94m | 18.71m | 21.83m | 24.32m | 25.89m | 25.99m |
| NGC 1052 | 250.3 9.7 | … | 180.4 9.3 | 47.5 9.7 | 43.6 12.6 | 71.4 9.4 | … | … | 27.2 3.9 | 50.1 9.3 |
| NGC 1209 | 3.1 0.3 | … | 3.0 0.2 | … | 0.9 0.1 | 1.5 0.1 | … | … | 0.4 0.1 | 2.1 0.2 |
| NGC 1297 | 1.9 0.1 | … | 1.2 0.1 | 7.5 0.2 | … | 0.4 0.1 | … | … | 0.8 0.1 | 1.0 0.1 |
| NGC 1366 | 1.9 0.4 | … | 3.4 0.4 | … | … | 1.7 0.2 | … | … | 0.5 0.1 | 0.5 0.1 |
| NGC 1453 | 3.6 0.4 | … | 7.5 0.5 | 2.2 0.2 | … | 2.3 0.3 | … | … | … | … |
| NGC 1533 | 5.3 0.3 | … | 6.6 0.4 | 4.5 0.2 | … | 5.7 0.4 | 1.6 0.2 | … | 0.6 0.1 | 3.0 0.3 |
| NGC 1553 | 25.1 0.9 | 0.4 0.1 | 22.3 1.6 | 5.7 0.5 | … | 8.5 0.9 | … | … | 1.3 0.2 | 6.1 0.9 |
| NGC 2974 | 35.0 1.0 | … | 27.5 1.2 | 21.8 1.1 | … | 13.3 0.9 | … | 7.3 0.9 | 2.1 0.2 | 10.3 0.6 |
| NGC 3258 | 15.2 0.5 | … | 4.6 0.3 | 6.6 0.3 | 1.2 0.2 | 3.7 0.3 | 2.2 0.5 | … | 1.1 0.2 | 1.8 0.4 |
| NGC 3268 | 10.5 0.4 | … | 5.5 0.2 | 3.0 0.3 | 1.0 0.3 | 3.4 0.2 | 1.3 0.2 | … | 1.0 0.1 | 1.9 0.2 |
| NGC 3557 | 9.6 0.6 | … | 9.0 0.6 | … | 1.4 0.2 | 2.7 0.3 | … | 1.1 0.3 | 0.8 0.1 | 2.8 0.3 |
| NGC 3962 | 14.2 0.4 | 1.0 0.1 | 8.2 0.5 | 4.7 0.2 | 2.8 0.2 | 5.3 0.2 | … | … | 3.1 0.2 | 3.0 0.2 |
| NGC 4374 | 32.9 1.3 | 1.6 0.3 | 26.5 1.1 | 8.3 0.6 | 1.7 0.3 | 14.9 0.5 | 2.5 0.6 | … | 3.5 0.3 | 5.7 0.6 |
| NGC 4552 | 13.5 1.1 | 0.3 0.1 | 10.4 1.1 | … | … | 10.0 1.0 | … | … | … | … |
| NGC 4636 | 12.9 0.8 | … | 15.1 0.8 | 2.4 0.4 | … | 6.1 0.5 | … | … | … | … |
| NGC 4696 | 13.3 0.6 | … | 7.6 0.3 | 6.4 0.3 | … | 1.2 0.1 | … | … | 1.5 0.1 | 2.8 0.2 |
| NGC 4697 | 8.3 0.6 | … | 9.1 1.1 | 4.0 0.5 | … | 5.8 0.8 | … | … | … | … |
| NGC 5011 | 2.8 0.3 | 0.6 0.2 | 3.9 0.3 | … | … | 1.8 0.1 | … | … | 0.9 0.1 | 0.5 0.1 |
| NGC 5044 | 24.3 0.9 | … | 12.2 0.4 | 13.4 0.5 | 0.6 0.1 | 3.1 0.2 | 1.0 0.2 | 1.2 0.2 | 1.5 0.1 | 2.1 0.2 |
| NGC 5077 | 20.6 1.0 | 0.6 0.1 | 17.9 0.8 | 12.7 0.7 | 1.4 0.2 | 6.3 0.4 | 2.9 0.6 | … | 1.7 0.1 | 8.4 0.5 |
| NGC 5090 | 20.7 0.6 | 0.9 0.1 | 9.4 0.6 | 1.6 0.3 | 3.8 0.4 | 4.0 0.3 | 4.1 0.4 | … | 2.7 0.3 | 2.2 0.2 |
| NGC 5813 | 6.3 0.3 | … | 7.0 0.3 | 2.3 0.4 | … | 3.0 0.2 | … | … | … | … |
| NGC 5846 | 12.5 0.9 | … | 9.1 0.6 | 2.0 0.2 | … | 3.8 0.3 | … | … | … | … |
| NGC 5898 | 4.2 0.3 | … | 8.3 0.5 | 3.1 0.3 | … | 3.8 0.4 | … | 1.2 0.4 | 0.5 0.1 | 2.1 0.2 |
| NGC 6868 | 30.0 1.0 | 1.1 0.1 | 23.8 0.8 | 9.6 0.6 | 1.5 0.2 | 7.8 0.4 | 1.3 0.4 | 2.0 0.4 | 4.8 0.3 | 6.6 0.4 |
| NGC 7079 | 2.9 0.2 | … | 2.8 0.2 | 3.7 0.2 | … | 1.7 0.1 | 2.3 0.3 | 1.6 0.2 | 1.3 0.1 | 2.3 0.2 |
| NGC 7192 | 2.4 0.4 | … | 1.0 0.2 | 0.3 0.1 | 0.3 0.1 | 0.3 0.1 | 1.0 0.2 | … | … | 0.6 0.1 |
| NGC 7332 | … | … | 9.0 0.9 | 1.7 0.3 | … | 3.4 0.5 | … | 1.2 0.4 | 3.4 0.2 | 4.7 0.3 |
| IC 1459 | 51.4 2.1 | … | 38.7 1.7 | 1.4 0.3 | 3.6 0.6 | 9.9 0.7 | … | 4.7 1.1 | 2.8 0.3 | 12.3 1.0 |
| IC 3370 | 2.1 0.1 | … | 1.4 0.1 | 4.4 0.2 | … | 0.6 0.1 | … | 0.3 0.1 | 0.7 0.1 | 0.9 0.1 |
| IC 4296 | 24.1 1.4 | 0.5 0.1 | 10.9 0.7 | 1.7 0.5 | 1.4 0.3 | 4.2 0.6 | … | … | 3.9 0.4 | 2.9 0.2 |
| IC 5063 | 238.7 48.2 | 335.2 68.7 | 1103.6 88.9 | 168.1 36.9 | … | 321.7 71.2 | … | 402.8 107.1 | 477.1 44.8 | 673.0 51.4 |
3
| Galaxy | H2 0–0 S(0) | S III] | Si II] | Fe II] | Ne III] |
|---|---|---|---|---|---|
| name | 28.22m | 33.48m | 34.82m | 35.35m | 36.01m |
| NGC 1052 | … | 84.6 13.3 | 207.3 18.4 | … | … |
| NGC 1209 | … | 3.5 0.2 | 11.3 0.3 | … | 1.1 0.1 |
| NGC 1297 | 3.0 0.1 | 1.5 0.1 | 5.5 0.2 | 0.3 0.1 | … |
| NGC 1366 | … | 1.5 0.1 | 2.7 0.2 | 1.5 0.2 | … |
| NGC 1453 | … | … | … | … | … |
| NGC 1533 | 1.8 0.3 | 6.3 0.4 | 12.0 0.4 | 0.5 0.1 | … |
| NGC 1553 | … | 15.4 1.0 | 28.9 1.8 | … | 7.5 0.7 |
| NGC 2974 | 2.6 0.6 | 13.5 1.2 | 44.9 1.2 | … | … |
| NGC 3258 | … | 5.6 0.5 | … | … | … |
| NGC 3268 | … | 4.8 0.3 | 7.6 0.5 | … | … |
| NGC 3557 | … | 8.4 0.4 | 7.1 0.4 | 2.7 0.3 | 4.3 0.3 |
| NGC 3962 | … | 6.2 0.5 | 31.7 1.0 | 1.4 0.4 | 2.1 0.3 |
| NGC 4374 | 2.2 0.6 | 24.3 1.0 | 40.8 1.3 | 3.6 0.7 | … |
| NGC 4552 | … | … | … | … | … |
| NGC 4636 | … | … | … | … | … |
| NGC 4696 | 0.9 0.1 | 4.9 0.2 | 14.5 0.5 | 4.0 0.1 | 4.5 0.2 |
| NGC 4697 | … | … | … | … | … |
| NGC 5011 | … | 3.1 0.2 | 5.0 0.2 | … | … |
| NGC 5044 | 1.5 0.2 | 9.0 0.3 | 44.4 1.1 | 0.8 0.1 | 1.4 0.1 |
| NGC 5077 | 2.6 0.5 | 11.7 0.6 | 45.6 1.4 | 2.1 0.5 | 1.6 0.5 |
| NGC 5090 | 0.8 0.2 | 5.3 0.4 | 12.9 0.5 | … | … |
| NGC 5813 | … | … | … | … | … |
| NGC 5846 | … | … | … | … | … |
| NGC 5898 | … | 4.5 0.4 | 9.3 0.5 | … | 2.0 0.4 |
| NGC 6868 | … | 22.3 0.8 | 28.8 1.0 | 2.8 0.5 | 3.8 0.5 |
| NGC 7079 | 1.0 0.2 | 5.2 0.4 | 5.9 0.4 | 2.1 0.3 | 1.7 0.4 |
| NGC 7192 | … | 2.7 0.2 | 4.0 0.2 | … | … |
| NGC 7332 | 1.8 0.3 | 4.7 0.3 | 8.2 0.7 | 1.0 0.3 | 1.1 0.2 |
| IC 1459 | 3.1 1.0 | 23.5 1.7 | 50.0 2.2 | … | … |
| IC 3370 | 0.7 0.1 | 1.6 0.2 | 0.9 0.2 | 1.5 0.2 | … |
| IC 4296 | … | 10.1 1.1 | 15.0 0.8 | 2.0 0.5 | … |
| IC 5063 | … | 480.5 58.9 | 524.9 66.5 | … | … |
| Galaxy | 6.22m | 7.7ma𝑎aa𝑎aIncludes the 7.42 m, 7.60 m and the 7.85 m features. | 8.6m | 11.3mb𝑏bb𝑏bIncludes the 11.23 m, and the 11.33 m features. | 12.7mc𝑐cc𝑐cIncludes the 12.62 m and the 12.69 m features. | 17md𝑑dd𝑑dIncludes the 16.45 m, 17.04 m, 17.375 m and the 17.87 m features. |
|---|---|---|---|---|---|---|
| name | ( W m-2) | ( W m-2) | ( W m-2) | ( W m-2) | ( W m-2) | ( W m-2) |
| NGC 1052 | 120.0 33.0 | 239.0 41.4 | … | 195.8 40.4 | … | 254.1 66.3 |
| NGC 1297 | 13.3 4.4 | 62.9 3.3 | 13.8 1.0 | 44.9 1.4 | 21.8 1.3 | 23.6 2.5 |
| NGC 1453 | … | 77.4 10.7 | 10.6 2.4 | 31.0 2.8 | 20.8 2.1 | 13.2 1.7 |
| NGC 1533 | … | … | … | 31.3 3.8 | 12.6 2.1 | 27.4 1.9 |
| NGC 1553 | 105.6 10.3 | 406.8 35.3 | 48.7 7.4 | 275.8 10.5 | 84.4 7.0 | 78.3 5.5 |
| NGC 2974 | 88.3 9.4 | 409.7 21.2 | 44.0 3.9 | 256.9 7.2 | 113.5 5.7 | 144.9 5.3 |
| NGC 3258 | 113.8 4.9 | 537.6 15.3 | 110.4 4.6 | 119.4 3.1 | 72.0 2.9 | 44.1 1.4 |
| NGC 3268 | 67.5 6.4 | 341.1 9.6 | 48.3 2.9 | 150.5 4.3 | 83.6 4.1 | 73.3 2.5 |
| NGC 3557 | 32.5 10.7 | 134.9 11.5 | 19.6 5.8 | 91.5 4.9 | 48.4 5.8 | 32.5 3.9 |
| NGC 3962 | 31.9 8.8 | 133.1 8.8 | 24.6 3.8 | 102.8 4.6 | 37.3 2.9 | 35.3 4.8 |
| NGC 4374 | 65.7 20.6 | 258.3 28.7 | 51.3 6.6 | 178.9 9.4 | 95.1 7.0 | 65.2 4.7 |
| NGC 4552 | … | … | … | 38.3 7.9 | … | 7.9 1.8 |
| NGC 4636 | … | … | … | 20.7 5.0 | … | 8.8 0.8 |
| NGC 4696 | … | … | … | 11.3 1.7 | … | 7.5 0.5 |
| NGC 4697 | 211.0 21.2 | 816.8 44.5 | 199.0 16.2 | 263.0 14.2 | 179.3 5.0 | 78.4 7.9 |
| NGC 5044 | 29.4 7.0 | 112.5 5.8 | 32.13.1 | 58.1 2.1 | 27.1 1.8 | 28.8 0.9 |
| NGC 5077 | … | 66.6 6.5 | 22.34.7 | 30.8 2.5 | 14.0 1.8 | 41.2 2.6 |
| NGC 5090 | 13.5 4.1 | 80.6 13.4 | 10.51.6 | 34.5 2.4 | 21.8 2.4 | 11.7 3.1 |
| NGC 5898 | … | 53.0 16.3 | … | 46.5 4.3 | 15.1 3.3 | 21.7 2.4 |
| NGC 6868 | 50.5 12.3 | 242.7 24.3 | 27.5 2.9 | 129.6 6.9 | 86.8 4.9 | 45.6 3.1 |
| NGC 7079 | 23.1 4.9 | 90.2 3.9 | 24.7 3.0 | 65.5 2.5 | 29.8 2.3 | 20.4 0.6 |
| IC 1459 | … | 108.4 15.1 | 6.1 1.8 | 84.9 6.0 | 41.0 5.4 | 47.1 4.7 |
| IC 3370 | … | 62.9 19.6 | 13.1 3.5 | 22.2 3.6 | 22.5 5.7 | 21.5 2.5 |
| IC 5063 | … | 1190.4 140.9 | 208.8 68.9 | 462.9 125.4 | … | … |
| IC 4296 | … | … | … | 26.75.8 | 26.0 5.6 | 19.8 5.6 |
3 Observations and data reduction
The data set presented here is composed of MIR spectra obtained with the Infrared Spectrograph instrument of the Spitzer space telescope. It is composed of data from our own proposal (PI Rampazzo in Table 2, program ID 30256), obtained during the third Spitzer General Observer Cycle on 2007 June 1, and data retrieved from the Spitzer archive (mainly from Bregman, ID 3535, and Kaneda, ID 3619 and ID 30483). The details of the observations for each galaxy are provided in Table 2.
Our observations were performed in Standard Staring mode with low resolution ( 64–128) modules SL1 (7.4–14.5m), SL2 (5–8.7m), LL2 (14.1–21.3m) and LL1 (19.5–38m). Observations of the other investigators do not include, in general, all IRS modules.
The data reduction used for these data was first presented in Bressan et al. (2006), but was optimized later, as described below.
We first removed bad pixels from the IRS coadded images with an adapted version of the IRSCLEAN666http://ssc.spitzer.caltech.edu/archanaly/contributed/irsclean/ procedure. Then, the sky background was removed by subtracting coadded images taken with the source placed in different orders at the same nod position. For most extended galaxies (IC 1459, NGC 1052, NGC 1407, NGC 1553, NGC 2974, NGC 3557, NGC 3962, NGC 4696, NGC 5090) offset exposures were obtained to measure the sky background without contamination from the target galaxy itself. For those galaxies for which only LL2 module was used, the background subtraction was done by subtracting coadded images taken with the source at different nod positions.
In order to derive calibrated spectral energy distributions, we have to take into account that the galaxies in the sample are extended, compared to the IRS point spread function (PSF). Since the IRS spectra are calibrated on point-sources, we have devised an ad hoc procedure to correct for the effects of the variation with the wavelength of the IRS PSF. This procedure exploits the large degree of symmetry characterizing the light distribution in ETGs. This procedure was applied to SL modules but not to LL modules where the sources can be considered as point sources with respect to the IRS PSF.
We obtained new e- s-1 to Jy flux conversions by applying a correction for aperture losses (ALCF), and a correction for slit losses (SLCF), to the flux conversion tables provided by the Spitzer Science Center (Kennicutt et al. 2003). By applying the ALCF and SLCF corrections, we obtained the flux received by the slit.
For each galaxy, we simulated the corresponding observed linear profile along the slits by convolving with a wavelength dependent two-dimensional intrinsic surface brightness profile with the instrumental PSF. The adopted profile is a two dimensional modified King law (Elson et al. 1987). By fitting the observed profiles with the simulated ones, we can reconstruct the intrinsic profiles and the corresponding intrinsic spectral energy distribution (SED). This procedure also has the advantage of determining whether a particular feature is spatially extended or not.
Finally the spectrum was extracted in a fixed width of 18″ for SL around the maximum intensity (corresponding to an aperture of 36 18″). The LL spectrum was rescaled to match that of SL.
The uncertainty in the flux was evaluated by considering the dark current noise, the readout noise, and the Poissonian noise from the background and from the source. The Poissonian noise associated with the sources’ flux was estimated as the square root of the ratio between the variance of the number of e- extracted per pixel in each exposure, and the number of the exposures. The same method was applied to derive the Poissonian noise from the background; where background was extracted from the coadded images in the IRS order where the source was not present.
We notice that the overall absolute photometric uncertainty of IRS is 10%, while the slope deviation within a single segment (affecting all spectra in the same way) is less than 3% (see the Spitzer Observer Manual).
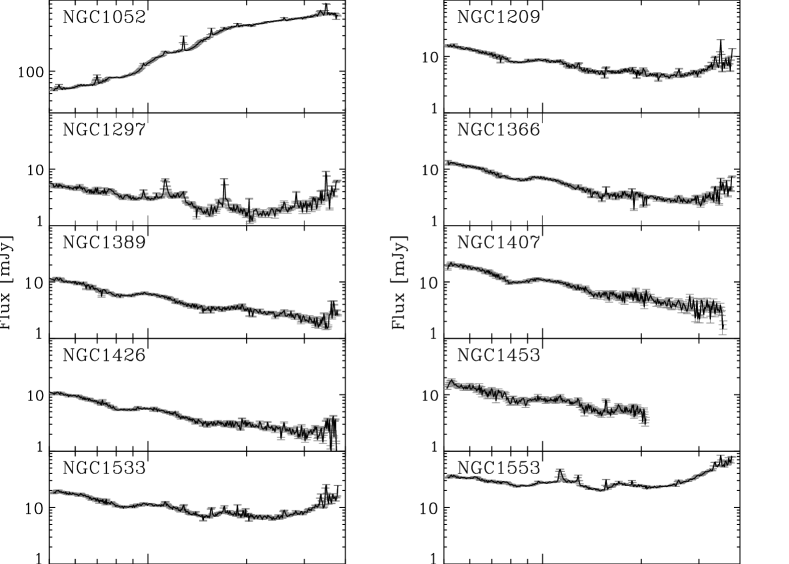
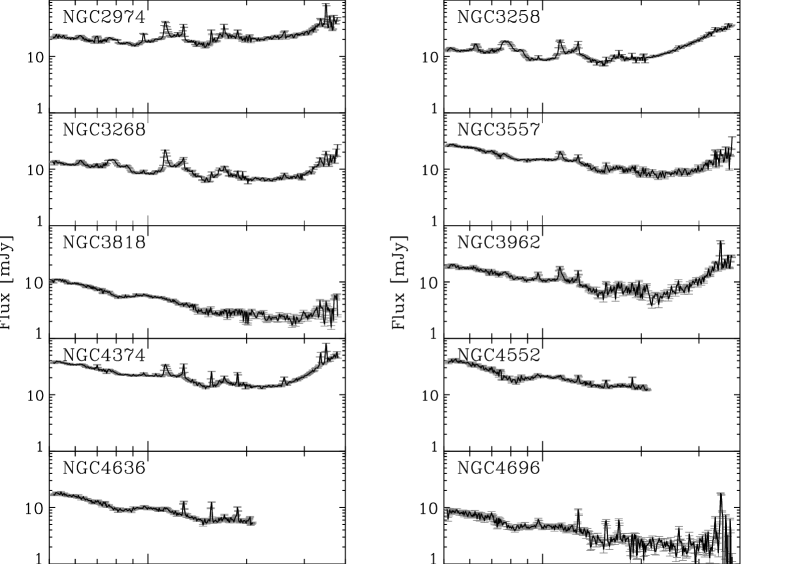
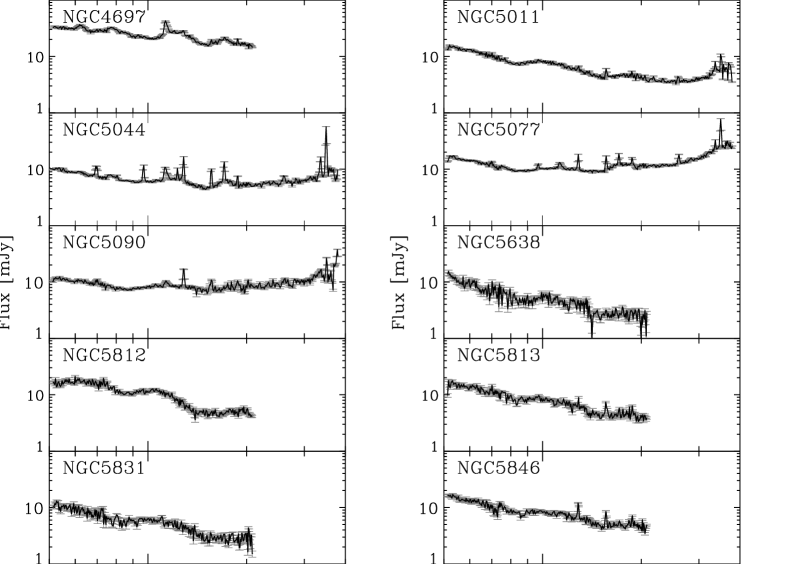
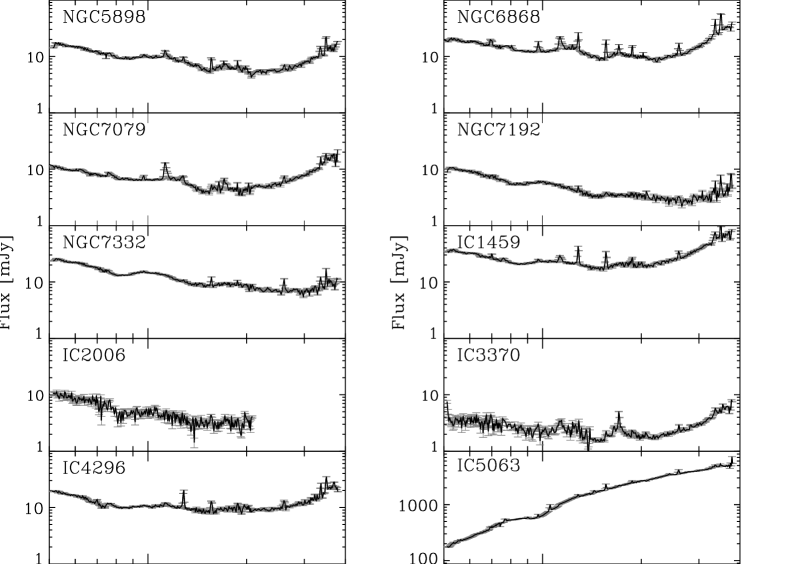
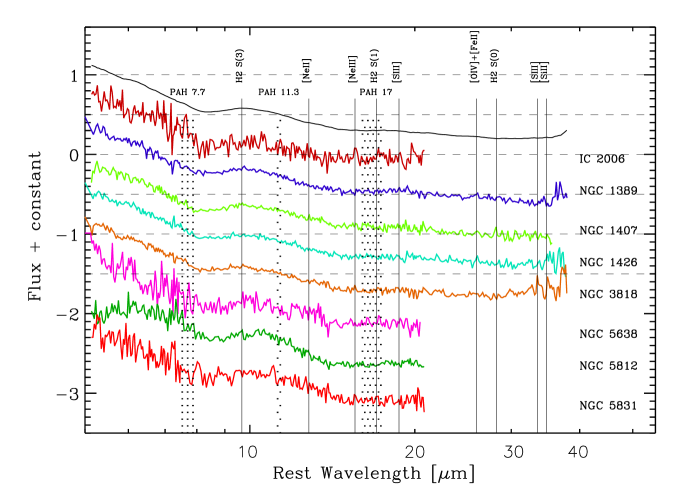
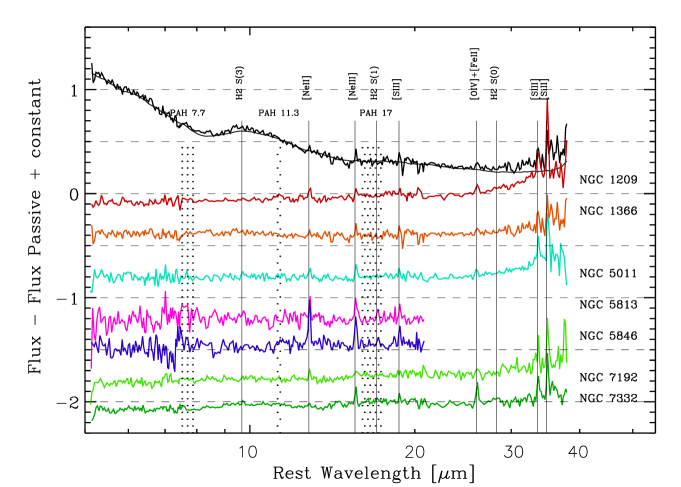
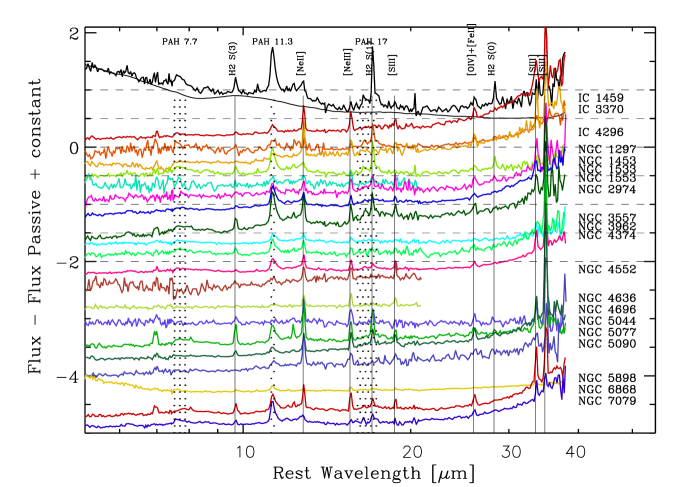
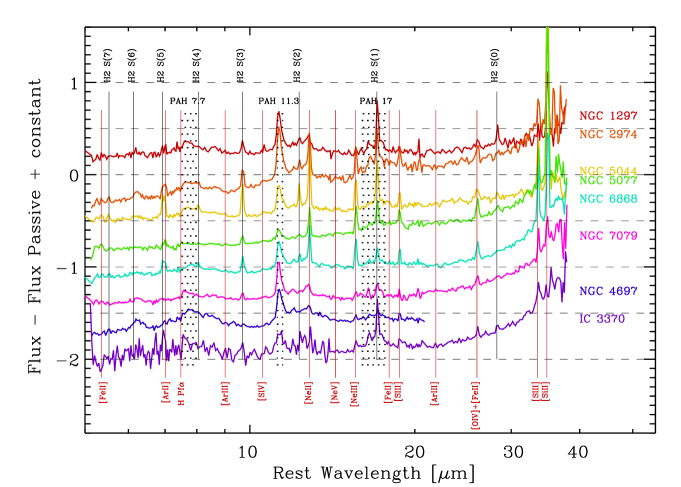
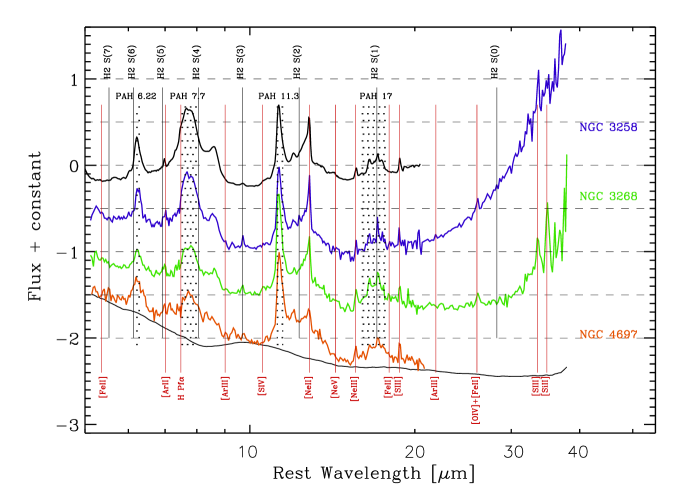
The rest frame flux calibrated IRS spectrum of each galaxy is shown in Fig. 1. The MIR spectra of our ETGs encompass a wide range of morphologies: AGN like, with PAH emission characteristic of star-forming galaxies, with unusual PAH emission, with only ionic/molecular emission lines, and finally, typical of passively evolving ETGs.
The following sections are devoted to the quantitative analysis of these spectra.
4 Analysis and classification of MIR spectra
Although the ETGs of this sample have quite similar optical spectra (with most of them classified from optical emission lines as LINERs), the MIR spectra show a surprising diversity.
4.1 Passive ETGs
We can, as a first step, separate the spectra into ”passive” and ”active” (see Bressan et al. 2006), where ”passive” spectra are those that do not show any emission lines or PAH emission features, while ”active” refers to objects that show one or the other, or both.
In our classification scheme we define as Class–0 those ETGs with purely passive spectra. Neither ionic or molecular emission lines, nor PAHs, are revealed in the spectra of NGC 1389, NGC 1407, NGC 1426, NGC 3818, NGC 5638, NGC 5812, NGC 5831, and IC 2006 (see also Kaneda et al. 2008; Bregman et al. 2006). The spectra of IC 2006, NGC 1407, NGC 5638, NGC 5812, and NGC 5831 have, however, a low signal-to-noise ratio. Class 0 accounts for 20% of the total MIR sample. Notice from Table 5 that, with the exclusion of IC 2006, Class–0 ETGs show no evidence of emission lines in their optical spectra, and were classified as Inactive. In the optical, IC 2006 exhibits weak emission lines, and is classified as a composite/transition object. The MIR spectrum of this ETG indicates a possible detection of the [Ne III]15.55m emission line at level (see Fig. 4). However, due to the low signal-to-noise ratio of the spectrum, we classify the MIR spectrum of this galaxy as purely passive.
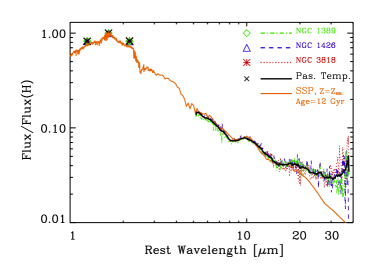
We averaged the spectra of the three best representatives of Class-0 objects (namely NGC 1389, NGC 1426, and NGC 3818), obtaining a template spectrum representative of an old stellar population. The MIR galaxy spectra were further extended into the NIR spectral region with 2MASS fluxes within the central 5″ radius (similar to the IRS extraction aperture), and then normalized in the H-band. The template and the spectra of the three ETGs are shown in Fig. 2. In the same figure we show also the SED of an SSP of solar metallicity and age 12 Gyr (from Bressan et al. 1998).
The main characteristic of passive spectra is the presence of the broad emission feature around 10 m that is attributed to silicate emission arising from the dusty circumstellar envelopes of O-rich AGB stars (see Athey et al. 2002; Molster et al. 2002; Sloan et al. 1998; Bressan et al. 1998) superimposed on the photospheric stellar continuum from red giant stars. The spectra also clearly show the presence of a less pronounced bump at around 18 m, likely arising from the same silicate circumstellar dust as predicted by Bressan et al. (1998) and as shown in the SSP SED. An hint of the presence of this bump can be found in the spectra presented in Bressan et al. (2006), although it is only clear in the present spectra that cover a larger spectral window. Finally we note the presence of a dip at 8 m probably due to photospheric SiO absorption bands (e.g. Verhoelst et al. 2009).
It is worth noticing that in this process we are assuming that the old stellar population is similar in all the galaxies analyzed. Indeed, inspection of Fig. 2 reveals that, once normalized to the 2MASS flux, the IRS spectra of the three passive galaxies are very similar, especially in the region where the old population dominates, below 15 m. At wavelengths longer than 30 m the spectra show a rising continuum which could be due to the presence of diffuse dust even in these “passive” objects. However, this will not affect our analysis because this rise is negligible with respect to other contributions that dominate this spectral region in “active” ETGs.
4.2 Measurement of the emission lines and PAH features
Intensities of emission lines and PAH features were obtained from the extracted spectra with an ad-hoc algorithm devised to decompose the Spitzer-IRS spectra of ETGs (Vega et al. 2010). The algorithm is similar to the PAHFIT tool (Smith et al. 2007), but with the noticeable difference that it includes a more adequate treatment of the emission from the old stellar population, whose contribution to the MIR spectra of ETGs cannot be neglected. This contribution can be of the order of 99% at the shorter wavelengths, m, and may remain important also at longer wavelengths (Vega et al. 2010).
The contribution due to the old stellar population has been removed from the other galaxies by subtracting the template after normalization to the corresponding 2MASS H-band flux, in the same 5″ radius aperture. In this way we find that, for the bulk of the sample (35/40), the contribution of the old stellar component to the observed fluxes at 5.6 m is greater than 95%. The contribution is lower in NGC 3258 (88%), NGC 4697 (87%) and NGC 3256 (85%).
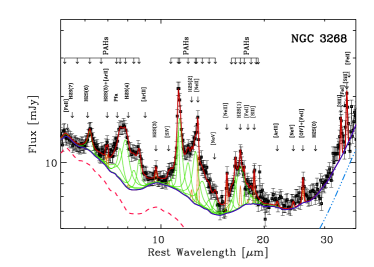
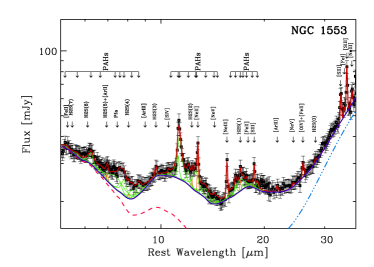
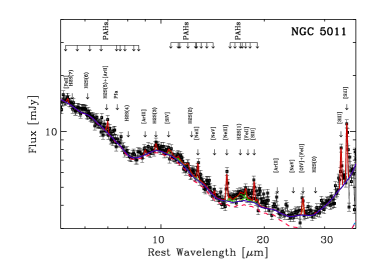
The subtracted (residual) spectra were fitted by a combination of modified black bodies describing dust emission, Drude profiles for PAH features, and Gaussian profiles for atomic and H2 emission lines, as fully detailed in Vega et al. (2010). In NGC 1052 and IC 5063, where the contribution from the old population is almost negligible (19% and 3%, respectively), and the spectrum is typical of an AGN (Wu et al. 2009), we used suitable spline functions to represent the underlying continuum.
Figure 3 show examples of the spectral decomposition in three typical galaxies with different degrees of activity.
The intensities of the MIR emission lines for the whole sample are listed in Table LABEL:tab3 (this table is available electronically only). Table 6 lists the intensities of the main PAH-complexes, for all the galaxies where they were detected. The decomposition of PAH complexes into individual PAH features is provided only in electronic form.
| Ident. | Activity | Spectrum |
|---|---|---|
| class Opt. | Morph. MIR | |
| NGC 1052 | LIN(H) | 4 |
| NGC 1209 | LIN(H) | 1 |
| NGC 1297 | LIN(H) | 2 |
| NGC 1366 | IN | 1 |
| NGC 1389 | IN | 0 |
| NGC 1407 | IN | 0 |
| NGC 1426 | IN | 0 |
| NGC 1453 | LIN(H) | 2 |
| NGC 1533 | LIN(H) | 2 |
| NGC 1553 | LIN(W) | 2 |
| NGC 2974 | LIN(H) | 2 |
| NGC 3258 | Comp(H) | 3 |
| NGC 3268 | LIN(H) | 3 |
| NGC 3557 | LIN(W) | 2 |
| NGC 3818 | IN(Traces) | 0 |
| NGC 3962 | LIN(H) | 2 |
| NGC 4374 | LIN(H) | 2 |
| NGC 4552 | Comp(W) | 2 |
| NGC 4636 | LIN(H) | 2 |
| NGC 4696 | LIN(H) | 2 |
| NGC 4697 | LIN(W) | 3 |
| NGC 5011 | LIN(W) | 1 |
| NGC 5044 | LIN(H) | 2 |
| NGC 5077 | LIN(H) | 2 |
| NGC 5090 | LIN(H) | 2 |
| NGC 5638 | IN | 0 |
| NGC 5812 | IN | 0 |
| NGC 5813 | LIN(W) | 1 |
| NGC 5831 | IN | 0 |
| NGC 5846 | LIN(H) | 1 |
| NGC 5898 | LIN(W) | 2 |
| NGC 6868 | LIN(H) | 2 |
| NGC 7079 | LIN(W) | 2 |
| NGC 7192 | LIN(W) | 1 |
| NGC 7332 | IN(Traces) | 1 |
| IC 1459 | LIN(H) | 2 |
| IC 2006 | Comp(W) | 0 |
| IC 3370 | LIN(H) | 2 |
| IC 4296 | LIN(H) | 2 |
| IC 5063 | AGN | 4 |
4.3 ETGs with emission lines but without PAH features
Showing only a possible faint [Ne III]15.55m atomic emission line, IC 2006 (belonging to Class–0) could mark a sort of transition between purely passive and ETGs with emission lines but without PAH features, or Class–1 ETGs, in our scheme (see Fig. 5). The continuum of all these ETGs is the same of the passive template up to 25 m, showing in some cases more dust emission at longer wavelenghts. Ionic (in particular [Ne II]12.8m, [Ne III]15.55m, [S III]12.82m lines) and H2 rotational lines (in particular S(1)17.0) are detected. Still, no PAHs are revealed in NGC 1209, NGC 1366, NGC 5011, NGC 5813, NGC 5846, NGC 7192, or NGC 7332. This class includes 22% of our ETGs. Most of Class–1 ETGs in the MIR are LINERs in the optical region. The only exception is NGC 1366 which has been classified Inactive in the optical.
None of the ETGs in Class–0 and Class–1 can be arranged into the A, B, C, D classes of LINERs devised by Sturm et al. (2006), since all of these latter show PAH complexes.
4.4 ETGs with PAHs
PAH emission has been detected in many ETGs (see e.g. Bregman et al. 2006; Bressan et al. 2006; Kaneda et al. 2005; Panuzzo et al. 2007; Kaneda et al. 2008). We detect PAHs in 62.5% of our MIR sample.
ETGs showing PAHs are collected in Figs. 6 – 9. The MIR spectra also exhibit forbidden nebular emission lines of several elements like Ar, Fe, Ne, O, S, and Si (see Table LABEL:tab3). The galaxies displayed in Fig. 6 show a prominent 11.3 m PAH feature and have unusual 7.7m/11.3m PAH band ratios, typically . They represent 50% of our total sample, and 80% of the sub-set of ETGs with PAH features. We classify these galaxies, with unusual PAH ratios, as Class–2 ETGs. Within this class we include also NGC 4636 and NGC 4696, which show very faint 6.3m, 7.7m and 8.6m PAH emission (see Table 4), although 11.3 m PAH in both cases is detected. Notice that for NGC 4696 Kaneda et al. (2008) report inter-band strength ratios of 7.7m/11.3m 0.6 and 17m/11.3m 0.5.
Figure 7 shows Class–2 ETGs whose spectra, in addition to PAH features, exhibit prominent H2 rotational emission lines. In NGC 1297, NGC 5044, NGC 5077, NGC 6868, and NGC 7079 most or even the full series of emission lines from H S(0)-S(7) are detected.
NGC 3258, NGC 3268, and NGC 4697 are shown separately in Fig. 8, since their spectra are dominated by 7.6m, 11.3m, 12.7m and 17m PAHs, and present normal PAH inter-band ratios (i.e. , Lu et al. 2003; Smith et al. 2007). Their spectra are very similar to the post-starburst ETG NGC 4435 (Panuzzo et al. 2007), shown in the same plot for comparison. The shape of the spectra is reminiscent of the 1B class in Spoon et al. (2007), i.e. a MIR spectrum exhibiting the family of PAH features at 6.2, 7.7, 8.6, 11.2, 12.7, and 17.3m on top of a hot dust continuum. Prototypical of the Class 1 B in Spoon et al. is the nucleus of the Seyfert 1.2, barred spiral NGC 7714. However, NGC 3258 and NGC 3268 also present a steepening of the 20-30 m continuum, which is absent in the 1 B class but present in the 2C class, and which could be due to a cold dust component. We place these galaxies with “normal” PAH emission ratios into Class–3.
4.5 ETGs with hot dust continuum
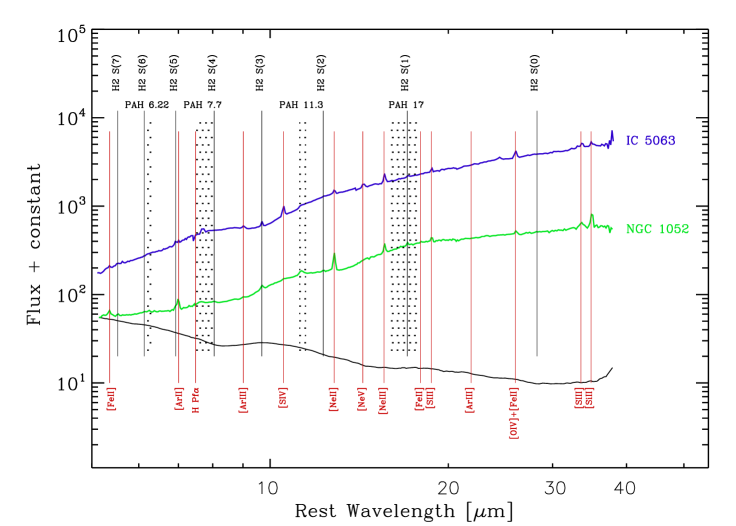
The MIR spectra of NGC 1052, considered a prototypical LINER (see e.g. Ho 2008), and of IC 5063, a well known Seyfert (see for references on-line notes in R05) are shown in Fig. 9. The continuum of both galaxies is dominated by hot dust, most probably coming from an AGN torus. PAH emission features are also visible; in particular, NGC 1052 shows both the 7.6 and 11.3m PAH complexes, while it is possible to distinguish only the 7.6m feature in IC 5063. H2 0-0 S(1) and S(3) molecular emission lines are present in both spectra. Ionic forbidden emission lines of [Ar II], [Ne II] and [Ne III], [S III] and [O IV] are revealed in both spectra. High-ionization [S IV] and [Ne V] emission lines are revealed only in IC 5063. We classify the MIR spectra of these two ETGs as Class–4.
In column 3 of Table 5 we report the MIR spectrum morphology. In Table 6 we summarize the fraction of our ETGs in the different classes.
| Class–0 | Class–1 | Class–2 | Class–3 | Class–4 | |
|---|---|---|---|---|---|
| number | 8 | 7 | 20 | 3 | 2 |
| % | 20 | 17.5 | 50 | 7.5 | 5 |
5 The MIR Ne-S-Si diagnostic diagram
Nebular emission lines provide a powerful diagnostic tool to determine the nature of the emission-powering source. Classical optical diagnostic diagrams ([NII]6583/H vs. [O III]5007/H, [S II]6716+6731)/H vs [O III]5007/H, and [OI6300/H vs [O III]5007/H, see e.g., Baldwin et al. 1981; Veilleux & Osterbrock 1987) are used to separate star-formation, Seyferts and LINERs. In Paper IV we showed that the majority of the galaxies in our ETG sample are classified as LINERs (see Col.2 of Table 5 for the optical classification). However, LINERs are compatible with both low accretion-rate AGN and fast shock models in optical diagnostic diagrams, implying that a disentanglement of the excitation mechanism is not possible.
The advent of ISO first, and Spitzer later, allowed astronomers (e.g. Genzel et al. 1998; Laurent et al. 2000; Verma et al. 2003; Peeters et al. 2004; Armus et al. 2004; Sturm et al. 2006; Dale et al. 2006; Smith et al. 2007; Dale et al. 2009) to investigate diagnostic diagrams in a spectral region with much smaller dust attenuation and almost free of stellar absorption features. Several diagnostic diagrams, based on MIR emission lines and/or PAH features, have been proposed to characterize the physical state of the system and to infer the nature of the dominant powering mechanisms.
The strength of PAH features depends on a complex combination of several parameters characterizing the ISM: the metallicity, the distribution of sizes and ionization states of the PAH molecules, and the intensity and hardness of the interstellar radiation field (e.g. Cesarsky et al. 1996; Li & Draine 2001; Draine & Li 2007; Galliano et al. 2008).
Forbidden lines, like [Ne II]12.81m, [Ne III]15.55m, [S III]18.70m, [S III]33.48m, and [Si II]34.82m are quite prominent in the MIR spectra of star-forming regions, while [O IV]25.89m, [S IV]10.51m and [Ne V]14.32m are characteristic of AGN emission (see e.g. Netzer et al. 2007; Tommasin et al. 2008, 2010). Bright [Fe II]25.98m and [Si II]34.82m lines are emitted by regions with different physical conditions like X-ray dominated regions (XDR) (e.g. Hollembach & Tielens 1999; Kaufman et al. 2006) and shocked regions, where heavy elements such as Si and Fe may be less depleted from the gas phase due to dust destruction (e.g. O’Halloran et al. 2006).
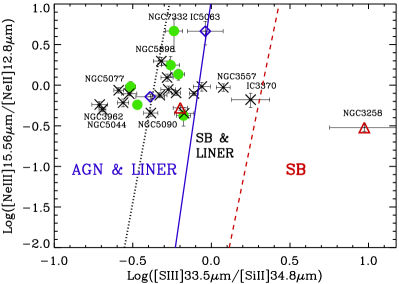
In the top panel of Fig. 10, we report the position of our ETGs in the diagnostic diagram [Ne III]15.56m/[Ne II]12.8m vs. [S III]33.48m/[Si II]34.82m proposed by Dale et al. (2006). The [Ne III]15.56m/[Ne II]12.8m ratio represents the hardness of the ionizing source, while the [S III]33.48m/[Si II]34.82m is affected by the presence of X-rays and Si depletion.
The diagonal lines in the plot show empirical separation of different powering sources by Dale et al. (2006).
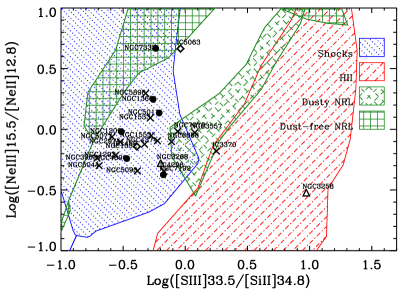
In the bottom panel of Fig. 10, we report models for HII regions, Narrow Line Regions (NLRs) and shocks, collected with the help of the ITERA software888http://www.strw.leidenuniv.nl/brent/itera.html (Groves & Allen, in prep). The model libraries are from Dopita et al. (2006) (HII regions), Groves et al. (2004a, b) (NLR) and Allen et al. (2008) (shock and shock+precursor). Two sets of Narrow Line Region models were used, one dust-free, the second accounting for the presence of dust in the NLR, including the effect of metal depletion.
We can note that HII regions powered by star-formation have a very small overlap with NLR models in this diagnostic diagram, while dust-free NRL models almost completely overlap with shock models.
Since the metal depletion in NLR is not known and most probably varies between different sources (Dopita et al. 2002), we can expect the region of the above diagnostic diagram between dust-free and dusty NRL models to be populated by NRLs with different dust-to-gas mass ratios. As a consequence, sources in the region with Log([S III]33.48m/[Si II]34.82m) between -1 and 0 can be explained both as shock-powered and AGN-powered. Most of our “active” sample lie in this region, so it is not possible to distinguish if the line emission is powered by shocks or by AGN using this diagnostic diagram. We finally note that only NGC 3258 can be classified as a star-forming object from its emission lines.
6 Discussion
Several kinds of signature suggest that ETGs in our sample have undergone through renjuvenation episodes in their recent history. Our analysis of the optical line-strength indices (Paper III) shows that ETGs have different luminosity weighted ages (see column 7 in Table 1). This is widely believed to be due to recent secondary star formation events induced by accretion and/or interaction. In Table A1 of Paper IV we report kinematical and morphological peculiarities, as they appear in the current literature, of our ETGs. A large fraction show kinematic, like gas vs. star counter-rotations, and morphological distortions, like tails and shells, supporting the view of accretion events. In particular, shell-like structures support the view of minor accretion events (Dupraz & Combes 1986; Ebrova et al. 2009). In Paper IV we show that the nebular oxygen abundance is slightly lower than that of stars suggesting an external origin for at least part of the gas present in the nuclei of our ETGs.
In the GALEX study of our ETGs (Paper V) we also show that, for a small fraction of barred lenticulars, the rejuvenation of the nucleus could also be attributed to inner secular evolution likely driven by bars. At the same time, accretion of gas from the outer halo of an ETG, induced by interaction, could also be possible. Examining 33 galaxies representative of the SAURON sample Oosterloo et al. (2010) detected HI in 2/3 of their field sample, concluding that neutral gas accretion plays a role in the evolution of field ETGs. In a survey of about 100 ATLAS3D galaxies, Serra et al. (2009) detected HI in about half of the ETGs located outside Virgo. They suggest that isolated ETGs are characterized by very regular, rotating cold gas systems while galaxies with neighbours or residing in galaxy groups typically have disturbed HI morphology/kinematics. They conclude that environment is a fundamental driver of ETG evolution at z0 and that, in the absence of significant disturbance from nearby objects, ETGs can accrete and maintain large systems of cold gas without this appreciably affecting their optical morphology. From the above studies, it appears “normal” that ETGs in low density environments may acquire gas and the material associated with this gas (as beautifully shown by dust-lanes in NGC 1409/1410 described in Keel 2004) during perturbation events. This material may lose angular momentum falling towards the galaxy centre and may or may not feed star formation or AGN activity.
Finally, we cannot exclude “dry” accretions, i.e. accretion of pure stellar systems. The spectral analysis of faint companions of ETGs in low density environments, where our ETGs are mostly located, performed by Grützbauch et al. (2009) showed that the vast majority of these latter do not show emission lines (see also the population analysis in Annibali et al. 2010b).
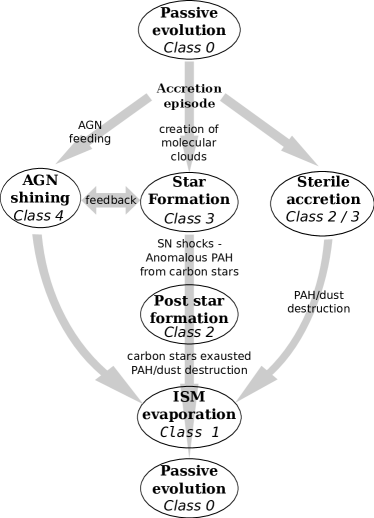
Given the great diversity of the nuclear MIR spectra of galaxies presented here, it is natural to ask if the above empirical spectral classes represent different phases of a unique “evolutionary path” driven by accretion, secular evolution and interaction events which re-fuel the nucleus. We sketch an evolutionary path in Fig. 11. A passive galaxy, under the perturbation exerted by an external accretion, interaction or a secular evolutionary mechanism, could build a reserve of dense ISM in the nucleus which can switch-on the AGN and/or star-formation activity. Alternatively, if the accreted gas mass is too small, a sterile accretion could take place. The dense gas is then consumed by the AGN and/or star formation, or evaporated by the interaction with the hot gas halo; the galaxy would eventually return to the passive phase. We don’t treat the case of dry accretion which should not leave signatures in the MIR spectra.
We now try to associate to each physical phase of this evolutionary path a characteristic MIR spectral class.
As discussed above, the passive phase is characterizer by Class-0 MIR spectra, since this is the only class that doesn’t show any emission lines. We detected only the silicon features at about 10 and 18 m, arising from the circumstellar envelopes of O-rich AGB stars. This dust, once diffused in the ISM, it is destroyed by the hot gas halo (see Clemens et al. 2010).
The star-formation phase is characterized by spectra of Class 3. This class is also characteristic of the phase just after the switch-off of the star formation episode when the UV flux from B stars is still abundant enough to create ionized PAHs, the principal carriers of the 7.7m feature.
The Class-4 spectra, with their hot dust continuum, are characteristic of the AGN phase. However we note that AGN activity is frequently associated with star-formation activity (see also Paper IV, ) so Seyfert galaxies will be characterized by spectra mixing Class-4 and Class-3 (see Wu et al. 2009, for a collection of MIR spectra of Seyfert galaxies). Note that in some cases the AGN MIR spectra can be dominated by synchrotron emission, like in M87 (Buson et al. 2009).
The origin of Class-2 spectra is discussed in detail in Vega et al. (2010), and they can be associated with the post-star-formation phase. In this phase, there are three mechanisms that concur, resulting in unusual PAH features: i) the UV radiation field is no longer strong enough to ionize PAH molecules ii) shocks from supernovae destroy small PAHs; iii) the production of PAHs from carbon stars. We note that, for solar metallicity, carbon stars are present in stellar populations with ages between 250 Myr and 1.3 Gyr (Marigo & Girardi 2007). If we assume a characteristic life time of 200 Myr for star formation episodes (see e.g. Panuzzo et al. 2007), we espect a ratio between Class-2 and Class-3 of 5, which is consistent with the ratio observed in this sample (7). Extremely interesting among the MIR class 2 ETGs are the spectra showing H2 molecular gas emission (see Fig. 7). H2 formation is an important process in post-shock regions, since H2 is an active participant in the cooling and shielding of the region (Cuppen et al. 2010; Guillard et al. 2010). In our view, although we cannot disentangle using the Dale-plot in Fig. 10 between AGN and shock powering mechanisms, these latter could play a significant role in the centre of ETGs.
In our evolutionary path we envisage that an accretion episode can happen without the ignition of an AGN nor of star-formation activity (Sterile accretion in Fig. 11). There is probably no unique MIR spectral class charaterizing this phase. The acquired material may contain PAH molecules with different size distributions, depending on the origin of the gas, and on the efficiency of the sputtering effects of the hot ISM. The ionization fraction also depends on the UV radiation fields which depends on if the accretion was limited to pure gas or if also relatively young stars were acquired. This phase is probably characterized by MIR spectra of class 2 (with the exception of features associated to carbon stars, as in Vega et al. 2010) or class 3, if the UV radiation field is strong enough.
Finally we envisaged in our evolutionary path an “ISM evaporation” phase. For objects that had star formation activity, this phase follows the post-star-formation phase; carbon stars are exhausted (so no more PAH production) and the PAHs were destroyed by the hot plasma halo in which ETGs are immersed. The residual gas is then ionized by either post-AGB stars or by SN Ia shocks. For the objects that experienced the AGN phase, this is the phase where the gas reservoir of the AGN is exhausted and the observed low ionization emission lines are due to either a residual low power AGN activity or to shocks and/or PAGB stars. To this phase we associate Class-1 spectra which show only low ionization emission lines. When all the warm ionized gas is transformed into the hot plasma phase, the galaxy will return to the passive phase.
A more complete discussion on the evolutionary path described above, including the use of information from other spectral windows, is beyond the scope of this article and will be the subject of a future article. However we showed that, although all ETGs in our sample are quite homogeneous in the optical window and are mostly classified as LINERs, the MIR spectral region is very useful in identifying the physical process occurring in these galaxies.
7 Conclusions
We presented Spitzer-IRS spectra for 40 ETGs, 18 of which from our own proposal (ID 30256), and 22 from the archive. The entire data-set of 40 galaxies were analyzed homogeneously for internal consistency. The 40 galaxies belong to our original sample of 65 ETGs (the R05+A06 sample), for which we had previously characterized the stellar populations and the properties of the optical emission lines. From optical emission line ratios, the majority of our galaxies are classified as LINERs.
We measured the MIR atomic/molecular lines and the PAH features through an ad-hoc algorithm that includes an adequate treatment of the emission from the old stellar population, whose contribution to the MIR spectra of ETGs cannot be neglected. The template of the old stellar population was obtained as the average of the MIR fluxes of the three passive ETGs with the highest signal-to-noise ratios in our IRS spectra.
We propose a new classification of ETGs based on the MIR properties of the continuum, the atomic and molecular lines, and the PAH complexes:
-
•
Class–0 comprises passively evolving ETGs. These galaxies are characterized by : (a) the absence of PAH, atomic and molecular line emission; (b) a dip at 8 m probably due to photospheric SiO absorption bands; c) a broad emission feature around 10 m due to silicate emission bands arising from the dusty circumstellar envelopes of O-rich AGB stars; d) a broad emission feature around 10 m with the same origin. This class accounts for 20% of our sample.
-
•
Class–1 includes ETGs that exhibit atomic and molecular emission lines, but that still do not show PAH features. Class–1 accounts for 17.5% of our sample.
-
•
Class–2 includes ETGs which exhibit PAH features (besides atomic and molecular emission lines) with unusual interband ratios: usually strong emission features at 6.2, 7.7, and 8.6 m are weak in contrast to prominent features at 12.7, 11.3 and 17 m. Indeed, a result from Spitzer is that this is more the rule than an exception in ETGs. Class–2 accounts for 50% of our sample.
-
•
Class–3 comprises ETGs with normal PAH interband ratios, i.e. more typical of star-forming galaxies. Class–3 represents 7.5% of the sample.
-
•
Class–4 includes ETGs with hot dust continuum. AGN [S IV] and [Ne V] high-ionization emission lines are revealed only in IC 5063. Class–4 represents 5% of our sample.
Based on starburst, AGN, and shock models, we investigated MIR line-ratio planes to spot diagnostics that allow for a complete disentanglement of the different excitation mechanisms. We used the diagram [Ne III]15.55m/[Ne II]12.8m vs. [S III]33.48m/[Si II]34.82m to attempt a disentanglement of these mechanisms in the galaxy nuclei. The diagram has the advantage that it involves strong and easy to measure emission features. [S III]33.48m and [Si II]34.82m lie in the same Long-High module of the Spitzer-IRS, which minimizes cross module uncertainties involving calibration and aperture matching. When comparing our data with this diagnostic, it emerges that the majority of ETGs are outside the starburst area and lie in the region in which either shock, AGN-like, or both mechanisms give rise to the observed emission.
We sketched a possible evolutionary scenario for ETGs induced by accretion and interaction events. Such episodes are indeed suggested both by the kinematical/morphological peculiarities and by the nebular O abundance found in Paper IV of the series. We associated to the different phases of the above scenario the MIR spectral classes defined above. This association and the variety of MIR characteristics allow to shed light on the renjuvenation episodes and on the physical processes happening in ETGs (in particular in LINERs), which are, otherwise, quite homogeneous in the optical spectral window.
Further insight will come from the study of the PAH emission and of the H2 molecular lines (see however Vega et al. 2010), and from the comparison of MIR spectral characteristics with the information from other wavelenghts, which will be investigated and discussed in forthcoming papers.
Acknowledgements.
This work is based on observations made with the Spitzer Space Telescope, which is operated by the Jet Propulsion Laboratory, California Institute of Technology under a contract with NASA. Support for this work was provided by NASA through an award issued by JPL/Caltech. Part of this work was supported by ASI-INAF contract I/016/07/0. We thank the referee for the very useful suggestion. RR is highly indebted for the hospitality and financial support of the DSM/Irfu/Service d’Astrophysique, CEA Saclay, France.References
- Allen et al. (2008) Allen, M. G., Groves, B. A., Dopita, M. A., Sutherland, R. S., & Kewley, L. J. 2008, ApJS, 178, 20
- Annibali et al. (2006) Annibali, F., Bressan, A., Rampazzo, R., Zeilinger, W. W. 2006, A&A, 445, 79: Paper II
- Annibali et al. (2007) Annibali, F., Bressan, A., Rampazzo, R., Zeilinger, W. W., Danese, L. 2007, A&A, 463, 455: Paper III
- Annibali et al. (2010a) Annibali, F., Bressan, A., Rampazzo, R., et al. 2010a, A&A, 519, A40: Paper IV
- Annibali et al. (2010b) Annibali, F., Grützbauch, R., Rampazzo, R., Bressan, A., Zeilinger, W. W. 2010b, A&A, in press
- Armus et al. (2004) Armus, L., Charmandaris, V., Spoon, H. W. W., et al. 2004, ApJS, 154, 178
- Athey et al. (2002) Athey, A., Bregman, J., Bregman, J., Temi, P., Sauvage, M. 2002, ApJ, 571, 272
- Baldwin et al. (1981) Baldwin, J. A., Phillips, M. M., Terlevich, R. 1981, PASP, 93, 5
- Binette et al. (1994) Binette, L., Magris, C. G., Stasińska, G., & Bruzual, A. G. 1994, A&A, 292, 13
- Bregman et al. (2006) Bregman, J. N., Temi, P., Bregman, J. D. 2006, ApJ, 647, 265
- Bressan et al. (1998) Bressan, A., Granato, G. L., Silva, L. 1998, A&A, 332, 135
- Bressan et al. (2006) Bressan, A., Panuzzo, P., Buson, L., et al. 2006, ApJ, 639, L55
- Buson et al. (2009) Buson, L., Bressan, A., Panuzzo, P., et al. 2009, ApJ, 705, 356
- Cesarsky et al. (1996) Cesarsky, D., Lequeux, J., Abergel, A., et al. 1996, A&A, 315, L309
- Clemens et al. (2010) Clemens, M. S., Jones, A. P., Bressan, A., et al. 2010, A&A, 518, L50
- Cuppen et al. (2010) Cuppen, H. M., Kristensen, L. E., Gavardi, E. 2010, MNRAS, 406, L11
- Dale et al. (2006) Dale, D. A., Smith, J. D. T., Armus, L., et al. 2006, ApJ, 646, 161
- Dale et al. (2009) Dale, D. A., Smith, J. D. T., Schlawin, E. A., et al. 2009, ApJ, 693, 1821
- De Vaucouleurs et al. (1991) De Vaucouleurs, G., de Vaucouleurs, A., Corwin, H. G. Jr., et al. 1991 Third Reference Catalogue of Bright Galaxies, Springer-Verlag, New York
- de Zeeuw et al. (2002) de Zeeuw P.T., Bureau M., Emsellem E., et al. 2002, MNRAS, 329, 513
- Dopita et al. (1995) Dopita, M. A., & Sutherland, R. S. 1995, ApJ, 455, 468
- Dopita et al. (2002) Dopita, M. A., Groves, B. A., Sutherland, R. S., Binette, L., Cecil, G. 2002, ApJ, 572, 753
- Dopita et al. (2006) Dopita, M. A., Fischera, J., Sutherland, R. S., et al. 2006, ApJS, 167, 177
- Draine & Li (2007) Draine, B. T., & Li, A. 2007, ApJ, 657, 810
- Dupraz & Combes (1986) Dupraz, C., & Combes, F. 1986, A&A, 166, 53
- Ebrova et al. (2009) Ebrová, I., Jungwiert, B., Canalizo, G., Bennert, N., Jílková, L. 2009, in Galaxy Wars: Stellar Populations and Star Formation in Interacting Galaxies edited by Beverly Smith, Nate Bastian, Sarah J. U. Higdon, and James L. Higdon, ASP Conference Series Vol. 423, 236
- Elson et al. (1987) Elson, R. A. W., Fall, S. M., & Freeman, K. C. 1987, ApJ, 323, 54
- Eracleous et al. (2010) Eracleous, M., Hwang, J. A., & Flohic, H. M. L. G. 2010, ApJ, 711, 796
- Galliano et al. (2008) Galliano, F., Madden, S. C., Tielens, A. G. G. M., Peeters, E., & Jones, A. P. 2008, ApJ, 679, 310
- Genzel et al. (1998) Genzel, R., Lutz, D., Sturm, E., et al. 1998, ApJ, 498, 579
- González-Martín et al. (2009) González-Martín, O., Masegosa, J., Márquez, I., Guainazzi, M., & Jiménez-Bailón, E. 2009, A&A, 506, 1107
- Goudfrooij et al. (1998) Goudfrooij, P. 1999, in Star Formation in Early–Type Galaxies, ASP Conference Series 163, eds. J. Cepa and P. Carral, 55
- Groves et al. (2004a) Groves, B. A., Dopita, M. A., & Sutherland, R. S. 2004a, ApJS, 153, 9
- Groves et al. (2004b) Groves, B. A., Dopita, M. A., & Sutherland, R. S. 2004b, ApJS, 153, 75
- Grützbauch et al. (2009) Grützbauch, R., Zeilinger, W. W., Rampazzo, R., et al. 2009, ApJ, 502, 473
- Guillard et al. (2010) Guillard, P., Boulanger, F., Cluver, M. E., et al. 2010, A&A, 518, A59
- Heckman (1980) Heckman, T. M. 1980, A&A, 87, 152
- Ho (2008) Ho, L. 2008, ARA&A, 46, 475
- Hollembach & Tielens (1999) Hollenbach, D. J., Tielens, A. G. G. M. 1999, RvMP, 71, 173
- Kaneda et al. (2005) Kaneda, H., Onaka, T., & Sakon, I. 2005, ApJ, 632, L83
- Kaneda et al. (2008) Kaneda, H., Onaka, T., Sakon, I., et al. 2008, ApJ, 684, 270
- Kaufman et al. (2006) Kaufman, M. J., Wolfire, M. G., & Hollenbach, D. J. 2006, ApJ, 644, 283
- Keel (2004) Keel W.C., 2004, AJ, 127, 1325
- Kennicutt et al. (2003) Kennicutt, R. C. Jr., et al. 2003, PASP, 115, 928
- Kewley et al. (2006) Kewley, L. J., Groves, B., Kauffmann, G., & Heckman, T. 2006, MNRAS, 372, 961
- Kormendy et al. (2004) Kormendy, J. 2004, Coevolution of Black Holes and Galaxies, 1
- Koski et al. (1976) Koski, A. T., & Osterbrock, D. E. 1976, ApJ, 203, L49
- Laurent et al. (2000) Laurent, O., Mirabel, I. F., Charmandaris, V., et al. 2000, A&A, 359, 887
- Li & Draine (2001) Li, A., & Draine, B. T. 2001, ApJ, 554, 778
- Lu et al. (2003) Lu, N., Helou, G., Werner, M. W., et al. 2003, ApJ, 588, 199
- Macchetto et al. (1996) Macchetto, F., Pastoriza, M., Caon, N., et al. 1996, A&AS 120, 463
- Maoz et al. (2005) Maoz, D., Nagar, N. M., Falcke, H., & Wilson, A. S. 2005, ApJ, 625, 699
- Marigo & Girardi (2007) Marigo, P., & Girardi, L. 2007, A&A, 469, 239
- Marino et al. (2010) Marino, A., Rampazzo, R., Bianchi, L., et al. 2010, MNRAS, in press: Paper V
- Molster et al. (2002) Molster, F. J., Waters, L. B. F. M., & Tielens, A. G. G. M. 2002, A&A, 382, 222
- Netzer et al. (2007) Netzer, H., Lutz, D., Schweitzer, M., et al. 2007, ApJ, 666, 806
- O’Halloran et al. (2006) O’Halloran, B., Satyapal, S., & Dudik, R. P. 2006, ApJ, 641, 795
- Oosterloo et al. (2010) Oosterloo, T., Morganti, R., Crocker, A., et al. 2010, MNRAS, 409, 500
- O’Sullivan et al. (2001) O’Sullivan, E., Forbes, D. A., & Ponman, T. J. 2001, MNRAS, 328, 461
- Peeters et al. (2004) Peeters, E., Spoon, H. W. W., Tielens, A. G. G. M. 2004, ApJ, 613, 989
- Phillips et al. (1986) Phillips, M., Jenkins, C., Dopita, M., Sadler, E. M., & Binette, L. 1986, AJ, 91, 1062
- Panuzzo et al. (2007) Panuzzo, P., Vega, O., Bressan, A., et al. 2007, ApJ, 656, 206
- Pian et al. (2010) Pian, E., Romano, P., Maoz, D., Cucchiara, A., Pagani, C., & Parola, V. L. 2010, MNRAS, 401, 677
- Rampazzo et al. (2005) Rampazzo R., Annibali F., Bressan A., Longhetti M., Padoan F., & Zeilinger W. W. 2005, A&A433, 497: Paper I
- Roberts et al. (1991) Roberts, M. S., Hogg, D. E., Bregman, J. N., Forman, W. R., & Jones, C. 1991, ApJS, 75, 751
- Rupke et al. (2007) Rupke, D., Veilleux, S., Kim, D.-C., et al. 2007, in The Central Engine of Active Galactic Nuclei, ASP Conf. Series, Vol. 373, 525
- Sandage et al. (1987) Sandage, A.R., & Tammann, G. 1987, A Revised Shapley Ames Catalogue of Bright Galaxies, Carnegie, Washington (RSA)
- Sarzi et al. (2006) Sarzi, M., Falcón-Barroso, J., Davies, R. L., et al. 2006, MNRAS, 366, 1151
- Serra et al. (2009) Serra, P., Morganti, R., Oosterloo, T., et al. 2009, Proceedings of Panoramic Radio Astronomy: Wide-field 1-2 GHz research on galaxy evolution Edited by G. Heald and P. Serra
- Sloan et al. (1998) Sloan, G.C., Little-Marenin, I. R., & Price, S. D. 1998, AJ, 115, 809
- Smith et al. (2007) Smith, J. D. T., Draine, B. T., Dale D. A., et al., 2007, ApJ, 656, 770
- Spoon et al. (2007) Spoon, H. W. W., Marshall, J. A., Houck, J. R., et al. 2007, ApJ, 654, L49
- Stasińska et al. (2008) Stasińska, G., Vale Asari, N., Cid Fernandes, R., Gomes, J. M., Schlickmann, M., et al. 2008, MNRAS, 391, L29
- Sturm et al. (2006) Sturm, E., Rupke, D., Contursi, A., et al. 2006, ApJ, 653, L13
- Tommasin et al. (2008) Tommasin, S., Spinoglio, L., Malkan, M. A., et al. 2008, ApJ, 676, 836
- Tommasin et al. (2010) Tommasin, S., Spinoglio, L., Malkan, M. A., & Fazio, G., 2010, ApJ, 709, 1257
- Trinchieri et al. (1991) Trinchieri, G., & di Serego Alighieri, S. 1991, AJ, 101, 1647
- Tully (1988) Tully, R. B. 1988, Nearby Galaxy Catalogue, Cambridge University Press
- Vega et al. (2010) Vega, O., Panuzzo, P., Bressan, A., et al. 2010, ApJ, 721, 1090.
- Veilleux & Osterbrock (1987) Veilleux, S., & Osterbrock, D. E. 1987, ApJS, 63, 295
- Verhoelst et al. (2009) Verhoelst, T, van der Zypen, N., Hony, S., et al. 2009, A&A, 498, 127
- Verma et al. (2003) Verma, A., Lutz, D., Sturm, E., et al. 2003, A&A, 403, 829
- Wu et al. (2009) Wu, Y., Charmandaris, V., Huang, J., Spinoglio, L., & Tommasin, S. 2009, ApJ, 701, 658
- Yan et al. (2006) Yan, R., Newman, J. A., Faber, S. M., et al. 2006, ApJ, 648, 281