A multi-wavelength census of stellar contents in the young cluster NGC 1624
Abstract
We present a comprehensive multi-wavelength analysis of the young cluster NGC 1624 associated with the H ii region Sh2-212 using optical photometry, optical spectroscopy and GMRT radio continuum mapping along with the near-infrared (NIR) archival data. From optical observations of the massive stars, reddening and distance to the cluster are estimated to be 0.76 - 1.00 mag and kpc, respectively. Present analysis yields a spectral class of O6.5V for the main ionizing source of the region and the maximum post-main-sequence age of the cluster is estimated as 4 Myr. Detailed physical properties of the young stellar objects (YSOs) in the region are analyzed using a combination of optical/NIR colour-colour and colour-magnitude diagrams. The distribution of YSOs in NIR colour-colour diagram shows that a majority of them have 4 mag. However, a few YSOs show values higher than 4 mag. Based on the NIR excess characteristics, we identified 120 probable candidate YSOs in this region which yield a disk frequency of 20%. However, this should be considered as a lower limit. These YSOs are found to have an age spread of 5 Myr with a median age of 2-3 Myr and a mass range of 0.1 - 3.0 . A significant number of YSOs are located close to the cluster centre and we detect an enhanced density of reddened YSOs located/projected close to the molecular clumps detected by Deharveng et al. (2008) at the periphery of NGC 1624. This indicates that the YSOs located within the cluster core are relatively older in comparison to those located/projected near the clumps. From the radio continuum flux, spectral class of the ionizing source of the ultra-compact H ii (UC H ii ) region at the periphery of Sh2-212 is estimated to be B0.5V. From optical data, slope of the mass function (MF) , in the mass range can be represented by a single power law with a slope -1.18 0.10, whereas the NIR data in the mass range yields = -1.31 0.15. Thus the MF agrees fairly with the Salpeter value. The slope of the -band luminosity function (KLF) for the cluster is found to be 0.30 0.06 which is in agreement with the values obtained for other young clusters.
keywords:
stars: formation stars: luminosity function, mass function stars: premainsequence open clusters and associations: individual: NGC 1624.1 Introduction
The study of the star formation process and the origin of stellar initial mass function (IMF), defined as the distribution of stellar masses at the time of birth, are key issues in astrophysics. Since majority of stars tend to form in clusters or groups, young star clusters are considered to be the fundamental units of star formation (Lada & Lada 2003). Young star clusters are useful tool to study the IMF as they contain statistically significant number of young stars of rather similar age spanning a wide range of masses. Since these objects are not affected by the dynamical evolution as the ages of these objects are significantly less in comparison to their dynamical evolution time, the present day mass function (MF) of these objects can be considered as the IMF. However, a recent study by Kroupa (2008) argues that even in the youngest clusters, it is difficult to trace the IMF, as clusters evolve rapidly and therefore eject a fraction of their members even at a very young age.
In the last decade, there have been a large number of studies in great detail in several young clusters within 2 kpc of the Sun investigating these issues (e.g., Lada & Lada 2003, Pandey et al. 2008, Jose et al. 2008). Although the theoretical expectation is that the IMF of a cluster should depend on the location, size, metallicity, density of the star forming environment and other conditions such as temperature or pressure (Zinnecker 1986; Larson 1992; Price & Podsiadlowski 1995), for clusters located within 2 kpc, there is no compelling evidence for variation in the stellar IMF above the solar mass (e.g. Meyer et al. 2000; Kroupa 2002; Chabrier 2005).
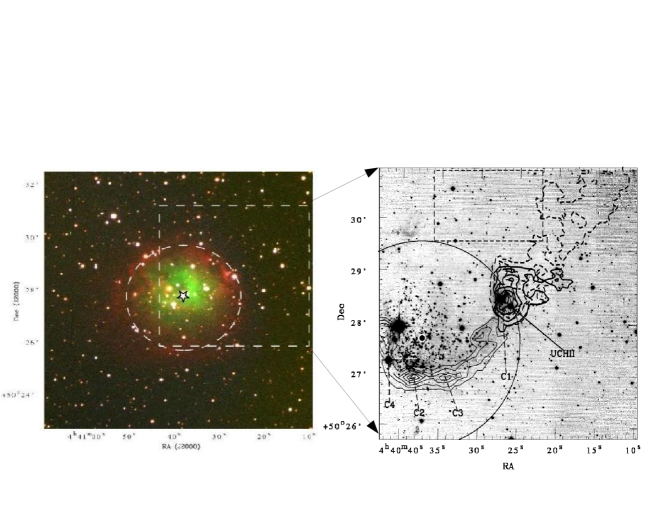
With the aim of understanding the star formation process and IMF in/around young star clusters, we selected an young cluster NGC 1624 ( = ; = ; l=155.36; b=+2.62) associated with the bright optical H ii region Sh2-212 (Sharpless 1959). A colour composite image using the bands , blue; [O iii] , green; and [S ii] , red for an area arcmin2 centered at NGC 1624 is shown in Fig. 1 (left panel), where the cluster seems to be embedded in the H ii region. The cluster is located significantly above the formal galactic plane (Z 250 pc) for an estimated distance of 6.0 kpc (cf. Sect. 5.3). The kinematic and spectrophotometric distances to NGC 1624 vary from 4.4 kpc (Georgelin & Georgelin 1970) to 10.3 kpc (Chini & Wink 1984). An IRAS point source (IRAS 04366+5022) with colours similar to that of the ultra-compact H ii (UCH ii ) region (Wood & Churchwell 1989) is located at the periphery of Sh2-212. The molecular gas distribution of this region was mapped by CO observations (Blitz et al. 1982; Leisawitz et al. 1989; Deharveng et al. 2008).
Particularly, Deharveng et al. (2008) studied the region using lines of 12CO and 13CO and reported a bright and thin semi-circular structure of molecular gas (in the velocity range -34.0 kms-1 to -32.7 kms-1) in 13CO at the rear side of Sh2-212 along with a filamentary structure (-36.8 kms-1 to -35.9 kms-1) extending from southeast to northwest. The semi-circular ring itself contains several molecular clumps, the most massive of which (-36.1 kms-1 to -35.1 kms-1) contains a massive young stellar object (YSO) which is the exciting source of the associated UCH ii region (see Fig. 1). They concluded that Sh2-212 is a good example of massive-star formation triggered via the collect and collapse process. They also reported the flow of ionized gas and suggested that this may be the indication of ‘Champagne flow’ towards the north of Sh2-212. A careful view of Fig. 1 (right panel) reveals that the central region of NGC 1624 is relatively devoid of gas and dust, whereas the outer regions, particularly east, south-east and west seem to be obscured by molecular gas. However, it is to be noted that the semi-circular structure containing clumps is located at the rear side of the cluster.
The present study is an attempt to understand the stellar content, young stellar population and the form of IMF/ -band luminosity function (KLF) of the cluster NGC 1624 associated with Sh2-212 using our optical and radio continuum observations along with the near-infrared (NIR) archival data. In Sections 2 and 3, we describe the observations, data reductions and archival data used in the present work. Sections 4 to 8 describe various cluster parameters and young stellar properties derived using optical, NIR and radio continuum data. Sections 9 and 10 describe the IMF and KLF of the region and in section 11 we have summarized the results.
2 OBSERVATIONS AND DATA REDUCTIONS
In the following sections we describe the observations and data reductions carried out in order to have a detailed study of NGC 1624.
2.1 Optical CCD Photometry
The CCD observations of NGC 1624 were carried out using Hanle Faint Object Spectrograph and Camera (HFOSC) of the 2-m Himalayan Chandra Telescope (HCT) of Indian Astronomical Observatory (IAO), Hanle, India on 2004 November 3. The 2048 2048 CCD with a plate scale of 0.296 arcsec pixel-1 covers an area of 1010 arcmin2 on the sky. We took short and long exposures in all filters to avoid saturation of bright stars. PG 0231 field from Landolt (1992) was observed to determine atmospheric extinction as well as to photometrically calibrate the CCD frames on the same night. The log of observations is tabulated in Table 1.
The CCD frames were bias-subtracted and flat-field corrected in the standard manner using various
tasks available under IRAF111IRAF is distributed by National Optical Astronomy Observatories,
USA. Aperture photometry was done for the standard stars of PG 0231 field and the following
calibration equations were derived using a least-squares linear regression:
,
,
,
,
,
where, are the instrumental magnitudes corrected for the atmospheric extinctions and are the standard magnitudes. The standard deviations of the residuals, , between standard and transformed magnitudes, , , and colours of standard stars were 0.020, 0.045, 0.018, 0.014 and 0.021 mag, respectively. Different frames of the cluster region having same exposure time and observed with the same filters were averaged. Photometry of cleaned frames was carried out using the DAOPHOT-II (Stetson 1987) profile-fitting software.
We repeated the observations of NGC 1624 in and filters to get deeper photometry on 2006 December 12 using the 104-cm Sampurnanand Telescope (ST) of Aryabhatta Research Institute of observational sciencES (ARIES), Naini Tal, India. Log of the observations is given in Table 1. The 2048 2048 CCD with a plate scale of 0.37 arcsec pixel-1 covers a field of arcmin2 on the sky. To improve the signal to noise ratio (S/N), the observations were carried out in binning mode of pixel. Secondary standards from the HCT observations were used to calibrate the data taken with ST. A combined photometry catalog is made using these two observations and this catalog has typical photometric errors of the order of 0.01 mag at brighter end ( 15), whereas the errors increase towards the fainter end ( 0.04 at 21). The catalog is available in electronic form and a sample table is given in Table 2.
In order to check the accuracy of the present photometry, we compared our photometry with the photometry of 14 stars carried out by Moffat et al. (1979). The mean and standard deviation of the difference between Moffat’s and our photometry in , and are , and , respectively, suggesting that the two photometries are in good agreement.
To study the luminosity function (LF)/MF, it is necessary to take into account the incompleteness of the present data that could occur due to various factors (e.g., crowding of the stars). We used ADDSTAR routine of DAOPHOT-II to determine the completeness factor (CF). The procedure has been outlined in detail in our earlier work (see e.g., Pandey et al. 2001). Briefly, we randomly added artificial stars to both and images taken with ST in such a way that they have similar geometrical locations but differ in brightness according to mean colour ( mag) of the data sample. Luminosity distribution of artificial stars was chosen in such a way that more number of stars were inserted towards the fainter magnitude bins. The frames were reduced using the same procedure used for the original frames. The ratio of the number of stars recovered to those added in each magnitude interval gives the CF as a function of magnitude. Minimum value of the CF of the pair (i.e., - and -bands ) for the cluster region and field region (outside the cluster region), given in Table 3, is used to correct the data incompleteness.
2.2 Spectroscopic observations
Low resolution optical spectroscopic observations of 4 optically bright sources of NGC 1624 were made using HFOSC of HCT. The log of observations is given in Table 1. The spectra in the wavelength range 3800-6840 with a dispersion of 1.45 pixel-1 were obtained using low resolution grism 7 with a slit having width 2′′. One-dimensional spectra were extracted from the bias-subtracted and flat-field corrected images using the optimal extraction method in IRAF. Wavelength calibration of the spectra were done using FeAr and FeNe lamp sources. Spectrophotometric standard (Feige 110) was observed on 2006 September 08 and flux calibration was applied to the star observed on the same night.
2.3 Radio Continuum Observations
Radio continuum observations at 1280 MHz were carried out on 2007 July 17 using the Giant Metrewave Radio Telescope (GMRT), India. GMRT has a ‘Y’ shaped hybrid configuration of 30 antennae, each of 45 m diameter. Details of the GMRT antennae and their configurations can be found in Swarup et al. (1991). For the observations, the primary flux density calibrators used were 3C48 and 3C286. NRAO Astronomical Image Processing System (AIPS) was used for the data reduction. The data were carefully checked for radio frequency interference or other problems and suitably edited. Self calibration was carried out to remove the residual effects of atmospheric and ionospheric phase corruptions and to obtain the improved maps.
3 Archival data
3.1 Near-infrared data from 2MASS
NIR data for point sources within a radius of 10 arcmin around NGC 1624 have been obtained from Two Micron All Sky Survey (2MASS) Point Source Catalog (PSC) (Cutri et al. 2003). To improve photometric accuracy, we used photometric quality flag (phqual = AAA) which gives a S/N 10 and a photometric uncertainty 0.10 mag. This selection criterion ensures best quality detection in terms of photometry and astrometry as given on the 2MASS website222http://www.ipac.caltech.edu/2mass/releases/allsky/doc/. The data were transformed from 2MASS system to the California Institute of Technology (CIT) system using the relations given by Carpenter (2001). We used this data set to calibrate the NIR archival data from Canada-France-Hawaii Telescope (CFHT) (see Sect. 3.2) and also to produce the radial density profile of NGC 1624 (see Sect. 4.2).
3.2 Near-infrared data from CFHT
NIR data for the region were obtained from the Canadian Astrophysical Data Centre’s (CADC) archive program. The NIR observations of the region were taken on 2002 October 20 (PI: L. Deharveng) using the instrument CFHT-IR at the 3.56-m CFHT. The 1024 1024 pixel HgCdTe detector with a plate scale of 0.211 arcsec/pixel was used for the observations. The catalog by Deharveng et al. (2008) lists a total of 891 sources in bands. Since our aim was to study the KLF of the region, where the estimation of the completeness of the photometry (ref. Sect. 2.1) was necessary, we re-reduced the CFHT observations. We used dithered images at 9 different locations having 10 frames at each position around the UCH ii region of this field. Flat frames and sky frames were made from the median combined object frames. The sky subtracted and flat field corrected dithered images in each band were aligned and then combined to achieve a higher S/N. The final mosaic image covers an area of with the UCH ii region at the centre and is shown in Fig. 1.
Photometry of the processed images were obtained using the DAOPHOT-II package in IRAF. Since the region was crowded, we performed PSF photometry on the images. The 2MASS counterparts of the CFHT sources were searched within a match radius of 1 arcsec. The CFHT instrumental magnitudes were compared to the selected 2MASS magnitudes to define a slope and zero point for the photometric calibration. The rms scatter between the calibrated CFHT and 2MASS data (i.e., data) for the and -bands were 0.07, 0.08 and 0.06, respectively. In order to check the photometric accuracy, we compared our photometry with the photometry reported by Deharveng et al. (2008). The average dispersion between these two samples was 0.1 mag in bands with absolutely no shift, which shows that the present photometry is in agreement with the previous study. To ensure good photometric accuracy, we limited our sample with those stars having error 0.15 mag in all three bands and thus we obtained photometry for 951 sources in and -bands. Additional 31 sources detected only in the and bands ( drop out sources) having error 0.15 mag are also included in our analysis. Data of three saturated sources have been taken from the 2MASS catalog. The detection limits were 19.0, 18.4 and 18.0 mag for , and -bands, respectively. We combined the optical and NIR catalog within a match radius of 1 arcsec and the final catalog used in the present analysis is available in electronic form and a sample table is shown in Table 2. We estimated the completeness limit of the data using the ADDSTAR routine of DAOPHOT-II. The procedure was the same as mentioned for the optical images (see Sect. 2.1). Completeness was greater than 90 for magnitudes brighter than 17.0 and reduced to 80 for the magnitude range 17.0 - 17.5 in -band. We did not find any significant spatial variation of the completeness factor within the entire area of and hence we used an average completeness factor of the region for our analysis.
4 Structure of the cluster
4.1 Two dimensional surface density distribution
The initial stellar distribution in star clusters may be governed by the structure of parental molecular cloud and also how star formation proceeds in the cloud (Chen et al. 2004, Sharma et al. 2006). Later evolution of the cluster may then be governed by internal gravitational interaction among member stars and external tidal forces due to the Galactic disk or giant molecular clouds.
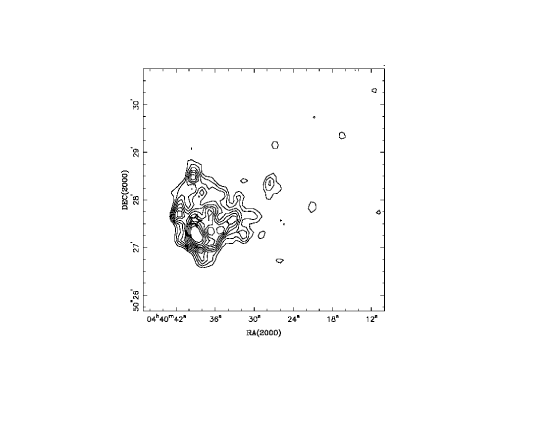
To study the morphology of the cluster, we generated isodensity contours for stars in -band from CFHT data and is shown in Fig. 2. The contours are plotted above 3-sigma value of the background level as estimated from the control field. The star mark in Fig. 2 represents the location of the cluster centre (Sect. 4.2). The surface density distribution of the CFHT data reveals prominent sub-structures which seem to be distributed symmetrically around the cluster centre at a radial distance of 35 arcsec. Interestingly, these sub-structures are lying just inside the thin molecular layer shown in Fig. 1.
4.2 Radial stellar surface density and cluster size
The radial extent of a cluster is one of the important parameters used to study the dynamical state of the cluster. We used the star count technique to study the surface density distribution of stars in the cluster region and to derive the radius of the cluster. To determine the cluster centre, we used the stellar density distribution of stars in a 30 pixel wide strip along both X and Y directions around an eye estimated centre. The point of maximum density obtained by fitting a Gaussian curve was considered as the centre of the cluster. The coordinates of the cluster centre were found to be = ; = .
To investigate the radial structure of the cluster, we derived the radial density profile (RDP) using the ST observations for 20 mag and 2MASS -band data ( 14.3 mag). Sources were counted in concentric annular rings of 30 arcsec width around the cluster centre and the counts were normalized by the area of each annulus. The densities thus obtained are plotted as a function of radius in Fig. 3, where, one arcmin at the distance of the cluster (6.0 kpc, cf. Sect. 5.3) corresponds to 1.8 pc. The upper and lower panels show the RDPs obtained from optical and 2MASS -band data, respectively. The error bars are derived assuming that the number of stars in each annulus follows Poisson statistics.
Radius of the cluster is defined as the point where the cluster stellar density merges with the field stellar density. The horizontal dashed line in Fig. 3 shows the field star density. For the optical RDP, the field star density is determined from the corner of our optical CCD image, whereas for the NIR RDP, the field star density is determined from an area which is 10 arcmin away from the cluster centre. The error limits in the field density distribution are shown using dotted lines.
To parametrize the RDP, we fitted the observed RDP with the empirical model of King (1962) which is given by
| (1) |
where is the core radius at which the surface density becomes half of the central density, . The best fit to the observed RDPs obtained by a minimization technique is shown in Fig. 3. The core radii thus estimated from optical and NIR RDPs are 0.50 0.06 and 0.48 0.05 arcmin, respectively. Within errors, the King’s profile (Fig. 3, solid curve) seems to be merging with the background field at 2.0 arcmin both for the optical and 2MASS data. Hence, we assign a radius of 2.0 arcmin for NGC 1624. Here we would like to point out that the core radius and boundary of the cluster are estimated assuming a spherically symmetric distribution of stars within the cluster. This approach is frequently used to estimate the extent of a cluster.
5 Analysis of optical data
5.1 Reddening in the cluster
To study the nature of the extinction law towards NGC 1624, we used two-colour diagrams (TCDs) as described by Pandey et al. (2003). The TCDs of the form of () versus (), where is one of the broad-band filters (), provide an effective method for separating the influence of normal extinction produced by the diffuse interstellar medium from that of the abnormal extinction arising within regions having a peculiar distribution of dust sizes (cf. Chini & Wargau 1990; Pandey et al. 2000). The values in NGC 1624 are estimated using the procedure as described in Pandey et al. (2003). The slopes of the distributions are found to be identical to the normal values as given in Pandey et al. (2003). Thus we adopt a normal reddening law () for NGC 1624.
In the absence of spectroscopic observations, the interstellar extinction towards the cluster region can be estimated using the colour-colour (CC) diagram. The CC diagram of NGC 1624 () is presented in Fig. 4, where, continuous curves represent the empirical zero-age-main-sequence (ZAMS) locus by Girardi et al. (2002). The ZAMS locus is reddened by = 0.76 and 1.00 mag along the normal reddening vector (i.e., = 0.72). Fig. 4 indicates that majority of the type stars have in the range of 0.76 - 1.00 mag. The stars lying within the reddened ZAMS may be probable members of NGC 1624. Using colour-magnitude diagram (CMD), Deharveng et al. (2008) have also reported mag for the whole region. A careful inspection of the CC diagram indicates the presence of further reddened population which could be the probable background population of the region. The theoretical ZAMS, shown by dashed line, is further shifted to match the reddened sequence. The value for the background population comes out to be 1.15 mag.
Reddening of individual stars having spectral types earlier than A0 have also been computed by means of the reddening free index (Johnson Morgan 1953). Assuming a normal reddening law we can construct a reddening-free parameter index . For stars earlier than A0, value of will be 0. For main-sequence (MS) stars, the intrinsic colour and colour-excess can be obtained from the relation (Johnson 1966; Hillenbrand et al. 1993) and , respectively. The individual reddening of the massive stars down to A0 spectral class within NGC 1624 () are found to vary in the range 0.76 - 1.05 mag implying the presence of differential reddening within the cluster. The values thus calculated for stars up to A0 spectral class have been given in Table 2. Assuming the standard deviation of the residuals (cf. Sect. 2.1) as typical errors in photometry, we estimate a typical error in estimation of as 0.05 mag.
5.2 Spectral classification of the bright sources in NGC 1624
We carried out low resolution spectroscopy of four optically bright sources within 2 arcmin radius of NGC 1624. These sources are referred as M2, M4, M9 and M8 (see Fig. 6 of Deharveng et al. 2008). The brightest source M2 is the probable ionizing source of Sh2-212 (Moffat et al. 1979). This star was identified as an emission line star of class O5e by Hubble (1922). Moffat et al. (1979) classified this object as O5.5V star, whereas Chini & Wink (1984) classified it as O6I type star. To determine the spectral type of this star, we extracted low-resolution, one dimensional spectrum. In the top panel of Fig. 5, we show the flux calibrated, normalized spectrum of the ionizing source M2 with important lines identified and labeled. Among the Balmer lines, and are relatively strong in emission compared to , which is weak in emission. The and are in absorption. The other lines found in emission are He ii 4686 and C iii 4647-50.
In the case of early type stars, the ratio of He i 4471/He ii 4542 is a primary indicator of the spectral type. This ratio is found to vary from less than 1 to 1 and greater than 1 as we move from O5 to O7 and later types. The presence of strong He ii 4542 in absorption which is often accompanied by weak N iii 4634-42 emission indicate a MS luminosity class denoted by ((f)). The absorption strength of He ii 4686 weakens while N iii emission strength increases in intermediate luminosity classes, denoted by (f) category. Finally, the Of super giants show both He ii and N iii in strong emission (Walborn & Fitzpatrick 1990).
The ratio of He i 4471/He ii 4542 for M2 is found to be (i.e., Log EW = Log (EW(He i 4471)/EW(He ii 4542)) -0.15, implying that this star is likely to be of spectral type earlier to O7. Following Conti & Alschuler (1971) we assign O6.5 0.5 spectral type to this star. The weak nature of N iii 4634-42 indicates that this star is likely to be in MS. Thus we assign a spectral class of O6.5 0.5 V for the ionizing source of Sh2-212.
The bottom panel of Fig. 5 shows the low resolution spectrum for the star M4. The absence of He ii 4200, He ii 4686 and Mg ii 4481 indicates that the spectral class of M4 is between B1-B2 (Walborn & Fitzpatrick 1990). The lack of spectral lines Mg ii 4481 and Si iii 4552 rules out the possibility of it being an evolved star. A comparison with the low resolution stellar spectra of Jacoby et al. (1984) and Walborn & Fitzpatrick (1990) suggests this star as a spectral class of B1.5 0.5 V.
The reddening slope E(B-V)/E(U-B) has also been obtained using the spectral types of the M2 (06.5V ) and M4 (B1.5V) stars. The value of the slope using the intrinsic values from Koorneef (1984) / Johnson (1966) comes out to be 0. 86 / 0.83 and 0.75 / 0.73 for M2 and M4, respectively. The reddening slope for the B type star agrees well the value obtained in Sect. §5.1. We adopt a normal reddening law in the region as mentioned in Sect. §5.1 for further analysis of the data.
We also extracted the low resolution spectra (not shown here) for the stars M8 and M9. Presence of the spectral lines Na i 5893, Ca i 6122, 6162, Fe ii 6456 and the line strength of Fe i , Ca i 6497 put these two stars in the mid F giant category based on the spectral atlas given by Torres-Dodgen & Weaver (1993) and Jacoby et al. (1984).
5.3 Optical colour-magnitude diagrams : Distance and age
The optical colour-magnitude diagrams (CMDs) are useful to derive the cluster fundamental parameters such as age, distance etc. Fig. 6 shows dereddened CMD for probable cluster members (Sect. 5.1) lying within of NGC 1624. The stars having spectral type earlier than A0 were dereddened individually using method as discussed in Sect. 5.1. The stars labeled as M2, M4, M8 and M9 (following the nomenclature by Deharveng et al. 2008) have spectroscopic observations as discussed in Sect. 5.2. The spectral class of the ionizing source (M2; see Sect. 5.2) yields intrinsic distance modulus of 14.05 which corresponds to a distance of 6.5 kpc, whereas the spectral class of M4 yields intrinsic distance modulus of 13.8 which corresponds to a distance of 5.8 kpc. The average distance from these two spectroscopically identified cluster members comes out to be 6.15 kpc. We also calculated the individual distance modulus of the remaining 12 probable MS stars (shown as filled circles in Fig. 6). The intrinsic colours for each star were estimated using the method as discussed in Sect. 5.1. Corresponding values have been estimated using the ZAMS by Girardi et al. (2002). The average value of the intrinsic distance modulus obtained from the 14 stars (2 from spectroscopy and 12 from photometry) comes out to be 13.9 0.3 which corresponds to a distance of kpc. In Fig. 6 we have also plotted the theoretical isochrone of 2 Myr (; log age = 6.3) by Girardi et al. (2002), shifted for the distance modulus of = 13.90 0.3, which seems to be matching well with the distribution of the probable MS members of the cluster. Present distance estimate is in agreement with that obtained by Moffat et al. (1979; 6.0 0.5 kpc), whereas Chini & Wink (1984) have reported a distance of 10.4 kpc to NGC 1624. The distance estimates by Moffat et al. (1979) and Chini & Wink (1984) were based on the assumed spectral class of the ionizing source M2 (i.e., O5.5V and O6I, respectively). Here, it is worthwhile to mention that the value for an O6V star in the literature varies significantly; e.g., = -5.5 (Schmidt-Kaler 1982) to -4.9 (Martins et al. 2005). Hence, the distance estimation based on the O-type star alone may not be reliable. However, the present distance estimation is carried out using the O-type star as well as all the probable members earlier to A0 spectral type. The kinematic distance (6.07 kpc) to the region derived by Caplan et al. (2000) is in agreement with the present distance estimation. Since this cluster is located in the outer galactic disk, the possibility of a low metallicity for the region cannot be ruled out, which would imply bluer intrinsic colour for the members and hence a closer distance of NGC 1624. However, in the absence of any metallicity measurements towards this region, we have considered solar metallicity for the region and the distance of NGC 1624 is taken as 6.0 kpc for the present study.
The ages of young clusters are typically derived from the post-main-sequence evolutionary tracks for the earliest members if significant evolution has occurred and/or by fitting the low-mass contracting population with theoretical PMS isochrones. Since the most massive member of NGC 1624 seems to be a O6.5 MS star, the maximum age of the cluster should be of the order of the MS life time of the massive star i.e., 4.4 Myr (Meynet et al. 1994). In Fig. 6 we have also shown the isochrone of 4 Myr age by Girardi et al. (2002), which suggests that the maximum post-main-sequence age of the cluster could be 4 Myr. Stars which deviate significantly from the isochrone are likely field stars and are shown by open circles in Fig. 6, which include stars M8 and M9. Spectroscopic observations of these two stars indicate that they are of mid F giant spectral category (see Sect. 5.2) and hence cannot be the cluster members at this assumed distance and age.
CMD for the stars lying within the core of the cluster (.5) is shown in Fig. 7a and CMD for the stars outside the core () is shown in Fig. 7b. In order to find out the field star contamination in the cluster region, we selected a control field having same area as that of the cluster from the corner of our CCD image. CMD for the control field is shown in Fig. 7c. Assuming mag, =1.0 mag and using the relations ; , we have plotted theoretical isochrone of 2 Myr by Girardi et al. (2002) and pre-main-sequence (PMS) isochrone of 0.5 and 5 Myr (Siess et al. 2000) in Fig. 7. It is evident from this figure that the MS ( 16.5) is rather free from field star contamination. Although the CMDs of the cluster region show a significant number of stars towards the right of the 2 Myr isochrone at and mag, a comparison between the cluster and field regions clearly reveals the contamination due to field star population in the CMD of the cluster region. However, the CMD of the core (Fig. 7a) reveals uncontaminated population of PMS stars having ages 0.5 - 5 Myr.
As discussed in Sect. 5.1, there is indication for a population in the background of the cluster which is apparent in Figs. 7b and 7c. Assuming the average = 1.15 mag, we estimate that the distance of the background population is 8 kpc. The study by Pandey et al. (2006) also indicates a background population at a distance of 8 kpc in the second galactic quadrant.
5.4 Emission from ionized gas
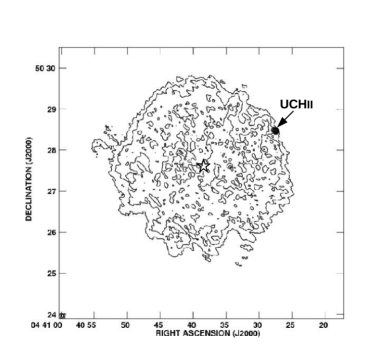
Fig. 8 shows GMRT radio continuum map of Sh2-212 at 1280 MHz made with a resolution of 4′′.9 3′′.2. In the high resolution map, most of the extended diffuse emission associated with the region appears quite faint. However, a compact intense emission can be seen at the position of UCH ii region (04h40m27s.5, +50∘28′28′′) located at the periphery of Sh2-212 and is marked using an arrow. The UCH ii region is associated with the IRAS point source IRAS 04366+5022. The overall morphology of the map agrees well with that of our optical colour composite image shown in Fig. 1. Fig. 9 shows an enlarged version of the UCH ii region at 1280 MHz. The integrated flux densities from the radio continuum contour maps for the evolved H ii region (i.e., Sh2-212) and UCH ii region are estimated to be 3.6 0.4 Jy and 16.5 0.5 mJy, respectively. Assuming the ionized regions to be spherically symmetric and neglecting absorption of ultraviolet radiation by dust inside the H ii region, the above flux densities together with assumed distance, allow us to estimate the number of Lyman continuum photons (NLyc) emitted per second, and hence the spectral type of the exciting stars. Using the relation given by Martín-Hernández et al. (2003) for an electron temperature of 10000 K, we estimated log NLyc = 48.29 and log NLyc = 45.96 for the evolved H ii and UCH ii region, respectively, which corresponds to MS spectral types of O7 and B0.5, respectively (Vacca et al. 1996). On the basis of optical spectroscopy, we estimated spectral type of the ionizing source of Sh2-212 as O6.5V (see Sect. 5.2) which is in fair agreement with the above spectral type estimation from integrated radio continuum flux. Using the spectral energy distribution, Deharveng et al. (2008) have found that the source associated with the UCH ii region is a massive YSO of B0 type ( 14 ), which is in agreement with the spectral type B0 obtained in the present work.
6 Analysis of near-infrared data
NIR data are very useful tools to study the nature of young stellar population within the star forming regions (SFRs). Discriminating young stars in clusters from field stars is difficult. Young stars with strong infrared (IR) excess from disks and envelopes can be identified using the NIR and mid-IR (MIR) observations. We used the CFHT deep NIR photometry to study the PMS contents and KLF of NGC 1624. The CFHT -band mosaic image centered on the UCH ii region covering an area of is shown in Fig. 1 (right panel), where the ionizing source is marked with a white circle. A very rich cluster is apparent around the ionizing source. Since the centre of NGC 1624 is located towards the eastern edge of the CFHT frame, eastern half of the cluster is covered partially. The observations covered an area 9.6 arcmin2 of NGC 1624 and is shown using a partial circle in Fig. 1. A region covering an area 3.1 arcmin2 towards north of the cluster shown by a box in Fig. 1, is considered as the control field. In the following sections, we discuss the NIR CC diagram and CMDs.
6.1 Colour-Colour Diagrams
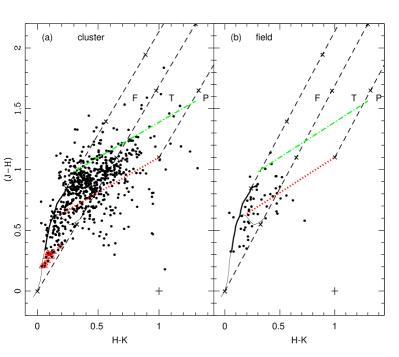
NIR and MIR photometry are useful tools to investigate the fraction of YSOs in a SFR. In the absence of ground based -band observations or Spitzer based MIR observations, we used / CC diagram to identify the young stellar population in NGC 1624 (Hunter et al. 1995; Haisch et al. 2000; 2001; Sugitani et al. 2002; Devine et al. 2008; Chavarría et al. 2010). The / CC diagrams for the cluster region (area 9.6 arcmin2) and the control field (area 3.1 arcmin2) are shown in Fig. 10. The thin and thick solid curves are the locations of unreddened MS and giant stars (Bessell Brett 1988), respectively. The dotted and dotted-dashed lines represent the locus of unreddened and reddened ( = 4.0 mag) classical T Tauri stars (CTTSs; Meyer et al. 1997). The two long parallel dashed lines are the reddening vectors for the early MS and giant type stars (drawn from the base and tip of the two branches). One more reddening vector is plotted from the tip of the unreddened CTTS locus. The crosses on the reddening vectors are separated by an value of 5 mag. The extinction ratios, and , are adopted from Cohen et al. (1981). The magnitudes, colours and the curves are in CIT system.
Presently YSOs are classified as an evolutionary sequence spanning a few million years as: Class 0/Class I - the youngest embedded protostars surrounded by infalling envelopes and growing accretion disks; Class II - PMS stars with less active accretion disks and Class III - PMS stars with no disks or optically thin remnant disk (Adams et al. 1987). Following Ojha et al. (2004a), we classified sources according to their locations in CC diagrams. The ‘F’ sources are those located between the reddening vectors projected from the intrinsic colours of MS and giant stars. These sources are reddened field stars (MS and giants) or Class III/Class II sources with little or no NIR excess (viz., weak-lined T Tauri sources (WTTSs) but some CTTSs may also be included). The sources located redward of region ‘F’ are considered to have NIR excess. Among these, the ‘T’ sources are located redward of ‘F’ but blueward of the reddening line projected from the red end of the CTTS locus. These sources are considered to be mostly CTTSs (Class II objects) with large NIR excesses (Lada & Adams 1992). There may be an overlap in NIR colours of Herbig Ae/Be stars and T Tauri stars in the ‘T’ region (Hillenbrand et al. 1992). The ‘P’ sources are those located in the region redward of region ‘T’ and are most likely Class I objects (protostellar-like) showing large amount of NIR excess. Here it is worthwhile to mention that Robitaille et al. (2006) have shown that there is a significant overlap between protostellar-like objects and CTTSs in the CC diagram.
A comparison of the colour distribution of the sources in the cluster and control field (Fig. 10) suggests that there is an appreciable difference between them. Significant fraction of sources in the cluster region are concentrated between the unreddened and reddened CTTS locus, whereas majority of sources in the control field are mainly concentrated in the ‘F’ region. Statistically, we can safely assume that majority of sources of the cluster region located between the unreddened and reddened CTTS locus are most likely to be cluster members. The comparison also indicates that the sources located in the ‘F’ region could be the reddened field stars but a majority of them are likely candidate WTTSs or CTTSs with little or no NIR excess. The sources lying towards the right side of the reddening vector at the boundary of ‘F’ and ‘T’ regions and above the unreddened CTTS locus can be safely considered as YSO/NIR excess sources. A total of 120 such sources have been detected within a region which fall in the ‘T’ region and above the unreddened CTTS locus. However, this number is certainly a lower limit for the population of YSOs, as several of the cluster members detected in the and bands have not been detected in the -band. Moreover, -band or MIR observations would further increase the detection of YSOs in the region. Hence the present photometry provides only a lower limit to the population of YSOs in NGC 1624. The distribution of YSOs in Fig. 10 manifests that majority of them have 4 mag. Some of the sources in ‘F’ and ‘T’ regions, which might be the candidate WTTSs/CTTSs, show values higher than 4 mag. The for each star lying in ‘T’ region has been estimated by tracing back to the intrinsic CTTS locus along the reddening vector. The for stars within the cluster region (area 9.6 arcmin2) and located in the ‘F’ region is estimated by tracing them back to the extension of the intrinsic CTTS locus (see Ogura et al. 2007; Chauhan et al. 2009 for details). The values thus calculated for the sources in ‘F’ and ‘T’ regions are given in Table 2. Twenty one sources are found to have 6.0 mag, indicating that significant number of cluster members in the region may still be embedded.
6.2 The colour-magnitude diagram
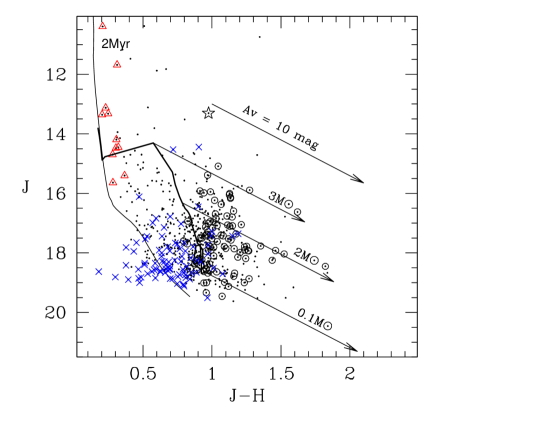
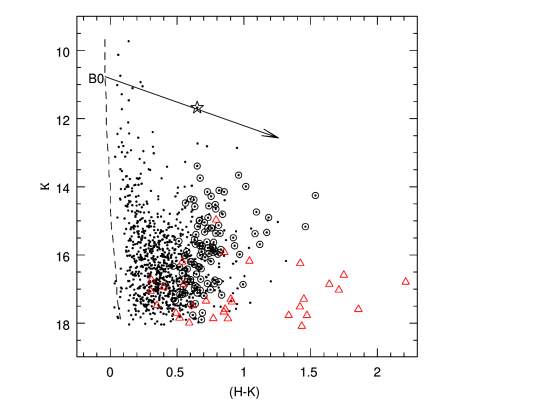
Fig. 11 shows distribution of sources within 9.6 arcmin2 area of NGC 1624. The encircled are the NIR excess sources in this region. The thick solid curve denotes the locus of 2 Myr PMS isochrone from Siess et al. (2000), which is the average age of NIR excess sources (see Sect. 7.1, Fig. 13) and the thin curve is the 2 Myr isochrone from Girardi et al. (2002). Both the isochrones are shifted for the cluster distance and reddening. The continuous oblique lines denote the reddening trajectories up to = 10 mag for PMS stars of 2 Myr age having masses 0.1, 2.0 and 3.0 , respectively. For the assumed age 2 Myr, reddening = 2.5 mag and distance = 6.0 kpc, the -band detection limit of present observations corresponds to 0.1 . In Fig. 11 majority of NIR excess sources ( 98 %) are seen to have masses in the range 0.1 to 3.0 .
The CMD indicates that the stellar population in NGC 1624 significantly comprises of low mass PMS stars similar to other SFRs studied by Ojha et al. (2004a), Sharma et al. (2007), Pandey et al. (2008) and Jose et al. (2008). These results further support the scenario that the high mass star forming regions are not devoid of low mass stars (e.g., Lada & Lada 1991; Zinnecker et al. 1993; Tapia et al. 1997; Ojha et al. 2004a). The distribution of stars located below the CTTS locus (cf. Fig. 10) is shown by crosses in Fig. 11 which indicates that a majority of these sources are likely to be field stars.
The brightest NIR excess source marked as a star symbol in Fig. 11 is the candidate ionizing source of the UCH ii region. The extinction to this star is estimated by tracing it back to the ZAMS along the reddening vector and found to be 10.6 mag. This extinction should be considered as an upper limit, as the star shows NIR excess, therefore, and magnitudes might have been affected by the NIR excess emission. The photometric spectral type of this star comes out to be B0 which is in agreement with the spectral type estimation based on our radio continuum observations (see Sect. 5.4).
7 Field star decontamination
Distinguishing cluster members from field stars is a significant challenge for photometric surveys of clusters. To study the LF/MF, it is necessary to remove field star contamination from the cluster region. Membership determination is also crucial for assessing the presence of PMS stars because both PMS and dwarf foreground stars occupy similar positions above the ZAMS in the CMDs. As discussed in Sect. 6, some of the YSOs can be identified with the help of NIR excess, however this is not true for the diskless YSOs. An alternative is to study the statistical distribution of stars in the cluster and field regions. Because proper motion studies are not available for the stars in the cluster region, we used following statistical criteria to estimate the number of probable members of NGC 1624.
To remove contamination due to field stars from the MS and PMS sample, we statistically subtracted the contribution of field stars from the observed CMD of the cluster region using the following procedure. For any star in the CMD of the control field (Fig. 7c), the nearest star in the cluster’s CMD (Figs. 7a and b) within 0.125 and 0.065 was removed. The statistically cleaned CMD (SCMD) of the cluster region is shown in Fig. 12, which clearly shows a sequence towards red side of the MS. PMS isochrones by Siess et al. (2000) for ages 0.5 and 5 Myr (dashed lines) and 2 Myr isochrone by Girardi et al. (2002) (continuous line) are shown in Fig. 12. The evolutionary tracks by Siess et al. (2000) for different masses are also shown which are used to determine the masses of PMS cluster members. Here we would like to remind the readers that the points shown by filled circles in Fig. 12 may not represent the actual members of the clusters. However, the filled circles should represent the statistics of PMS stars in the region and the statistics has been used to study the MF of the cluster region (cf. Sect. 9).
We followed the above technique for the field star decontamination of the NIR data as well. Since the area of the selected field region is smaller in comparison to the cluster region, we subdivided the cluster region in to three sub regions having area equal to the field region. The field star contamination from CMD of the cluster sub regions was subtracted using the CMD of the field region in a similar manner as in the case of CMD.
7.1 Young stellar population in NGC 1624
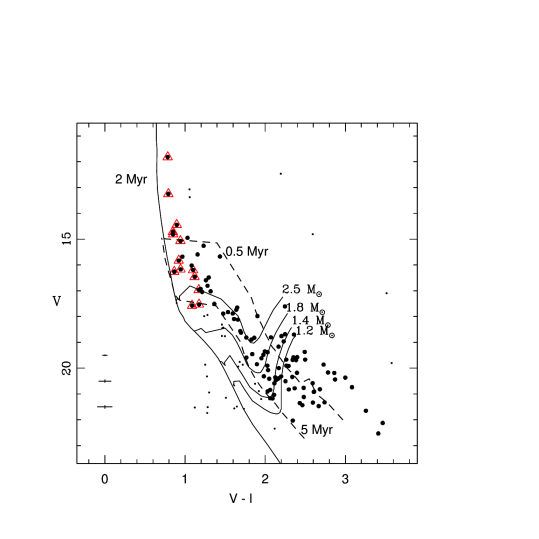
It is found that nineteen percent of the candidate PMS stars located above the intrinsic CTTS locus (cf. Fig. 10) have optical counterparts in -band within 9.6 arcmin2 area. The CMD for these sources is shown in Fig. 13. The encircled are the NIR excess sources which are the likely candidate YSOs (see Sect. 6.1). PMS isochrones by Siess et al. (2000) for 0.5, 2, 5 Myr (dashed curves) and isochrone for 2 Myr by Girardi et al. (2002; continuous curve) corrected for cluster distance and reddening are also shown. Fig. 13 reveals that majority of the sources have ages 5 Myr with a possible age spread of Myr and 75 of the NIR excess sources show ages 2 Myr. Since the reddening vector in CMD (see Fig. 13) is nearly parallel to the PMS isochrone, the presence of variable extinction in the region will not affect the age estimation significantly. Therefore the age spread indicates a possible non-coeval star formation in this region.
The membership of the YSOs shown in Fig. 13 is calculated using the following procedure. Each YSO is corrected for its reddening calculated in the Sect. 6.1. The intrinsic colour thus obtained is then compared with the PMS isochrones of varying ages from 5 Myr to 0.1 Myr. The value of each YSO is obtained from the best matching isochrone and hence the distance modulus. The sources lying within of the distance modulus obtained in Sect. 5.3 are considered as the probable cluster members. It is found that three sources do not satisfy the above criteria and has been considered as non-members. These three sources are marked using box in Fig. 13.
A comparison of Fig. 13 with the field star decontaminated CMD shown in Fig. 12 reveals a nice resemblance, suggesting that the statistics of PMS sources selected on the basis of SCMD can be used to study the IMF of PMS population of NGC 1624. As most of the sources in Fig. 13 are located in the PMS region, it can be safely assumed that the sources lying above the unreddened CTTS locus of Fig. 10 are likely cluster members. Thus sources falling in the ‘F’ region (see Fig. 10) are likely to be WTTSs or CTTSs with little or no NIR excess and those in the ‘T’ region are the candidate CTTSs with NIR excess. However, Fig. 13 does not show any trend in age distribution between these sources. A comparison of Figs. 11 and 12 confirms that most of the YSOs have masses 3.0 .
The fraction of NIR excess sources in a cluster is also an age indicator because the disks/envelopes become optically thin with age (Haisch et al. 2001; Carpenter et al. 2006; Hernández et al. 2007). For young embedded clusters having age yr, the disk fraction obtained from photometry is 50% (Lada et al. 2000; Haisch et al. 2000). Whereas the fraction reduces to 20% for the clusters with age 2 - 3 yr ( Lada & Lada 1995; Haisch et al. 2001; Teixeira et al. 2004; Oliveira et al. 2005). After correcting for the field star contamination and photometric incompleteness, the fraction of NIR excess sources in an area 9.6 arcmin2 of NGC 1624 is estimated to be 20%. There are 31 drop-out sources falling within our error criteria. Based on the colour and spatial distribution of these drop-out sources (see Sect. 8), we presume that they can be included in the list of candidate YSOs and hence the NIR excess fraction increases to 25%. This suggests an age of 2 - 3 yr for this cluster which is in agreement with the age estimation derived using the PMS evolutionary tracks in the optical CMD (cf. Fig. 13). This NIR excess fraction is to be considered as a lower limit to the actual YSO fraction of the cluster as we do not have -band observations for this cluster. However, Yasui et al. (2009) point out that the disk fraction from only data are about 0.6 of those from data and the lifetime estimation from data is basically identical to that from data. Therefore, despite a little larger uncertainty, the disk fraction from data alone should still be effective even without -band data. Here it is worthwhile to point out that in the case of Cep OB3B, Getman et al. (2009) have shown that the disk frequency depends on the distance from the exciting stars, as massive stars can photo-evaporate the disk around young stars. Also, Carpenter et al. (2006) have found evidence for mass dependent circumstellar disk evolution in the sense that the mechanism for disk dispersal operates less efficiently for low mass stars. Hence, keeping in mind the uncertainties mentioned above, the age estimation based on the disk frequency must be considered as an approximate estimation.
In order to check if there is any mass dependence of the NIR excess fraction, we divided the optically identified PMS members (shown in Fig. 13) in to three mass bins i.e., 2.5 - 1.5 , 1.5 - 1.0 and 1.0 - 0.6 using the evolutionary tracks by Siess et al. (2000). After applying the completeness correction in each magnitude bin, we obtained the NIR excess fraction as 23%, 24% and 37%, respectively for the above mentioned mass bins. Hence, there is an evidence of mass dependent evolution of circumstellar disk as explained by Carpenter et al. (2006). However, this estimation has to be considered as a lower limit, as only 19% of the identified NIR PMS stars have the optical counterparts.
Deharveng et al. (2005; 2008) have identified signs of recent star formation in Sh2-212. They estimated the age of the massive star associated with the UCH ii region located at the periphery of Sh2-212 as 0.14 Myr on the basis of dynamical size of the UCH ii region. This indicates that the UCH ii region is relatively young as compared to the YSOs within the cluster region. The bright rim feature at one end of the UCH ii region (see Fig. 2 of Deharveng et al. 2008) also suggests that the UCH ii region might have formed at a later evolutionary stage of the H ii region as a second generation object.
8 Spatial distribution of YSOs
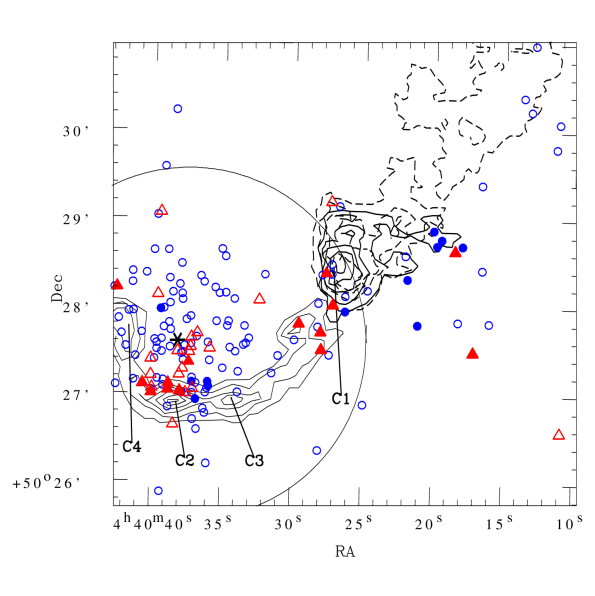
Fig. 14 displays the spatial distribution of YSOs (blue circles; likely Class II sources) identified on the basis of NIR excess characteristics (cf. Fig. 10) along with the CO emission contour map from Deharveng et al. (2008) for four condensations and filament. The drop-out sources are shown using red triangles. The molecular condensations make a semi-circular ring towards the southern side of Sh2-212. Fig. 14 reveals that majority of YSOs are located close to the cluster centre within a radius of 0.5 arcmin (i.e., within the cluster core radius of 0.9 pc; cf. Sect. 4.2), however, several other YSOs are found to be distributed outside of this radius along the thin semi-circular ring and filamentary structure. Interestingly, there is an apparent concentration of YSOs just at the boundary of the clump C2.
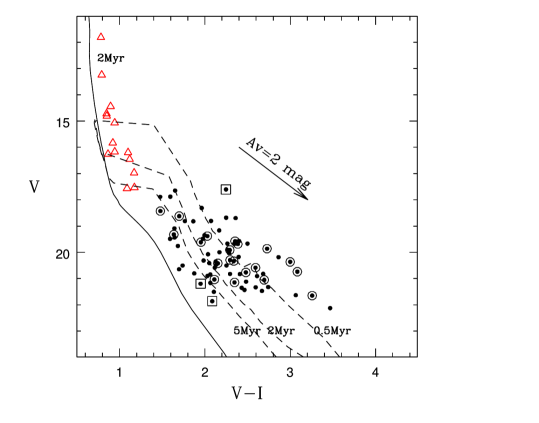
In Fig. 15 we have shown the CMD for all the sources detected in this region. The encircled are the YSOs and the red triangles are the drop-out sources. It is evident from the CMD that majority of YSOs have colour in the range 0.6 - 0.8 mag. However a significant number of sources appear to be redder ( mag). The spatial distribution of sources having mag has been shown in Fig. 14 with filled circles (i.e., YSOs) and triangles ( drop-out sources), respectively and this figure reveals a higher density of reddened sources near the clump C2. The larger value of ( 1.0 mag) could be either due to higher extinction, as most of these sources are lying within/very close to the CO distribution, or could be their intrinsic colour due to large NIR excess.
If the origin of this colour excess is merely from the interstellar extinction, then one must expect an increment in the value of by 12 mag as compared to the sources located close to the cluster center. In order to investigate the spatial distribution of extinction in the region, we plot radial variation of in Fig. 16 (left panel). It is evident from the Fig. 16 that is almost constant within an 80 arcsec cluster radius. Hence, we can presume that the origin of colour excess could be intrinsic in nature. This fact indicates an age sequence in the sense that YSOs located/projected over the semi-circular ring of molecular condensations are younger than those lying within the core of the cluster.
To further elucidate the youth of the YSOs located/projected over the semi-circular ring of molecular condensations, we plot radial variation of NIR excess, , defined as the horizontal displacement from the reddening vector at the boundary of ‘F’ and ‘T’ regions (see Fig. 10). NIR excess is considered to be a function of age. An enhancement in the mean value of at 45 arcsec, i.e., near the periphery of the semi-circular ring is apparent in Fig. 16 (middle panel). In the right panel we plot the radial variation of colour of YSOs and drop-out sources using dashed and solid histogram, respectively. The enhancement in the mean value at the same location is apparent in this figure as well. However, we have to keep in mind the possibility of photo-evaporation of the disk around YSOs lying within the core of the cluster due to stellar radiation of massive star at the centre of the cluster.
The above facts indicate that the sources near the molecular material are intrinsically redder and support the scenario of possible sequential star formation towards the direction of molecular clumps. It is interesting to mention that the distribution of YSOs in the NGC 1624 region is rather similar to the distribution of Class II sources in other star forming regions. e.g., RCW 82 (Pomarès et al. 2009), RCW 120 (Zavagno et al. 2007) and Sh2-284 (Puga et al. 2009). Majority of Class I sources in the case of RCW 82 and RCW 120 are found to be associated with the molecular material at their periphery and none are found around the ionizing source. The association of Class I sources with the molecular material manifests the recent star formation at their periphery. If star formation in Sh2-212 region is similar in nature to RCW 82 and RCW 120, one would expect a significant number of Class I sources in the surrounding molecular material. Unfortunately, the absence of MIR observations hampers the detailed study of the probable young sources lying towards the collected molecular material. However, the YSOs having mag, which are expected to be the youngest sources of the region, are found to be distributed around the molecular clumps detected by Deharveng et al. (2008). It is interesting to mention that in the case of RCW 82, the YSOs having mag are found to be associated with the molecular emission surrounding the H ii region. Many of these sources are not observed in the direction of molecular emission peaks, but are located on the borders of the condensations (Pomarès et al. 2009). A similar distribution of YSOs (having ) can be seen in the present study at the border of the clump C2.
According to Deharveng et al. (2008), the massive YSO associated with the UCH II region (clump C1) might have formed as a result of the collect and collapse process due to the expansion of the H ii region. If the sources lying towards the molecular clump C2 and along the filament are formed as a result of the collect and collapse process, these sources must be younger than the ionization source by about 2 - 3 Myr as the model calculation by Deharveng at al. (2008) predicts the fragmentation of the collected layer after 2.2 - 2.8 Myr of the formation of the massive star in Sh2-212. Since the ionization source is an O6.5 0.5 MS star, the maximum age of the ionization source should be of the order of its MS life time, i.e., 4.4 Myr (cf. Sect. 5.3). On the basis of the present analysis we can indicate that the sources with seem to have a correlation with the semi-circular ring of molecular condensations and should be younger than the age of the ionization source of the region. However in the absence of optical photometry, the reliable age estimation of these YSOs is not possible. Since the distribution of youngest YSOs on the border of clump C2 has a resemblance to the distribution of Class I/ II YSOs in RCW 82, the formation of these YSOs could be due to the result of small-scale Jeans gravitational instabilities in the collected layer, or interactions of the ionization front with the pre-existing condensations as suggested by Pomarès et al. (2009) cannot be ignored.
9 Initial Mass Function
The distribution of stellar masses that form in a star formation event in a given volume of space is called IMF and together with star formation rate, the IMF dictates the evolution and fate of galaxies and star clusters (Kroupa 2002). Young clusters are important tools to study IMF since their MF can be considered as IMF as they are too young to loose significant number of members either by dynamical or stellar evolution. To study the IMF of NGC 1624 we used the data within .
The MF is often expressed by the power law, and the slope of the MF is given as
where is the number of stars per unit logarithmic mass interval. For the mass range , the classical value derived by Salpeter (1955) for the slope of MF is, .
Since the NIR data is deeper, we expect to have a better detection of YSOs towards the fainter end in comparison to the optical data. Therefore we estimated the IMF using the optical and NIR data independently.
9.1 IMF from optical data
With the help of SCMD shown in Fig. 12, we can derive the MF using theoretical evolutionary models. A massluminosity relation is needed to convert the derived magnitude for each star to a mass. For the MS stars (see Fig. 6), LF was converted to MF using the theoretical model by Girardi et al. (2002) for 2 Myr (cf. Pandey et al. 2001; 2005). The MF for PMS stars was obtained by counting the number of stars in various mass bins (shown as evolutionary tracks in Fig. 12). Necessary corrections for data incompleteness were taken into account for each magnitude bin to calculate the MF. The MF of NGC 1624 is plotted in Fig. 17. The slope, of the MF in the mass range can be represented by a power law. The slope of the MF for the mass range comes out to be, = , which is slightly shallower than the Salpeter value (-1.35). We conclude that within an acceptable margin, the slope of IMF for the cluster NGC 1624 is comparable to the Salpeter (1955) value.
9.2 IMF from NIR data
We also estimate the IMF using J -band luminosity function (JLF). We preferred -band over -band as the former is least affected by the NIR excess. After removing the field star contamination using the statistical subtraction as explained in Sect. 7, we applied the completeness correction to the -band data. Assuming an average age of 2 Myr for the PMS stars, distance 6.0 kpc and average reddening = 2.5 mag, the magnitudes were converted to mass using the 2 Myr PMS isochrone by Siess et al. (2000). For MS stars, the mass-luminosity relation is taken from Girardi et al. (2002). Completeness of the -band data was 90 % at = 18 mag ( 0.65 ). In Fig. 18, we have shown the MF derived for NGC 1624 (within the area of 9.6 arcmin2) in the mass range . The linear fit gives a slope = which is in agreement with the Salpeter (1955) value. The MF ( = ) derived using optical data is slightly shallower than that of IR data. However both the slopes are within error and can be considered to be in agreement.
Here we would like to point out that the estimation of IMF depends on the models used. We are pursuing studies of few young clusters, hence a comparative study of IMFs of various young clusters obtained using similar techniques will give useful information about IMFs. Our recent studies on young clusters (age Myr), viz., NGC 1893 (Sharma et al. 2007), Be 59 (Pandey et al. 2008) and Stock 8 (Jose et al. 2008) have yielded the value of for stars more massive than 1 - 2 as -1.27 0.08, -1.01 0.11 and -1.38 0.12, respectively. A comparison of the MF in the case of NGC 1624 and the clusters mentioned above indicates that the MF slope towards massive end (i.e., M ) in general, is comparable to the Salpeter value (-1.35).
10 K-band luminosity function
The KLF is frequently used in studies of young clusters as a powerful tool to constrain its age and IMF. Pioneering work on the interpretation of KLF was presented by Zinnecker et al. (1993). During the last decade several studies have been carried out with the aim of determining the KLF of young clusters (e.g., Muench et al. 2000; Lada & Lada 2003; Ojha et al. 2004b; Sanchawala et al. 2007; Sharma et al. 2007; Pandey et al. 2008; Jose et al. 2008). We have used CFHT -band data to study the KLF of NGC 1624. Because the CFHT observations did not include the entire cluster region, we restricted the KLF study to a region within 9.6 arcmin2 area of NGC 1624 (see Sect. 6).
In order to convert the observed KLF to the true KLF, it is necessary to correct the data incompleteness and field star contamination. We applied the CF (see Sect. 3.2) for the data incompleteness. The control field having an area 3.1 arcmin2 shown in Fig. 1 has been used to remove the field star contribution. We applied a correction factor to take into account the different areas of cluster and control field regions. The field star population towards the direction of NGC 1624 is also estimated by using the Besançon Galactic model of stellar population synthesis (Robin et al. 2003) using a similar procedure as described by Ojha et al. (2004b). The star counts were predicted using the Besançon model towards the direction of the control field. An advantage of using this model is that we can simulate foreground ( kpc) and background ( kpc) field star populations separately. The use of this model allows us to apply the extra cloud extinction to the background stars. The foreground population was simulated using the model with = 2.36 mag ( mag; ref. Sect. 5.1) and kpc. The background population ( kpc) was simulated with an extinction value = 4.0 mag (see Sect. 6.1). Thus we determined the fraction of the contaminating stars (foreground + background) over the total model counts. The scale factor we obtained to the control field direction was close to 1.0 in all the magnitude bins. This indicates that the moderate extinction of 4.0 mag is unlikely to have any significant effect on the field star distribution at this distance. Hence, we proceeded our analysis of KLF with the field star counts obtained from the observed control field. The completeness corrected and field star subtracted KLF for NGC 1624 is shown in Fig. 19.
The KLFs of young embedded clusters are known to follow power-law shapes (Lada et al. 1991; 1993) which is expressed as:
where is the number of stars per 0.5 mag bin and is the slope of the power law. The KLF for NGC 1624 shown in Fig. 19 (solid line), yields a slope for the range = 13.5 - 17.5 mag, which is slightly lower than the average value of slopes () for young clusters of similar ages (Lada et al. 1991; Lada & Lada 1995; Lada & Lada 2003). However, a break in the power law can be noticed at = 15.75 mag and the KLF seems to be flat in the magnitude range 15.75 - 17.5. The slope of the KLF in the magnitude range 13.5 - 15.75 (dahsed line in Fig. 19) comes out to be 0.44 0.11 which is comparable with the average value of slopes for young clusters. A turn off in the KLF has also been observed in a few young clusters. e.g., at 14.5 mag and 16.0 mag in the case of Tr 14 (distance 2.5 Kpc; Sanchawala et al. 2007) and NGC 7538 (distance 2.8 Kpc; Ojha et al. 2004), respectively.
KLF slope is an age indicator of young clusters. For clusters up to 10 Myr old, the KLF slope gets steeper as the cluster gets older (Ali & Depoy 1995; Lada & Lada 1995). However, there is no precise age - KLF relationship in the literature due to huge uncertainty in their correlation (Devine et al. 2008). There are many studies on KLF of young clusters. The studies by Blum et al. 2000; Figuerêdo et al. 2002; Leistra et al. 2005; 2006; Devine at al. 2008 indicate that the KLF slope varies from 0.2 -0.4 for clusters younger than 5 Myr. The KLF of NGC 1624 is worth comparing with the recent studies of young clusters viz; NGC 1893 (Sharma et al. 2007), Be 59 (Pandey et al. 2008) and Stock 8 (Jose et al. 2008), since all the KLFs are obtained using a similar technique. The slope of the KLF () obtained for NGC 1624 in the magnitude range 13.5 - 17.5 is comparable with those obtained for NGC 1893 (), Stock 8 () and Be 59 ().
11 Summary
We have carried out a comprehensive multi-wavelength study of the young cluster NGC 1624 associated with the H ii region Sh2-212. Sh2-212 is thought to have experienced ‘Champagne flow’ and the molecular clumps along with the UCH ii region at the periphery are suggested as the possible outcome of the collect and collapse phenomena. In our present study, an attempt has been made to determine the basic properties of NGC 1624 as well as to study the nature of stellar contents in the region using optical photometry, optical spectroscopy of four stars, radio continuum observations from GMRT along with NIR archival data from 2MASS and CFHT.
From optical observations of massive stars, reddening () in the direction of NGC 1624 is found to vary between 0.76 to 1.00 mag and distance is estimated to be kpc. The maximum post-main-sequence age of the cluster is estimated as 4 Myr. Present spectroscopic analysis of the ionizing source indicates a spectral class of O6.5V. We used colour criteria to identify sources with NIR excess and found 120 candidate YSOs in the region. Majority of the YSOs have 4.0 mag and masses in the range 0.1 - 3.0 . Distribution of these YSOs on the CMD indicates an age spread of 0.5 - 5 Myr with an average age of 2-3 Myr, suggesting non-coeval star formation in NGC 1624. The lower limit for the NIR excess fraction on the basis of data is found to be 20% which indicates an average age 2 - 3 Myr for YSOs in NGC 1624. From the radio continuum flux, spectral type of the ionizing source of the UCH ii region is estimated to be B0.5V.
A significant number of YSOs are located close to the cluster centre and a few YSOs are seen to be located/projected over the molecular clumps detected by Deharveng et al. (2008), as well as farther away from the clumps. We detect an enhanced density of reddened YSOs located/projected close to the molecular clump C2. The NIR excess and colour distribution of these sources show indication of an age sequence in the sense that the YSOs located/projected near the clump C2 are younger than those located within the cluster core.
The slope of the MF, , derived from optical data, in the mass range can be represented by -1.18 0.10. Whereas NIR data, in the mass range yields = -1.31 0.15. Thus MF fairly agrees with the Salpeter value (-1.35). Slope of the KLF for NGC 1624 in the magnitude range 13.5 - 17.5 is found to be 0.30 0.06 which is smaller than the average value (0.4) obtained for young clusters of similar ages (Lada et al. 1991; Lada & Lada 1995; Lada & Lada 2003), however, agrees well with the values 0.27 0.02 for Be 59 (Pandey et al. 2008); 0.34 0.07 for NGC 1893 (Sharma et al. 2007) and 0.31 0.02 for Stock 8 (Jose et al. 2008). However, there is a clear indication of break in the power law at =15.75 mag. The KLF slope in the magnitude range 13.5 - 15.75 can be represented by and the KLF slope is found to be flat in the magnitude range 15.75 - 17.5.
12 Acknowledgments
Authors are thankful to the referee Dr. Antonio Delgado for his useful comments which has improved contents and presentation of the paper significantly. We thank the staff of IAO, Hanle and its remote control station at CREST, Hosakote, ARIES, Naini Tal, and GMRT, Pune, India for their assistance during observations. This publication makes use of data from the Two Micron All Sky Survey, which is a joint project of the University of Massachusetts and the Infrared Processing and Analysis Center/California Institute of Technology, funded by the National Aeronautics and Space Administration and the National Science Foundation. This research used the facilities of the Canadian Astronomy Data Centre operated by the National Research Council of Canada with the support of the Canadian Space Agency. We thank Annie Robin for letting us use her model of stellar population synthesis. JJ is thankful for the financial support for this study through a stipend from the DST and CSIR, India.
13 REFERENCES
Adams F. C., Lada C. J., Shu F. H. 1987, ApJ, 312, 788
Ali, B., Depoy, D. L., 1995, AJ, 109, 709
Bessell, M., Brett, J. M., 1988, PASP, 100, 1134
Blitz, L., Fich, M., Stark, A. A., 1982, ApJS, 49, 183
Blum, R. D., Conti, P. S., Damineli, A., 2000, AJ, 119, 1860
Caplan, J., Deharveng, L., Peña, M., Costero, R., Blondel, C., 2000, MNRAS, 311, 317
Carpenter, J. M., 2001, AJ, 121, 2851
Carpenter, J. M., Mamajek, E. E., Hillenbrand, L. A., Meyer, M. R. 2006, ApJ, 651, L49
Chabrier, G., 2005, The Initial Mass Function 50 Years Later, 327, 41
Chavarría, L., Mardones, D., Garay, G., Escala, A., Bronfman, L., Lizano, S., 2010, ApJ, 710, 583
Chauhan, N., Pandey, A. K., Ogura, K., Ojha, D. K., Bhatt, B. C., Ghosh, S. K., Rawat, P. S., 2009, MNRAS,396,964
Chini, R., Wink, J.E., 1984, A&A, 139, L5
Chini, R., Wargau, W. F., 1990, A&A, 227, 213
Cohen, J. G., Persson, S. E., Elias, J. H., Frogel, J. A., 1981, ApJ, 249, 481
Conti, P.S., Alschuler, W. R., 1971, ApJ, 170, 325
Cutri, R. M., Skrutskie, M. F., van Dyk, S., et al., 2003, The IRSA 2MASS All
Sky Point Source Catalog, NASA/IPAC Infrared Science Archive,
http://irsa.ipac.caltech.edu/applications/Gator/
Deharveng, L., Zavagno, A., Caplan, J. 2005, A&A, 433, 565
Deharveng, L., Lefloch, B., Kurtz, S., Nadeau, D., Pomarès, M., Caplan, J., Zavagno, A., 2008, A&A, 482, 585
Devine, K. E., Churchwell, E. B., Indebetouw, R., Watson, C., Crawford, S. M., 2008, AJ, 135, 2095
Figuerêdo, E., Blum, R. D., Damineli, A., Conti, P. S., 2002, AJ, 124, 2739
Georgelin, Y. M., Georgelin, Y. P., 1970, A&A, 6, 349
Getman, K. V., Feigelson, E. D., Luhman, K. L., Sicilia-Aguilar, A., Wang, J., Garmire, G. P., 2009, ApJ, 699, 1454
Girardi, L., Bertelli, G., Bressan, A., Chiosi, C., Groenewegen, M. A. T., et al., 2002, A&A, 391, 195
Haisch, K. E., Lada, E. A., Lada, C. J., 2000, AJ, 120, 1396
Haisch, K. E., Lada, E. A., Lada, C. J., 2001, AJ, 121, 2065
Hernández, J., Hartmann, L., Megeath, T., Gutermuth, R., Muzerolle, J., 2007, ApJ, 662, 1067
Hillenbrand, L. A., Strom, S. E., Vrba, F. J., Keene, J., 1992, ApJ, 397, 613
Hillenbrand, L. A., Massey, P., Strom, S. E., Merrill, K. M., 1993, AJ, 106, 1906
Hubble E., 1922, ApJ, 56, 400
Hunter, T. R., Testi, L., Taylor, G. B., Tofani, G., Felli, M., Phillips, T. G., 1995, A&A, 302, 249
Jacoby, G. H., Hunter, D. A., Christian, C. A., 1984, ApJS, 56, 257
Johnson, H. L. Morgan, W. W., 1953, ApJ, 117, 313
Johnson, H. L., 1966, ARA&A, 4, 193
Jones, B. F., Herbig, G. H., 1979, 84, 1872
Jose, J., et al., 2008, MNRAS, 384, 1675
King, I., 1962, AJ, 67, 471
Kroupa, P., 2002, SCIENCE, 295, 82
Kroupa P., 2008, in Knapen J. H., Mahoney T. J., Vazdekis A., eds, ASP Conf. Ser. Vol. 390, Pathways Through an Eclectic Universe. Astron. Soc. Pac., San Francisco, p. 3
Lada, C. J., Lada, E. A., 1991, in ASP Conf. Ser. 13, The Formation and Evolution of Star Clusters, ed. K. Janes (San Francisco: ASP), 3
Lada, C. J., Adams, F. C., 1992, ApJ, 393, 278
Lada, C. J., Young, T., Greene, T., 1993, ApJ, 408, 471
Lada, E . A . Lada, C . J., 1995, AJ , 109, 1682
Lada, C. J. et al., 2000, AJ, 120, 3162
Lada, C. J., Lada E. A., 2003, ARA&A, 41, 57
Landolt A.U., 1992, AJ, 104, 340
Larson, R. B., 1992, MNRAS, 256, 641
Leisawitz D., Bash F. N., Thaddeus P., 1989, ApJS, 70, 731
Leistra, A., Cotera, A. S., Liebert, J., 2006, AJ, 131, 2571
Leistra, A., Cotera, A. S., Liebert, J., Burton, M., 2005, AJ, 130, 1719
Martín-Hernández, N. L., van der Hulst, J. M., Tielens, A. G. G. M., 2003, A&A, 407, 957
Martins, F., Schaerer, D., Hillier, D. J., 2005, A&A, 436, 1049
Meyer, M., Calvet, N., Hillenbrand, L. A., 1997, AJ, 114, 288
Meyer, M. R., Adams, F. C., Hillenbrand, L. A., Carpenter, J. M., Larson, R. B., 2000, Protostars and Planets IV, 121
Meynet, G., Maeder, A., 2005, A&A, 429, 581
Moffat, A. F. J., Fitzgerald, M. P., Jackson, P. D., 1979, A&AS, 38, 197
Muench, A. A., Lada, E.A., Lada, C.J., 2000, ApJ, 553, 338
Muench, A. A. et al., 2003, AJ, 125, 2029
Ogura K., Chauhan N., Pandey A.K., Bhatt B.C., Ojha D.K., Itoh Y., 2007, PASJ, 59, 199
Ojha, D. K., Tamura, M., Nakijama, Y., et al., 2004a, ApJ, 608, 797
Ojha, D. K., Tamura, M., Nakajima, Y., et al, 2004b, ApJ, 616, 1042
Oliveira, J. M., Jeffries, R. D., van Loon, J. Th., Littlefair, S. P., Naylor, T., 2005, MNRAS, 358, L21
Pandey, A. K., Ogura, K., Sekiguchi, K., 2000, PASJ, 52, 847
Pandey A.K., Nilakshi, Ogura K., Sagar R., Tarusawa K., 2001, A&A, 374, 504
Pandey, A. K., Upadhyay, K., Nakada, Y., Ogura, K., 2003, A&A, 397, 191
Pandey, A. K., Upadhyay, K., Ogura, K., Sagar, R., Mohan, V. et al., 2005, MNRAS, 358, 1290
Pandey, A. K., Sharma, S., Ogura, K., Ojha, D. K., Chen, W. P. et al., 2008, MNRAS, 383, 1241
Pomarès, M., Zavagno, A., Deharveng, L., Cunningham, M., Jones, P., Kurtz, S. et al., 2009, A&A, 494, 987
Price, N. M., Podsiadlowski, Ph., 1995, MNRAS, 273, 1041
Puga, E., Hony, S., Neiner, C., Lenorzer, A., Hubert, A.-M. et al., 2009, A&A, 503, 107
Robin, A. C., Reyle, C., Derriere, S., Picaud, S., 2003, A&A, 409, 523
Robitaille, T. P., Whitney, B. A., Indebetouw, R., Wood, K., Denzmore, P., 2006, ApJS, 167, 256
Salpeter, E.E., 1955, ApJ, 121, 161
Sanchawala, K. et al., 2007, ApJ, 667, 963
Schmidt-Kaler, Th. 1982, Landolt-Bornstein, Vol. 2b, ed. K. Schaifers, H. H. Voigt, H. Landolt (Berlin: Springer), 19
Sharma, S., Pandey, A. K., Ojha, D. K., Chen, W. P., Ghosh, S. K., Bhatt, B. C., Maheswar, G., Sagar, R., 2007, MNRAS, 380, 1141
Sharpless, S., 1959, ApJS, 4, 257
Siess, L., Dufour, E., Forestini, M., 2000, A&A, 358, 593
Stetson, P. B., 1987, PASP, 99, 191
Sugitani, K. et al., 2002, ApJ, 565, L25
Swarup, G., Ananthkrishnan, S., Kaphi, V. K., Rao, A. P., Subrhmanya, C. R., Kulkarni, V. K., 1991, Current Science, 60, 95
Tapia, M., Persi, P., Bohigas, J., Ferrari-Toniolo, M., 1997, AJ, 113, 1769
Teixeira, P. S., Fernandes, S. R., Alves, J. F., Correia, J. C., Santos, F. D., Lada, E. A., Lada, C. J., 2004, A&A, 413, L1
Torres-Dodgen, Ana V., Weaver, W. B., 1993, PASP, 105, 693
Vacca, W. D., Garmany, C. D., Shull, J. M., 1996, A&A, 460, 914
Walborn, N. R., Fitzpatrick, E. L., 1990, PASP, 102, 379
Wood, D. O. S., Churchwell, E., 1989, 340, 265
Yasui, C., Kobayashi, N., Tokunaga, A. T., Saito, M., Tokoku, C., 2009, ApJ, 705, 54
Zavagno, A., Pomarès, M., Deharveng, L., Hosokawa, T., Russeil, D., Caplan, J., 2007, A&A, 472, 835
Zinnecker, H., 1986., IMF in starburst regions. In light on Dark Matter, ed. F.P.Israel, ApSS Library Vol. 124, pp.277-278
Zinnecker, H., McCaughrean, M. J., Wilking, B. A., 1993, in Protostars and Planets III, ed. E. Levy & J. Lunine (Tucson: Univ. Arizona Press), 429
| Date of | Filter | Exposure time | ||
|---|---|---|---|---|
| (h:m:s) | () | observation | (s)no. of frames | |
| HCT1 | ||||
| 04:40:38 | +50:27:36 | 2004.11.03 | 6003 | |
| 04:40:38 | +50:27:36 | 2004.11.03 | 3003, 601, 201 | |
| 04:40:38 | +50:27:36 | 2004.11.03 | 1203, 101 | |
| 04:40:38 | +50:27:36 | 2004.11.03 | 603, 101 | |
| 04:40:38 | +50:27:36 | 2004.11.03 | 603, 101, 51 | |
| 04:40:38 | +50:27:36 | 2007.01.26 | [S ii] | 4501 |
| 04:40:38 | +50:27:36 | 2007.01.26 | [O iii] | 4501 |
| 04:40:37 | +50:27:41 | 2006.09.08 | Gr7/167l | 9001 |
| 04:40:39 | +50:27:18 | 2007.01.26 | Gr7/167l | 6001 |
| 04:40:35 | +50:28:44 | 2007.01.26 | Gr7/167l | 7501 |
| 04:40:32 | +50:27:54 | 2007.01.26 | Gr7/167l | 7501 |
| ST2 | ||||
| 04:40:38 | +50:27:36 | 2006.12.12 | 30010 | |
| 04:40:38 | +50:27:36 | 2006.12.12 | 3005 |
1 2-m Himalayan Chandra Telescope, IAO, Hanle
2 104-cm
Sampurnanand Telescope, ARIES, Naini Tal
| star | |||||||||||
|---|---|---|---|---|---|---|---|---|---|---|---|
| ID | (h:m:s) | () | |||||||||
| 1 | 04:39:46.271 | +50:30:00.70 | 18.415 | - | - | - | 1.611 | - | - | - | - |
| 2 | 04:39:46.320 | +50:22:03.89 | 21.320 | - | - | - | 1.865 | - | - | - | - |
| 3 | 04:39:46.320 | +50:22:23.00 | 20.893 | - | - | - | 1.887 | - | - | - | - |
| … | ….. | ….. | ….. | ….. | ….. | ….. | ….. | ….. | …… | ….. | |
| … | ….. | ….. | ….. | ….. | ….. | ….. | ….. | ….. | …… | ….. | |
| 1155 | 04:40:32.181 | +50:27:53.40 | 13.067 | 0.396 | 0.917 | 0.542 | 1.055 | 11.172 | 10.838 | 10.728 | 3.1* |
| … | ….. | ….. | ….. | ….. | ….. | ….. | ….. | ….. | …… | ….. |
for the marked sources have been obtained using optical photometry
| V range | NGC 1624 | Field region |
|---|---|---|
| (mag) | r | |
| 11 - 12 | 1.00 | 1.00 |
| 12 - 13 | 1.00 | 1.00 |
| 13 - 14 | 1.00 | 1.00 |
| 14 - 15 | 1.00 | 1.00 |
| 15 - 16 | 1.00 | 1.00 |
| 16 - 17 | 0.98 | 0.98 |
| 17 - 18 | 0.98 | 0.97 |
| 18 - 19 | 0.90 | 0.95 |
| 19 - 20 | 0.90 | 0.93 |
| 20 - 21 | 0.80 | 0.89 |
| 21 - 22 | 0.55 | 0.61 |