Magneto-optics of bilayer graphene inclusions in rotational-stacked
multilayer epitaxial graphene
Abstract
Additional component in multi-layer epitaxial graphene grown on the C-terminated surface of SiC, which exhibits the characteristic electronic properties of a AB-stacked graphene bilayer, is identified in magneto-optical response of this material. We show that these inclusions represent a well-defined platform for accurate magneto-spectroscopy of unperturbed graphene bilayers.
pacs:
71.55.Gs, 76.40.+b, 71.70.Di, 78.20.LsI Introduction
The absence of the energetic gap in the excitation spectrum of grapheneNovoselov (2007) is considered as a possible drawback preventing the straightforward application of this emerging material in electronics. This is despite numerous efforts, such as those implying surface patterningBai et al. (2010) and substrate- or adsorbents-induced interactions.Zhou et al. (2007); Bostwick et al. (2007); Balog et al. (2010) The possibility to open and tune the band gap in the bilayer graphene has recently been demonstrated by applying an electric field perpendicular to the graphitic planesKuzmenko et al. (2009); Mak et al. (2009); Zhang et al. (2009) and this is a key element to construct a transistor, the building block of electronic circuits. The band gap engineering is “typical” of the bilayer and is not reported in tri- and more-layer graphene specimens where semi-metallic behavior dominates.Craciun et al. (2009) From the viewpoint of applications, the bilayer graphene thus becomes almost equally appealing material as graphene itself.
Optical spectroscopy has played an important role in investigations of the bilayer graphene,Zhang et al. (2008); Li et al. (2009); Kuzmenko et al. (2009) as, for instance, it allows to directly visualize the electric-field induced energy gap in this system.Zhang et al. (2009); Mak et al. (2009) On the other hand, only relatively scarce information has been up to now collected from magneto-optical measurements.Henriksen et al. (2008) This fact might be surprising when noticing the potential of Landau level (LL) spectroscopy which has been widely applied to other graphene-like systems. Magneto-optical methods have, for example, convincingly illustrated the unconventional LL spectrum in graphene, have offered a reliable estimate of the Fermi velocity or invoked the specific effects of many-body interactions between massless Dirac fermions.Sadowski et al. (2006); Jiang et al. (2007); Deacon et al. (2007); Orlita et al. (2008); Neugebauer et al. (2009); Henriksen et al. (2010); Crassee et al. (2010)
So far, the only magneto-optical experiments on the bilayer graphene have been reported by Henriksen et al.,Henriksen et al. (2008) who succeeded to probe a relatively weak cyclotron-resonance signal of a small flake using the gate-controlled differential technique. The optical response at a fixed magnetic field was then studied as a function of the carrier density. Such differential spectroscopy was efficient in case of exfoliated graphene monolayers,Jiang et al. (2007); Henriksen et al. (2010) but it provides more complex results when applied to the bilayer graphene. In this latter system, the change of the gate voltage affects not only the carrier density but also modifies significantly the band structure and data interpretation is by far more elaborated.Mucha-Kruczynski et al. (2009)
In this paper, we demonstrate that certain class of previously reported AB-stacking faultsFaugeras et al. (2008); Sprinkle et al. (2009, 2010); Siegel et al. (2010) in otherwise rotationally-ordered multilayer epitaxial graphene (MEG),Berger et al. (2004); Hass et al. (2008); Sadowski et al. (2006); Miller et al. (2009) show the characteristic features of well-defined graphene bilayers. These inclusions, identified here in magneto-transmission experiments, represent therefore a suitable system for accurate magneto-spectroscopy studies of unperturbed bilayer graphene.
II Sample preparation and experimental details
The growth of MEG samples studied here was performed with a commercially available horizontal chemical vapor deposition hot-wall reactor (Epigress V508), inductively heated by a RF generator. Epitaxial MEG films were grown on semi-insulating 4H-SiC(0001̄) on-axis C-terminated substrates at 1600∘C in Ar atmosphere. The growth rate was controlled by the Ar pressure (100 mbar) which was found to directly influence the evaporation rate of Si atoms.
To measure the infrared transmittance of our samples, we used the radiation of a globar, which was analyzed by a Fourier transform spectrometer and delivered to the sample via light-pipe optics. The transmitted light was detected by a composite bolometer kept at K and placed directly below the sample. Measurements were carried out in superconducting ( T) and resistive ( T) solenoids with spectral resolution of 0.5 and 1 meV in the range of magnetic field below and above T, respectively. All presented spectra were normalized by the sample transmission at .
The samples were characterized in micro-Raman scattering experiments which, similarly to previous studies,Faugeras et al. (2008) revealed, depending on location, single-component 2D band features, characteristic of graphene simple electronic bands and of decoupled graphitic planes in multilayer epitaxial graphene grown on the C-face of a SiC substrate, or multi-component 2D band features characteristic of Bernal stacked graphite. In this paper, we present transmission data obtained on one particular specimen with a high number of graphitic layers () and grown on a SiC substrate with a reduced thickness of m. Due to this latter condition, the spectral region of total opacity of the sample only covers the SiC reststrahlenband (85-120 meV), i.e., it is significantly narrower as compared to the case of the preceding studies.Sadowski et al. (2007); Plochocka et al. (2008) In spite of these efforts to expand the available spectral range, a relatively weak transmission was still found around the energy of 200 meV, due to double-phonon absorptions in the underlying SiC substrate and transmission spectra are affected by strong interference patterns due to the relatively thin substrate. These two effects prevented measurements in the energy range below the reststrahlenband of SiC.
III Results and Discussion
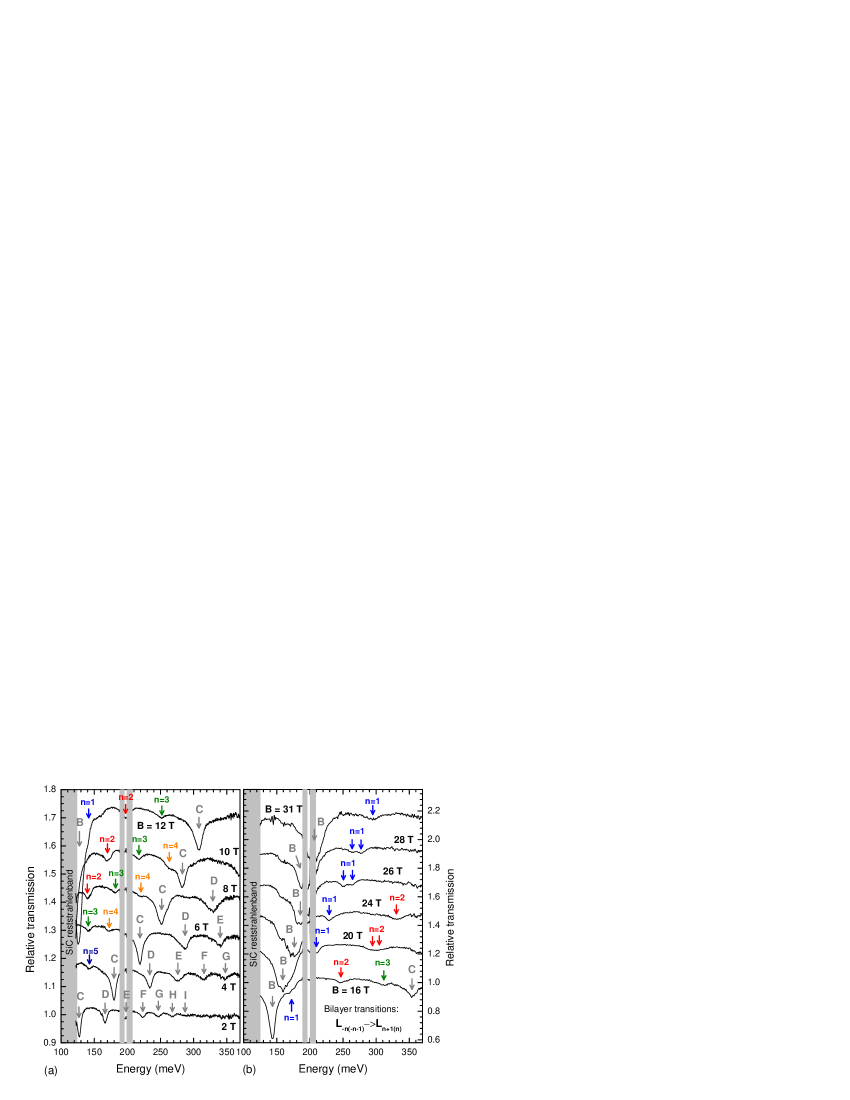
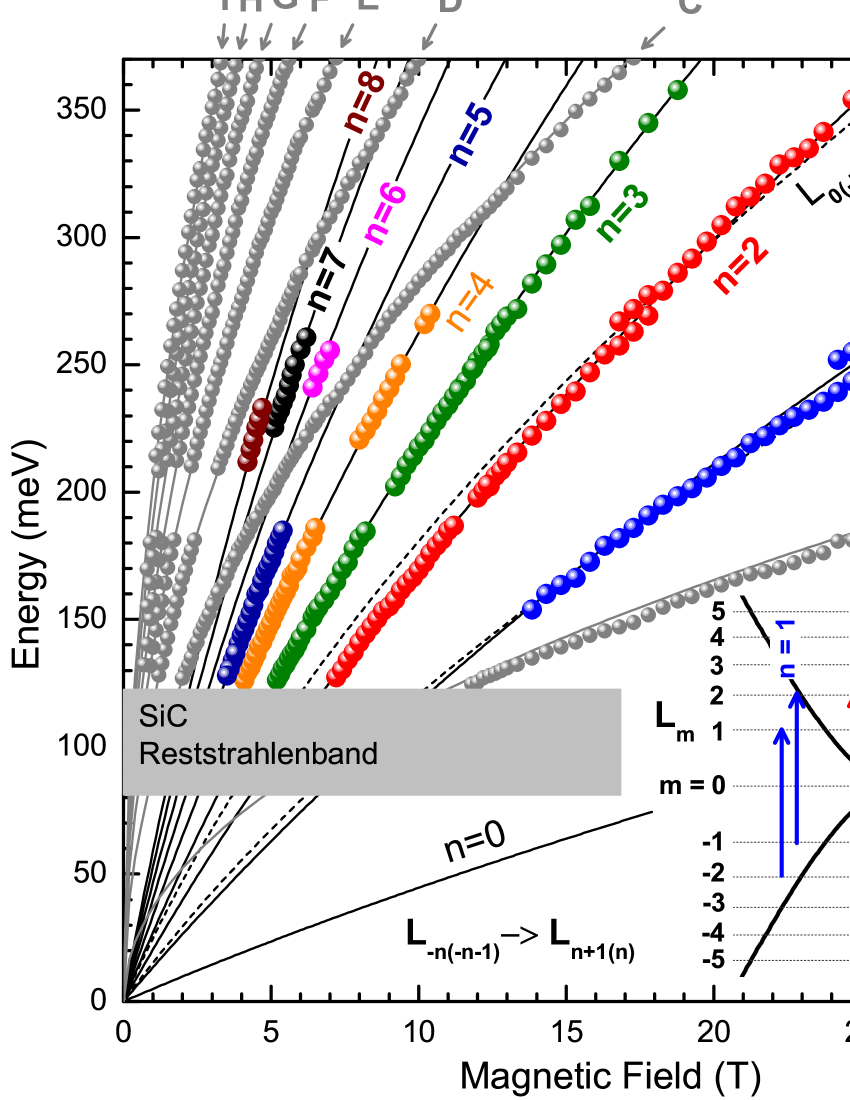
Typical transmission spectra of the investigated sample are shown in Fig. 1. The dominant absorption lines which are observed in these spectra show the characteristic -dependence (see Fig. 2) and correspond to inter-LL transitions in electrically isolated graphene sheets. We denote those lines by Roman letters, following the initial work and notation of Sadowski et al.Sadowski et al. (2006, 2007) These dominant spectral features are equivalent to the characteristic lines observed in the magneto-optical response of exfoliated graphene monolayers.Jiang et al. (2007); Deacon et al. (2007); Henriksen et al. (2010) The subsequent absorption lines labelled here as B I correspond to transitions LLm+1(m) with between LLs in graphene: , where . The apparent Fermi velocity is extracted to be m.s-1. Intriguingly, the LL0(1) transition exhibits a significant broadening above 16 T, which could be tentatively related to electron-phonon interaction. This effect will be discussed elsewhere.
The main focus of the present work are other spectral features, i.e., the transmission dips denoted by n=1, n=2, …n=5 in Fig. 1. These absorption lines are significantly weaker than the dominant “graphene lines”, but are still well resolved in our spectra. As it can be seen in Fig. 2, in contrast to the dominant transitions, these weaker lines follow a nearly linear in dependence. As this behavior is characteristic of massive particles and because graphene bilayer is the simplest graphene based system with such particles, we anticipate that electronic excitations within graphene bilayer inclusions are responsible for the n=1, n=2, …n=5 transitions. The energy ladder of LLs in a graphene bilayer can be easily calculatedAbergel and Fal’ko (2007); Koshino and Ando (2008) within the standard four band model which only considers the two most relevant coupling constants and (se e.g. Ref. McCann and Fal’ko, 2006 for their definitions):
| (1) |
Here, a positive (negative) integer indexes the electron (hole) LLs. accounts for the topmost valence- and the lowest conduction-band, whereas corresponds to two other, split-off bands. As illustrated in the inset of Fig. 2, optically active inter Landau level transitions in a graphene bilayer fulfill the selection rule. The energies of such transitions are plotted in Fig. 2 with black solid lines. Those lines account for the transitions within the bands. To reproduce the experimental data, we have adjusted the parameter whereas the Fermi velocity which defines (i.e. the intra-layer coupling meV) has been fixed at the value derived from the monolayer-like transitions. A fair agreement is obtained between the calculated (solid lines in Fig. 2) and measured energies of n=1, n=2, …n=5 transitions. Optical absorptions involving LLs of higher indexes (e.g. n=6, n=7 and n=8, see Fig. 2) could also be observed in the spectra, nevertheless, these lines are very weak and only visible in a limited range of magnetic fields. Traces of inter-LL transitions due to split-off bands ( in Eq. 1), can be also identified in our data and experiments focused on this particular set of transitions are in progress.
A pronounced departure of the observed bilayer transitions from the linearity in clearly shows the limits of the parabolic approximation which is often used for graphene bilayers in the close vicinity of the point, and within which the LLs are strictly linear with the magnetic field.McCann and Fal’ko (2006); Novoselov et al. (2006) As can be seen in Fig. 2, the positions of all these lines can be very well reproduced with a parameter meV, and these experiments thus refine the value of this parameter reported previously from optical studies at zero magnetic field.Zhang et al. (2008); Kuzmenko et al. (2009); Li et al. (2009) The intriguing splitting of the n=1 and of the n=2 lines at high magnetic fields is beyond our simple model and will be discussed later on.
The simplified model of LLs in the pristine bilayer graphene provides us with reasonably accurate description of its magneto-optical response, even though it neglects the electron-hole asymmetry (mainly induced by tight-binding parameters),Zhang et al. (2008); Li et al. (2009); Kuzmenko et al. (2009); Zhang et al. (2009) as well as a possible gap opening at the charge neutrality point. Nevertheless, it should be noted that the optical response of the graphene bilayer has only been unambiguously identified above the reststrahlenband of the SiC substrate and therefore, we cannot exclude a possible appearance of an energy gap, up to a few tens of meV, at the point. For the same reason, we can only estimate a very higher limit for the carrier density in the studied bilayer of cm-2. However, the real carrier density is very likely similar to that of the surrounding (electrically isolated) graphene sheets, i.e. below cm-2, as reported in Refs. Orlita et al., 2008 and Sprinkle et al., 2009. We also point out that relatively narrow linewidths of the order of 10 meV (relaxation time in sub-picosecond range) serve as an indication of rather high electronic quality of these bilayer inclusions, comparable or even better than other bilayer systems.Henriksen et al. (2008); Ohta et al. (2006); Riedl et al. (2009)
Equivalent bilayer-like spectral features are recurrently identified practically in all studied specimens, nevertheless, with a strongly varying intensity. In general, we can say that the relative intensity of these “bilayer” lines increases with the total number of layers in MEG and these transitions are practically invisible in specimens with less than 10 layers reported in very first magneto-spectroscopy studies.Sadowski et al. (2006, 2007) This finding serves as an indication that we indeed observe graphene bilayer inclusions and not regions of a local AB-stacking which might be also speculated to appear in rotationally stacked multilayers. Such Moiré-patterned AB-stacked areas have been recently visualized in MEG by STM/STS measurements.Miller et al. (2010a, b); Kindermann and First (2010) We further assume that twisted graphene layers which results in the Moiré patterned bilayer should not provide us with so well-defined AB stacked bilayers as we observe in our data. Let us also note that if we compare the relative intensity of observed transitions, we can roughly estimate that in none of the investigated samples the ratio between bilayers and monolayers exceeded 10%.
We should also emphasize that the appearance of Bernal-stacked faults in MEG, which have a form of well-defined bilayers, is not a signature of bulk graphite. In this well known material, the -point electrons indeed mimic massive carriers in the graphene bilayer, but with an effective inter-layer coupling instead of in a real graphene bilayer.Partoens and Peeters (2007); Koshino and Ando (2008); Orlita et al. (2009); Chuang et al. (2009) This twofold coupling in the effective bilayer model for point electrons implies a characteristic effective mass twice enhanced in comparison to that of massive Dirac fermions in true graphene bilayer and consequently, also a twice lower energy separation between adjacent interband inter-LL transitions, cf. Fig. 2 of this paper with the fan chart in Ref. Orlita et al., 2009.
The remaining unclarified point of our study is the splitting of the bilayer lines, which is clearly visible for transitions n=1 and n=2 around and 26 T, respectively. In the following, we discuss two different scenarios for this splitting. One possible explanation invokes the electron-hole asymmetry, reported recently in graphene bilayers graphene.Zhang et al. (2008); Li et al. (2009); Kuzmenko et al. (2009) Based on this assumption, the magnitude of the splitting for the -th transition, relative to the transition energy is expressed by:cal
For the values , , ,Zhang et al. (2008); Li et al. (2009); Kuzmenko et al. (2009); Zhang et al. (2009); Mak et al. (2009) our measured value for (about 0.08) is very well reproduced. However, the splitting due to electron-hole asymmetry should be seen for all magnetic fields, while, as can be seen in Fig. 1b, we only observe it in a relatively narrow range of .
Perhaps a more natural explanation for this line splitting would be an avoided crossing between the transition and some other transition with a much smaller oscillator strength, so that it is not seen far from the crossing point. One can see directly from Fig. 2 that the bright transitions are crossed by the dark (i.e., dipole-inactive in case of a zero trigonal warping) transitions , , respectively, approximately at the observed values of (the crossing occurs at a very sharp angle, which brings a significant uncertainty). These transitions are allowed only due to the presence of the trigonal warping of the electronic bands, which mixes levels with differing by an integer multiple of , see Ref. Abergel and Fal’ko, 2007. The ratio of the oscillator strength of the transition to that of the bright transition can be estimated cal as at T. The transition is therefore not expected to be seen in the experiment unless some other, possibly resonant, admixture mechanism is taken into account. Coupling between and transitions should be quite strong as the observed “anti-crossing splitting” is of about 20 meV.
We have speculated this mode coupling could be due to electron-phonon or electron-electron interactions. Electron-phonon interaction, which could be enhanced due to the proximity of the transition energy (250 meV) to that of the zone-center optical phonon (196 meV), must be excluded due to the different symmetry (this phonon is Raman active). Splitting due to Coulomb interaction can be evaluated to be ,cal i.e. only about 3 meV in the absence of dielectric screening, . Hence, the mechanism of the possible strong coupling between the and transitions is a puzzle which remains to be clarified.
IV Conclusions
We probed graphene bilayers embedded in multilayer epitaxial graphene on the C-terminated surface of SiC. These inclusions can be viewed as AB-stacked faults in an otherwise rotationally-stacked multilayer graphene structure and enable spectroscopic studies of unperturbed graphene bilayers. The “electronic quality” of these bilayers is comparable or even better than that of the bilayers obtained by exfoliation or by epitaxial growth on the Si-terminated surface of SiC.Ohta et al. (2006); Riedl et al. (2009) This way, we could trace the inter-band inter-LL transitions in the graphene bilayer for the first time, and thus supply data complementary to the cyclotron resonance absorption (i.e., intra-band inter-LL transitions) measured on the exfoliated bilayer by Henriksen et al.Henriksen et al. (2008) We could also clearly visualize the departure of Landau levels in the graphene bilayer from the linearity in , which clearly sets limits for the parabolic approximation of electronic bands in this material.
Acknowledgements.
We acknowledge also funding received from EC-EuroMagNetII under Contract No. 228043, from the Keck Foundation and from the Partner University Fund at the Embassy of France. This work has been supported by the Projects No. 395/NPICS- FR/2009/0, No. MSM0021620834, GACR No. P204/10/1020 and No. MTKD-CT-2005-029671, furthermore by Grants No. 670/N-ESF-EPI/2010/0, No. 671/NESF-EPI/2010/0, and No. GRA/10/E006 within the ESF EuroGraphene programme (EPIGRAT).References
- Novoselov (2007) K. S. Novoselov, Nature Mater. 6, 720 (2007).
- Bai et al. (2010) J. Bai, X. Zhong, S. Jiang, Y. Huang, and X. Duan, Nature Nanotechnology 5, 190 (2010).
- Zhou et al. (2007) S. Y. Zhou, G.-H. Gweon, A. V. Fedorov, P. N. First, W. A. de Heer, D.-H. Lee, F. Guinea, A. H. C. Neto, and A. Lanzara, Nature Mater. 6, 770 (2007).
- Bostwick et al. (2007) A. Bostwick, T. Ohta, T. Seyller, K. Horn, and E. Rotenberg, Nature Phys. 3, 36 (2007).
- Balog et al. (2010) R. Balog, B. Jorgensen, L. Nilsson, M. Andersen, E. Rienks, M. Bianchi, M. Fanetti, E. Lagsgaard, A. Baraldi, S. Lizzit, et al., Nature Materials 9, 315 (2010).
- Kuzmenko et al. (2009) A. B. Kuzmenko, E. van Heumen, D. van der Marel, P. Lerch, P. Blake, K. S. Novoselov, and A. K. Geim, Phys. Rev. B 79, 115441 (2009).
- Mak et al. (2009) K. F. Mak, C. H. Lui, J. Shan, and T. F. Heinz, Phys. Rev. Lett. 102, 256405 (2009).
- Zhang et al. (2009) Y. Zhang, T.-T. Tang, C. Girit, Z. Hao, M. C. Martin, A. Zettl, M. F. Crommie, Y. R. Shen, and F. Wang, Nature 459, 820 (2009).
- Craciun et al. (2009) M. F. Craciun, S. Russo, M. Yamamoto, J. B. Oostinga, A. F. Morpurgo, and S. Tarucha, Nature Nanotech. 4, 383 (2009).
- Zhang et al. (2008) L. M. Zhang, Z. Q. Li, D. N. Basov, M. M. Fogler, Z. Hao, and M. C. Martin, Phys. Rev. B 78, 235408 (2008).
- Li et al. (2009) Z. Q. Li, E. A. Henriksen, Z. Jiang, Z. Hao, M. C. Martin, P. Kim, H. L. Stormer, and D. N. Basov, Phys. Rev. Lett. 102, 037403 (2009).
- Henriksen et al. (2008) E. A. Henriksen, Z. Jiang, L.-C. Tung, M. E. Schwartz, M. Takita, Y.-J. Wang, P. Kim, and H. L. Stormer, Phys. Rev. Lett. 100, 087403 (2008).
- Sadowski et al. (2006) M. L. Sadowski, G. Martinez, M. Potemski, C. Berger, and W. A. de Heer, Phys. Rev. Lett. 97, 266405 (2006).
- Jiang et al. (2007) Z. Jiang, E. A. Henriksen, L. C. Tung, Y.-J. Wang, M. E. Schwartz, M. Y. Han, P. Kim, and H. L. Stormer, Phys. Rev. Lett. 98, 197403 (2007).
- Deacon et al. (2007) R. S. Deacon, K.-C. Chuang, R. J. Nicholas, K. S. Novoselov, and A. K. Geim, Phys. Rev. B 76, 081406R (2007).
- Orlita et al. (2008) M. Orlita, C. Faugeras, P. Plochocka, P. Neugebauer, G. Martinez, D. K. Maude, A.-L. Barra, M. Sprinkle, C. Berger, W. A. de Heer, et al., Phys. Rev. Lett. 101, 267601 (2008).
- Neugebauer et al. (2009) P. Neugebauer, M. Orlita, C. Faugeras, A.-L. Barra, and M. Potemski, Phys. Rev. Lett. 103, 136403 (2009).
- Henriksen et al. (2010) E. A. Henriksen, P. Cadden-Zimansky, Z. Jiang, Z. Q. Li, L.-C. Tung, M. E. Schwartz, M. Takita, Y.-J. Wang, P. Kim, and H. L. Stormer, Phys. Rev. Lett. 104, 067404 (2010).
- Crassee et al. (2010) I. Crassee, J. Levallois, A. L. Walter, M. Ostler, A. Bostwick, E. Rotenberg, T. Seyller, D. van der Marel, and A. B. Kuzmenko, arXiv:1007.5286 (2010).
- Mucha-Kruczynski et al. (2009) M. Mucha-Kruczynski, E. McCann, and V. Fal’ko, Solid State Commun. 149, 1111 (2009).
- Faugeras et al. (2008) C. Faugeras, A. Nerrière, M. Potemski, A. Mahmood, E. Dujardin, C. Berger, and W. A. de Heer, Appl. Phys. Lett. 92, 011914 (2008).
- Sprinkle et al. (2009) M. Sprinkle, D. Siegel, Y. Hu, J. Hicks, A. Tejeda, A. Taleb-Ibrahimi, P. L. Fevre, F. Bertran, S. Vizzini, H. Enriquez, et al., Phys. Rev. Lett. 103, 226803 (2009).
- Sprinkle et al. (2010) M. Sprinkle, J. Hicks, A. Tejeda, A. Taleb-Ibrahimi, P. L. Fevre, F. Bertran, H. Tinkey, M. Clark, P. Soukiassian, D. Martinotti, et al., arXiv:1001.3869 (2010).
- Siegel et al. (2010) D. A. Siegel, C. G. Hwang, A. V. Fedorov, and A. Lanzara, Phys. Rev. B 81, 241417 (2010).
- Berger et al. (2004) C. Berger, Z. Song, T. Li, X. Li, A. Y. Ogbazghi, R. Feng, Z. Dai, A. N. Marchenkov, E. H. Conrad, P. N. First, et al., J. Phys. Chem. B 108, 19912 (2004).
- Hass et al. (2008) J. Hass, F. Varchon, J. E. Millán-Otoya, M. Sprinkle, N. Sharma, W. A. de Heer, C. Berger, P. N. First, L. Magaud, and E. H. Conrad, Phys. Rev. Lett. 100, 125504 (2008).
- Miller et al. (2009) D. L. Miller, K. D. Kubista, G. M. Rutter, M. Ruan, W. A. de Heer, P. N. First, and J. A. Stroscio, Science 324, 924 (2009).
- Sadowski et al. (2007) M. L. Sadowski, G. Martinez, M. Potemski, C. Berger, and W. A. de Heer, Solid State Commun. 143, 123 (2007).
- Plochocka et al. (2008) P. Plochocka, C. Faugeras, M. Orlita, M. L. Sadowski, G. Martinez, M. Potemski, M. O. Goerbig, J.-N. Fuchs, C. Berger, and W. A. de Heer, Phys. Rev. Lett. 100, 087401 (2008).
- Abergel and Fal’ko (2007) D. S. L. Abergel and V. I. Fal’ko, Phys. Rev. B 75, 155430 (2007).
- Koshino and Ando (2008) M. Koshino and T. Ando, Phys. Rev. B 77, 115313 (2008).
- McCann and Fal’ko (2006) E. McCann and V. I. Fal’ko, Phys. Rev. Lett. 96, 086805 (2006).
- Novoselov et al. (2006) K. S. Novoselov, E. McCann, S. V. Morozov, V. I. Fal’ko, K. I. Katsnelson, U. Zeitler, D. Jiang, F. Schedin, and A. K. Geim, Nature Phys. 2, 177 (2006).
- Ohta et al. (2006) T. Ohta, A. Bostwick, T. Seyller, K. Horn, and E. Rotenberg, Science 313, 951 (2006).
- Riedl et al. (2009) C. Riedl, C. Coletti, T. Iwasaki, A. A. Zakharov, and U. Starke, Phys. Rev. Lett. 103, 246804 (2009).
- Miller et al. (2010a) D. L. Miller, K. D. Kubista, G. M. Rutter, M. Ruan, W. A. de Heer, P. N. First, and J. A. Stroscio, Phys. Rev. B 81, 125427 (2010a).
- Miller et al. (2010b) D. L. Miller, K. D. Kubista, G. M. Rutter, M. Ruan, W. A. de Heer, M. Kindermann, P. N. First, and J. A. Stroscio, Nature Phys. p. to be published (2010b).
- Kindermann and First (2010) M. Kindermann and P. N. First, arXiv:1009.4492 (2010).
- Partoens and Peeters (2007) B. Partoens and F. M. Peeters, Phys. Rev. B 75, 193402 (2007).
- Orlita et al. (2009) M. Orlita, C. Faugeras, J. M. Schneider, G. Martinez, D. K. Maude, and M. Potemski, Phys. Rev. Lett. 102, 166401 (2009).
- Chuang et al. (2009) K.-C. Chuang, A. M. R. Baker, and R. J. Nicholas, Phys. Rev. B 80, 161410(R) (2009).
- (42) This expression is obtained in the two-band approximation. The degree of error introduced by this approximation at energies about 250 meV can be roughly estimated from the deviation of the curves in Fig. 2 from their low-field tangents, which gives about 30%.