Measurement of a Metallicity Gradient in a Galaxy:
Implications for Inside-Out Assembly Histories
Abstract
We present near-infrared imaging spectroscopy of the strongly-lensed galaxy SDSS J120601.69+514227.8 (‘the Clone arc’). Using OSIRIS on the Keck 2 telescope with laser guide star adaptive optics, we achieve resolved spectroscopy with 0.20 arcsecond FWHM resolution in the diagnostic emission lines [Oiii], H, and [Nii]. The lensing magnification allows us to map the velocity and star formation from H emission at a physical resolution of pc in the galaxy source plane. With an integrated star formation rate of yr-1, the galaxy is typical of sources similarly studied at this epoch. It is dispersion-dominated with a velocity gradient of km s-1 and average dispersion km s-1; the dynamical mass is within a half-light radius of 2.9 kpc. Robust detection of [Nii] emission across the entire OSIRIS field of view enables us to trace the gas-phase metallicity distribution with 500 pc resolution. We find a strong radial gradient in both the [Nii]/H and [Oiii]/H ratios indicating a metallicity gradient of dex kpc-1 with central metallicity close to solar. We demonstrate that the gradient is seen independently in two multiple images. While the physical gradient is considerably steeper than that observed in local galaxies, in terms of the effective radius at that epoch, the gradient is similar. This suggests that subsequent growth occurs in an inside-out manner with the inner metallicity gradient diminished over time due to radial mixing and enrichment from star formation.
Subject headings:
galaxies: high-redshift — galaxies: evolution — gravitational lensing: strong1. Introduction
Considerable progress is being made with integral field unit (IFU) spectrographs on large telescopes in unraveling the internal properties of star-forming galaxies over . During this period, the mass assembly of galaxies proceeds at a rapid pace and such measures promise valuable insight into the physical mechanisms by which young galaxies grow. Early effort has focused on the dynamical properties (e.g. Förster Schreiber et al. 2009; Law et al. 2009; Jones et al. 2010; Gnerucci et al. 2010). These studies have revealed systems which are dispersion-dominated with varying degrees of ordered rotation consistent with sources which may develop stable disks and central stellar bulges. The turbulent motions may be associated with vigorous star-formation driven by cold molecular gas accreted along filaments from the nearby intergalactic medium (Tacconi et al., 2010). The highest resolution data, secured by coupling the angular magnification of strong gravitational lensing with laser-assisted guide star adaptive optics (LGSAO), has revealed the sizes of star-forming regions in 2-3 galaxies suggesting that star formation is primarily triggered by gravitational instability rather than external mergers (Stark et al., 2008; Jones et al., 2010; Swinbank et al., 2010).
Attention is now shifting to understanding the evolution of the mass-metallicity relation (Tremonti et al., 2004). Metallicity is a key parameter which gauges the baryonic material already converted into stars thus offering insight into feedback processes proposed to regulate star formation. The trend is usually explained via star-formation driven outflows, e.g. from energetic supernovae, which have a larger effect in low mass galaxies with weaker gravitational potentials. However, other effects may be responsible at high redshifts where star formation timescales and feedback processes and their mass dependences differ. Much effort has been invested in measuring evolution in the relation using the integrated light from samples beyond (Erb et al., 2006; Halliday et al., 2008; Mannucci et al., 2009; Hayashi et al., 2009). These pioneering surveys have shown that metallicity decreases with redshift for a fixed stellar mass.
A logical next step in developing a picture of the assembly history of disk galaxies would be to extend the kinematic progress made with IFU spectrographs to resolved measures of the gas phase metallicity. This would enable the tracking of metallicity gradients as a function of redshift and provide a direct test of models of star formation and assembly induced by cold gas inflows (Brooks et al., 2007). However, even with LGSAO, the spatial sampling for representative 2-3 galaxies is 1 kpc and insufficient for this purpose. Prior to large telescopes with improved diffraction-limited performance, gravitationally-lensed sources offer a natural starting point (c.f. Stark et al. 2008). In this Letter we examine the practicality of this approach via a detailed study of the gravitationally-lensed arc SDSS J120602.09+51422, referred to as the ‘Clone’ arc (Lin et al., 2009). Hubble Space Telescope (HST) images and spectroscopic follow-up by Lin et al. (2009) confirm this to be a =2.001 star-forming galaxy with intrinsic half-light radius kpc and SFR yr-1, magnified an areal factor 30 by a foreground =0.422 group of galaxies. Further considerations of the lensing configuration have been presented by Vegetti et al. (2010). The object was selected for detailed study after considering an integrated near-infrared emission line spectrum using NIRSPEC on Keck 2 (Hainline et al 2009).
Throughout this paper we adopt a CDM cosmology with = 70 km s-1 Mpc-1, =0.30 and =0.70. At =2.00, 0.1 arcsec corresponds to 840 pc and the age of the universe was 3.2 Gyr. All magnitudes are in the AB system.
2. Observations and Data Reduction
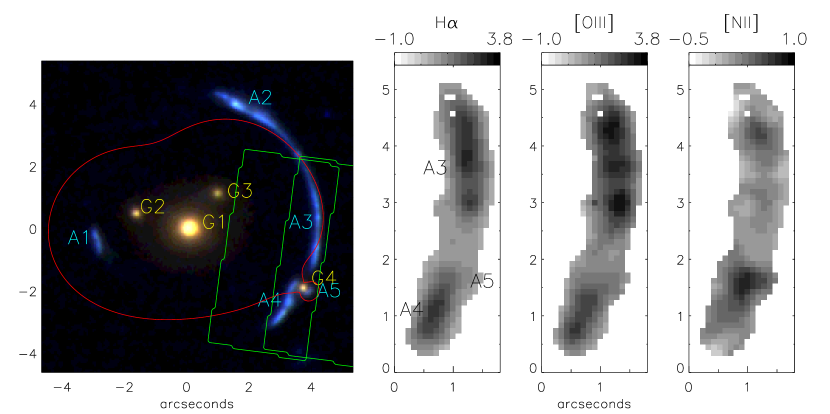
Observations of SDSS J120601.69+514227.8 (the Clone) were taken with the OH-Suppressing Infra-Red Imaging Spectrograph (OSIRIS; Larkin et al. 2006) and the LGSAO system on the Keck 2 telescope on 19 May 2010. The weather was clear with strong winds and the seeing was 1.5 arcsecond FWHM. Nonetheless, tip/tilt correction yielded a respectable Strehl of 0.15 at m. We took exposures of 900 seconds each, dithering by 1.8 arcseconds in order to achieve good sky subtraction while keeping the arc within the OSIRIS field of view. We obtained 4 exposures in the Kn1 band (covering H and [Nii]), 2 exposures in Hn1 ([Oiii]) and 3 exposures in Zn4 ([Oii]). The physical location of the OSIRIS field is shown on a HST color composite in Figure 1.
Dark and bias subtraction, spectral extraction, wavelength calibration and construction of the relevant data cubes was accomplished using the OSIRIS data reduction pipeline (ODRP; Larkin et al. 2006). Sky subtraction was done with the IDL code described in Davies (2007) using adjacent pairs of images as sky reference frames. The final data cubes were stacked using a clipped mean and show strong [Oiii], H, and [Nii] emission. The brightest individual pixels have a signal-to-noise of 10 in H, 5 in [Oiii], and 2 in [Nii]. The [Oii] doublet was not reliably detected and H lay in a region of low atmospheric transmission.
The infrared standard star FS 133 was observed with the same instrument configuration. Precise JHK UKIRT photometry from Hawarden et al. (2001) was matched to the G8v stellar spectrum from Pickles (1998) to determine the conversion from ADU to flux as a function of wavelength. We tested this calibration by comparing the ratio of observed flux (in ADU s-1) to the reference spectrum (in erg s-1 cm-2) with an atmospheric transmission model generated by the ATRAN program (Lord, 1992). The data reproduced all major atmospheric absorption features to better than 10 % accuracy. We checked further for systematic errors by comparing the flux ratio of bright emission lines in the integrated OSIRIS spectrum of image A3 (Figure 1) with independent results from NIRSPEC (Hainline et al., 2009). The results were consistent to within the uncertainties (6%). Overall we deduce a systematic uncertainty in flux ratios of % for lines observed with different instrumental configurations (such as [Oiii]/H), and negligible systematic error for lines observed simultaneously ([Nii]/H).
3. Gravitational lens model
| Component | |||||
|---|---|---|---|---|---|
| G1 | |||||
| G2 | |||||
| G3 | |||||
| G4 | |||||
| Shear |
Our OSIRIS field samples several multiple images of the =2.00 galaxy (A3-5; Figure 1) enabling us, in principle, to derive the source plane properties independently via each image. However, accurate modeling of the foreground gravitational lens is necessary to realize this advantage. We use the lenstool program (Kneib et al., 1993; Jullo et al., 2007) to parameterize the mass distribution of the lens, using the image positions as constraints.
Our lens model comprises 1 group-scale dark matter halo, 3 galaxy-scale dark matter halos associated with G2, G3, and G4, and an external shear component. Galaxies G1, G2, and G3 are parameterized with a singular isothermal ellipsoid (SIE). G4 is parameterized with a dual Pseudo-Isothermal elliptical mass distribution (dPIE; Elíasdóttir et al. 2007) with an assumed tidal radius of 0.68” (Vegetti et al., 2010). The fit is very good, with a mean residual error of 0.2” in the image plane and 0.06” in the source plane. The recovered parameter values for this model are reproduced in Table 1. We find typical linear magnification factors of (orthogonal and parallel to the arc) for image A3 and for A4 with an uncertainty of 5 %. The areal magnification, , is in good agreement with Lin et al. (2009).
Lenstool defines the necessary transformations to the source (intrinsic) plane for each image, giving the source plane position for each spatial pixel of OSIRIS. We use the IDL functions triangulate and trigrid to interpolate the irregularly-sampled source plane data onto a uniform grid. The source plane resolution of kpc FWHM was measured by reconstructing the tip/tilt reference star in the source plane at various locations. Since we will smooth the data to improve the signal/noise we note here that the resolution increases to kpc and kpc when the image plane data is convolved with a Gaussian of FWHM and 0.40 arcseconds, respectively.
4. Kinematic Properties
Considering the kinematic data for H in the image plane where the instrument resolution and sensitivity are nearly uniform and easily characterized, the internal properties of the Clone are fairly typical of those 2-3 galaxies for which data of comparable resolution is available (e.g. Stark et al. 2008; Jones et al. 2010). After smoothing with a Gaussian kernel of FWHM arcsec we determine the H emission line velocity and width from a Gaussian fit to the line profile. The intrinsic velocity dispersion is determined by subtracting the instrumental resolution of km s-1 (measured from OH sky lines) in quadrature from the best-fit line width. Only fits with signal-to-noise in H are kept.
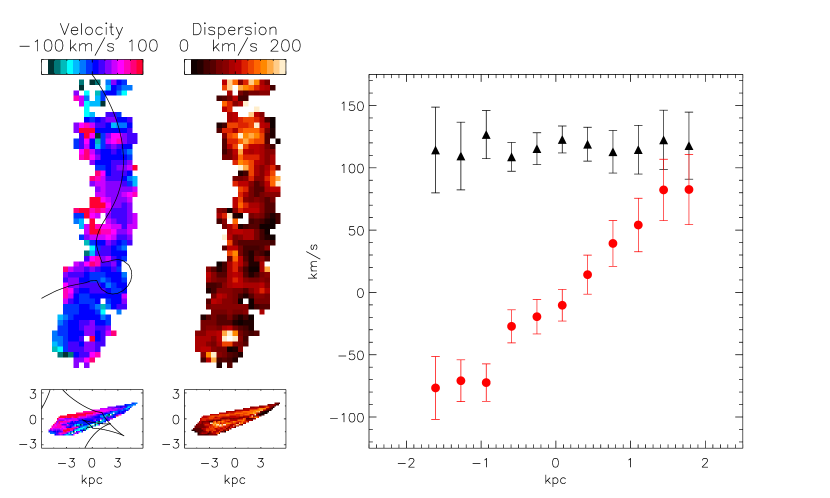
In Figure 2 we present source-plane velocity and dispersion maps constructed from the A3 image (see Figure 1). The 2D map and 1D velocity profile both show a large gradient of km s-1 across the galaxy with some degree of asymmetry. The reconstruction of images A4-5 gives a consistent result with km s-1. The velocity dispersion is typically km/s in the center and shows similar asymmetry. The mean dispersion of individual pixels is km s-1, consistent with km s-1 derived from the Hainline et al. (2009) integrated spectrum. This dispersion gives a dynamical mass M⊙ for kpc (Hainline et al., 2009).
The above observations are characteristic features of star-forming galaxies observed at (e.g. the SINS sample discussed by Förster Schreiber et al. 2009). The SINS galaxies have a median dispersion of km s-1 and for those classified as likely disk progenitors. Even those SINS galaxies with the most prominent rotational motion show asymmetric features, with model residuals of km/s in both velocity and dispersion (Cresci et al., 2009).
5. Gas Phase Metallicity Measurements
Reliable metallicity measurements require knowledge of the electron temperature, ionization state, and reddening, for which several emission lines must be observed. In practice, all metallicity measurements at high redshift rely on strong emission lines which can be detected in a reasonable integration time. Ratios of strong emission lines are then used to infer the gas-phase oxygen abundance, calibrated locally using either direct measurements of the electron temperature or via photoionization models. One of the more popular diagnostics is the [Nii]/H ratio (N2) which Pettini & Pagel (2004) showed is strongly correlated with the oxygen abundance via:
with an intrinsic 1 scatter of 0.18 dex.
The main drawbacks of the N2 method are that [Nii]/H does not necessarily trace the global metallicity when (i) AGN and shock excitation contribute to [Nii] emission; (ii) secondary production of nitrogen leads to variation in the N/O ratio; and (iii) [Nii] cooling saturates (at ). The advantage of N2 lies in the proximity of the two required emission lines, such that systematic errors due to reddening and instrumental effects are negligible.
Fortunately, we can use [Oiii] as an additional constraint on shock ionization, AGN, and variations in the N/O ratio. We smoothed the data cube spatially with a arcsec FWHM Gaussian, providing a signal-to-noise for [Nii] across the entire OSIRIS field of view. We then fit a Gaussian profile to the H line and determined the best-fit [NII] and [OIII] fluxes for the same profile, requiring the H signal-to-noise to be (Figure 1). We found no significant offset in the velocity when fitting these lines independently. For each pixel we infer the [Oiii]/H ratio (assuming Case B recombination) and measure the [Nii]/H ratio adopting an average selective extinction of E(B-V) (Hainline et al., 2009). The resulting data show no evidence of shock ionization or AGN in the standard BPT diagnostic diagram (Baldwin et al., 1981). We can examine possible variations in the N/O abundance using the photoionization models presented in Kewley & Dopita (2002). The [Oii]/[Oiii] flux from Hainline et al. (2009), corrected for reddening via the H/H ratio, suggests an ionization parameter for the integrated spectrum. We compute the metallicity of each pixel from both the [Nii]/H and [Nii]/[Oiii] ratios using this ionization parameter and find excellent agreement, with an average offset 0.02 and 1 scatter of in .

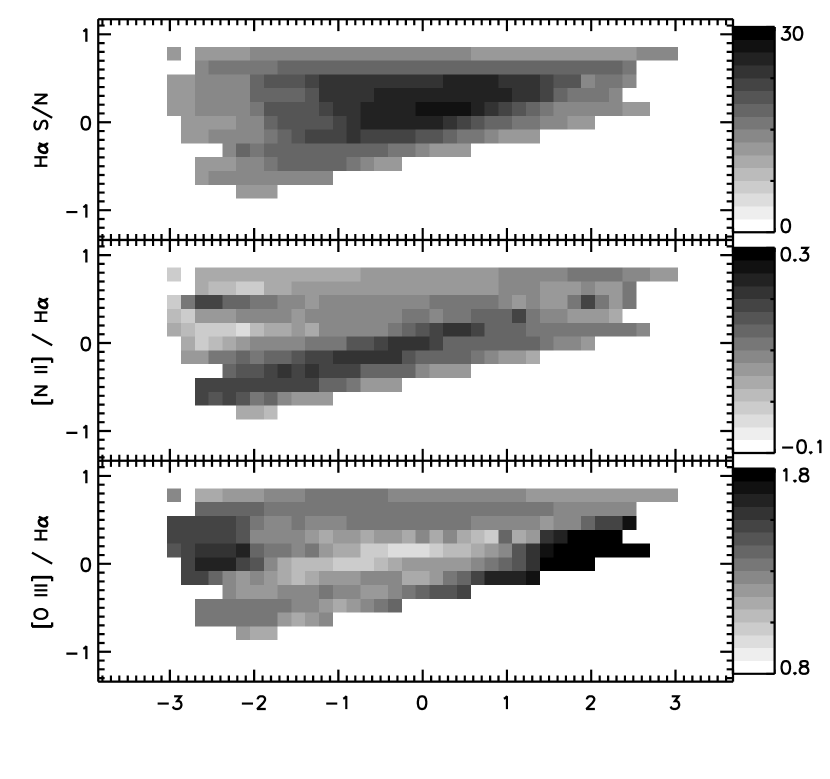
The source-plane reconstruction is done independently for the A3 and A4/A5 regions, yielding two independent measurements of the metallicity distribution. The results are shown in Figures 3 and 4. [Nii]/H peaks in the center of the galaxy roughly coincident with the global minimum of [Oiii]/H, with [Nii]/H decreasing and [Oiii]/H increasing at larger radii. This is the expected signature of a metallicity gradient as seen in local disk galaxies (e.g. Magrini et al. 2007). Using Pettini & Pagel (2004)’s calibration to convert the measured [Nii]/H to an inferred metallicity , we extract pixels within a slit oriented along the direction of highest magnification to maximize spatial sampling and resolution. We bin pixels within the extraction slit based on their radius from the center of the galaxy, determined from the centroid of the global minimum [Oiii]/H. A linear fit to each set of data gives and dex/kpc, with central values of and respectively. Taken together, we infer a metallicity gradient of dex/kpc. Varying the central position by up to 800 parsec results in gradients typically shallower by dex/kpc, but a consistent central metallicity. The metallicity inferred for the global spectrum is (adopting the scatter in the N2 calibration), consistent with Hainline et al. (2009) within the uncertainties.
The preceding analysis assumes that scatter in the N2 calibration applies to individual measurements but not their differences. We also measured the metallicity gradient with scatter in the N2 calibration treated as an additional uncertainty in each measurement (and their differences), but with no overall systematic offset. The resulting central metallicity is and the gradient is dex/kpc. As discussed above, the [Oiii] measurements suggest no significant error in the inferred metallicity from varying ionization parameter and N/O ratio, implying that scatter in the N2 calibration does not affect relative abundances such as gradients. This is supported by studies of nearby galaxies (Rupke et al., 2010; Kewley et al., 2010), hence we adopt an uncertainty of dex/kpc in the metallicity gradient. Regardless, Figure 4 clearly shows a significant radial gradient with correlation coefficients of and for images A4 and A3 of the arc, respectively.
6. Discussion
The Clone arc is evidently representative of UV-bright star-forming galaxies at both in its integrated star formation rate of yr-1 and its resolved kinematics. Via the detailed study of 3 emission lines, we have found a strong radial gradient in both the [Nii]/H and [Oiii]/H flux ratios, consistent with a metallicity gradient which we measure to be dex/kpc. This is stronger than that in local disk galaxies, which typically have gradients of dex/kpc (Bresolin et al., 2010; Moran et al., 2010; Rupke et al., 2010; Carrera et al., 2008; Magrini et al., 2007), although the total range is similar. The near-solar central metallicity is comparable though somewhat lower than in local massive disk galaxies. We can place a rough upper limit on the age of the Clone by considering the timescale Myr, suggesting that strong central enhancement occurs very rapidly.
Negative metallicity gradients suggest that the inner regions are older and more gas-depleted than the outskirts. The extremely steep gradient and similar range of metallicity in such a young galaxy as the Clone suggests an inside-out growth scenario in which the center is enriched rapidly while stellar mass and metallicity gradually increase at large radii. This is further supported by kinematic evidence: the large velocity dispersion should cause the metallicity gradient in the Clone to flatten due to radial mixing on timescales of order Myr. Infall of metal-poor gas onto the outskirts of the galaxy is therefore necessary to maintain a strong gas-phase metallicity gradient, which will naturally flatten toward values observed in local disks when accretion stops.
The chemical and dynamical properties of the Clone are consistent with cosmological simulations which show that accretion of cold gas onto a turbulent disk leads to a bulge plus thin disk morphology (Ceverino et al., 2010; Brooks et al., 2009). The “clumpy disk” phase can last for several years, during which radial abundance gradients would be affected by the competing processes of radial mixing (which flattens the gradient) and infall of metal-poor gas (which steepens the gradient), ultimately keeping the abundance spread relatively similar. Meanwhile the galaxy grows in size and stellar mass, while centrally-migrating clumps form a bulge which stabilizes the disk.
As emphasized in Jones et al. (2010) our results demonstrate the considerable advantage of using lensed galaxies to probe the internal structure of 2-3 galaxies, both in terms of increased flux and source plane resolution. Procuring a larger sample of highly magnified 2 galaxies is thus a highly profitable exercise for furthering our understanding of galaxy assembly and metal enrichment in the Universe.
Acknowledgments
EJ is supported by the NPP, administered by Oak Ridge Associated Universities through a contract with NASA. Part of this work was carried out at Jet Propulsion Laboratories, California Institute of Technology under a contract with NASA. JR acknowledges support from an EU-Marie Curie fellowship. We thank the referee for useful comments which improved this paper. TAJ thanks Wal Sargent and Judy Cohen for helpful discussions. We thank the Keck Observatory staff for their assistance in obtaining these observations. The authors wish to recognize and acknowledge the very significant cultural role and reverence that the summit of Mauna Kea has always had within the indigenous Hawaiian community. We are most fortunate to have the opportunity to conduct observations from this mountain.
References
- Baldwin et al. (1981) Baldwin, J. A., Phillips, M. M., & Terlevich, R. 1981, PASP, 93, 5
- Bresolin et al. (2010) Bresolin, F., Stasińska, G., Vílchez, J. M., Simon, J. D., & Rosolowsky, E. 2010, MNRAS, 404, 1679
- Brooks et al. (2007) Brooks, A. M., Governato, F., Booth, C. M., Willman, B., Gardner, J. P., Wadsley, J., Stinson, G., & Quinn, T. 2007, ApJ, 655, L17
- Brooks et al. (2009) Brooks, A. M., Governato, F., Quinn, T., Brook, C. B., & Wadsley, J. 2009, ApJ, 694, 396
- Carrera et al. (2008) Carrera, R., Gallart, C., Aparicio, A., Costa, E., Méndez, R. A., & Noël, N. E. D. 2008, AJ, 136, 1039
- Ceverino et al. (2010) Ceverino, D., Dekel, A., & Bournaud, F. 2010, MNRAS, 404, 2151
- Cresci et al. (2009) Cresci, G., et al. 2009, ApJ, 697, 115
- Davies (2007) Davies, R. I. 2007, MNRAS, 375, 1099
- Elíasdóttir et al. (2007) Elíasdóttir, Á., et al. 2007, arXiv:0710.5636
- Erb et al. (2006) Erb, D. K., Shapley, A. E., Pettini, M., Steidel, C. C., Reddy, N. A., & Adelberger, K. L. 2006, ApJ, 644, 813
- Förster Schreiber et al. (2009) Förster Schreiber, N. M., et al. 2009, ApJ, 706, 1364
- Gnerucci et al. (2010) Gnerucci, A., et al. 2010, arXiv:1007.4180
- Hainline et al. (2009) Hainline, K. N., Shapley, A. E., Kornei, K. A., Pettini, M., Buckley-Geer, E., Allam, S. S., & Tucker, D. L. 2009, ApJ, 701, 52
- Halliday et al. (2008) Halliday, C., et al. 2008, A&A, 479, 417
- Hawarden et al. (2001) Hawarden, T. G., Leggett, S. K., Letawsky, M. B., Ballantyne, D. R., & Casali, M. M. 2001, MNRAS, 325, 563
- Hayashi et al. (2009) Hayashi, M., et al. 2009, ApJ, 691, 140
- Jullo et al. (2007) Jullo, E., Kneib, J.-P., Limousin, M., Elíasdóttir, Á., Marshall, P. J., & Verdugo, T. 2007, New Journal of Physics, 9, 447
- Jones et al. (2010) Jones, T. A., Swinbank, A. M., Ellis, R. S., Richard, J., & Stark, D. P. 2010, MNRAS, 404, 1247
- Kewley & Dopita (2002) Kewley, L. J., & Dopita, M. A. 2002, ApJS, 142, 35
- Kewley et al. (2010) Kewley, L. J., Rupke, D., Jabran Zahid, H., Geller, M. J., & Barton, E. J. 2010, ApJ, 721, L48
- Kneib et al. (1993) Kneib, J. P., Mellier, Y., Fort, B., & Mathez, G. 1993, A&A, 273, 367
- Larkin et al. (2006) Larkin, J., et al. 2006, Proc. SPIE, 6269,
- Law et al. (2009) Law, D. R., Steidel, C. C., Erb, D. K., Larkin, J. E., Pettini, M., Shapley, A. E., & Wright, S. A. 2009, ApJ, 697, 2057
- Lin et al. (2009) Lin, H., et al. 2009, ApJ, 699, 1242
- Lord (1992) Lord, S. D., 1992, NASA Technical Memorandum 103957
- Magrini et al. (2007) Magrini, L., Vílchez, J. M., Mampaso, A., Corradi, R. L. M., & Leisy, P. 2007, A&A, 470, 865
- Mannucci et al. (2009) Mannucci, F., et al. 2009, MNRAS, 398, 1915
- Moran et al. (2010) Moran, S. M., et al. 2010, arXiv:1007.3272
- Navarro et al. (1997) Navarro, J. F., Frenk, C. S., & White, S. D. M. 1997, ApJ, 490, 493
- Pettini & Pagel (2004) Pettini, M., & Pagel, B. E. J. 2004, MNRAS, 348, L59
- Pickles (1998) Pickles, A. J. 1998, PASP, 110, 863
- Rupke et al. (2010) Rupke, D. S. N., Kewley, L. J., & Chien, L. -H. 2010, ApJ, in press (astro-ph/1009.0761)
- Stark et al. (2008) Stark, D. P., Swinbank, A. M., Ellis, R. S., Dye, S., Smail, I. R., & Richard, J. 2008, Nature, 455, 775
- Swinbank et al. (2010) Swinbank, A. M., et al. 2010, Nature, 464, 733
- Tacconi et al. (2010) Tacconi, L. J., et al. 2010, Nature, 463, 781
- Tremonti et al. (2004) Tremonti, C. A., et al. 2004, ApJ, 613, 898
- Vegetti et al. (2010) Vegetti, S., Czoske, O., & Koopmans, L. V. E. 2010, MNRAS, 1013