A Change of Rotation Profile in the Envelope in the HH 111 Protostellar System: A Transition to a Disk?
Abstract
The HH 111 protostellar system consists of two Class I sources (VLA 1 and 2) with putative disks deeply embedded in a flattened envelope at a distance of 400 pc. Here is a follow-up study of this system in C18O (J=2-1), SO (), and 1.33 mm continuum at (400 AU) resolution, and it may show for the first time how a rotationally supported disk can be formed inside an infalling envelope. The 1.33 mm continuum emission is seen arisen from both sources, likely tracing the dusty putative disks around them. In particular, the emission around the VLA 1 source is elongated in the equatorial plane with a radius of 300 AU. The envelope is well seen in C18O, extending to 7000 AU out from the VLA 1 source, with the innermost part overlapping with the dusty disk. It has a differential rotation, with the outer part ( 2000–7000 AU) better described by a rotation that has constant specific angular momentum and the inner part ( 60–2000 AU) by a Keplerian rotation. The envelope seems to also have some infall motion that is smaller than the rotation motion. Thus, the material in the outer part of the envelope seems to be slowly spiraling inward with its angular momentum and the rotation can indeed become Keplerian in the inner part. A compact SO emission is seen around the VLA 1 source with a radius of 400 AU and it may trace a shock such as an (inner) accretion shock around the disk.
1 Introduction
Stars are formed inside molecular cloud cores by means of gravitational collapse. The details of the process, however, are complicated by the presence of magnetic fields and angular momentum. As a result, in addition to infall (or collapse), rotation and outflow are also seen toward star-forming regions. In theory, a rotationally supported disk is expected to form inside a collapsing core around a protostar, from which part of the material is accreted by the protostar and part is ejected away. Observationally, however, when and how a rotationally supported disk is actually formed are still unclear, because of the lack of detailed kinematic studies inside the collapsing core.
This paper is a follow-up study of the HH 111 protostellar system. The properties of this system have been reported in Paper I and only the important ones are summarized here. This system is deeply embedded in a compact molecular cloud core in the L1617 cloud of Orion at a distance of 400 pc. It is a Class I protostellar system with a flattened envelope, putative disks, and highly collimated jets. At the center of this system, there are two sources, VLA 1 and VLA 2, with a projected separation of (1200 AU) and the former driving the HH 111 jet (Reipurth et al., 1999). Previous observation of this system has shown that the flattened envelope seems to be in transition to a rotationally supported disk near the VLA 1 source (Lee et al 2009, hereafter Paper I). Here is a follow-up study of this system with more complete coverage, extending to both shorter and longer spacings, in 1.33 mm continuum, C18O (), and SO () emission obtained with the Submillimeter Array (SMA)111The Submillimeter Array is a joint project between the Smithsonian Astrophysical Observatory and the Academia Sinica Institute of Astronomy and Astrophysics, and is funded by the Smithsonian Institution and the Academia Sinica. (Ho et al., 2004). This study may show for the first time a change of rotation profile in an envelope and thus how a disk can be formed inside an envelope.
2 Observations
Observation toward the HH 111 system was first carried out with the SMA on 2005 December 5 in the compact-north configuration, with the results reported in Paper I . Follow-up observations were then carried out on 2010 January 24 in the extended configuration for longer spacings to resolve the structure of the envelope and on 2010 March 26 in the sub-compact configuration for shorter spacings to restore the large-scale structure. The 230 GHz band receivers were used to observe the 12CO (), 13CO (), C18O (), and SO () lines simultaneously with the 1.33 mm continuum. The rest frequency of the SO line is assumed to be 219.949391 GHz (Lovas, 1992). Note that the 12CO and 13CO lines trace mainly the outflow interaction and will be presented in a future publication.
In the follow-up observations, the velocity resolution in SO line was increased to 0.28 km s-1 per channel, similar to that of C18O. Also, only one single pointing toward the central region was observed in order to have enough sensitivity. The visibility data were calibrated with the MIR package. The flux uncertainty was estimated to be 15%. The calibrated visibility data were combined with that in the compact-north configuration and then imaged with the MIRIAD package, as described in Paper I . With various different weightings, the synthesized beams can have a size from to . The rms noise levels are 0.06 Jy beam-1 in the C18O and SO channel maps with a beam of , and 1.6 mJy beam-1 in the continuum map with a beam of . The velocities in the channel maps are LSR.
3 Results
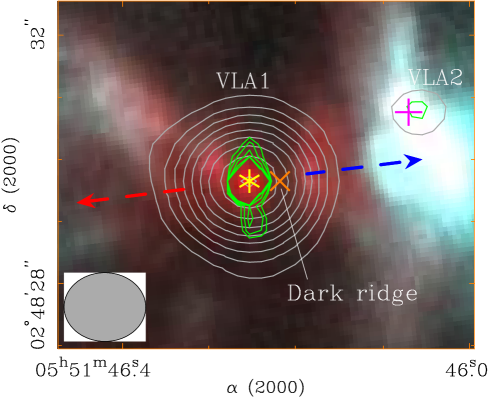
As in Paper I , the results are presented in comparison to a mosaic image based on the Hubble Space Telescope (HST) NICMOS image ([FeII] 1.64 m + H2 at 2.12 m + continuum) obtained by Reipurth et al. (1999), which shows two sources in the infrared, reflection nebulae that trace the illuminated outflow cavity walls, and the jet in the system. The two sources were also detected in 3.6 cm continuum by the VLA as the VLA 1 and 2 sources, respectively, at , and , (Reipurth et al., 1999; Rodríguez et al., 2008). These VLA positions are more accurate than the NICMOS positions and are thus adopted here as the source positions. The systemic velocity in this system is assumed to be 8.900.14 km s-1 LSR, as discussed in Section 3.2.1. Throughout this paper, the velocity is relative to this systemic value.
3.1 1.33 mm Continuum Emission
As shown in Figure 1, the continuum emission is now spatially resolved into two components, a bright one associated with the VLA 1 source and a much fainter one ( 5 detection with 1 mJy beam-1) associated with the VLA 2 source. The one associated with the VLA 1 source is slightly elongated perpendicular to the jet axis. This elongation is better seen in the CLEAN component map, which shows a faint disk-like structure extending to (280 AU) to the north and (360 AU) to the south. Note that in the CLEAN component map, the central peak at the VLA 1 position has a FWHM size of (240 AU) and 90% of the flux, but no emission is detected toward the dark ridge position at the center of the reflection nebulae likely because of a lack of sensitivity. As discussed in Paper I , the emission is thermal emission from dust. Thus, the emission is believed to come mainly from a dusty disk, with the inner part of which already seen with a size of (60 AU) at 7 mm (Rodríguez et al., 2008). The total flux of this emission is 30040 mJy, slightly higher than that found in Paper I because of the inclusion of the shorter spacings. In Paper I , the dust was found to have a temperature of 41-64 K, with a mass opacity of 0.026 cm2 g-1 and the emission being optically thin at 1.33 mm. Therefore, the gas and dust associated with this emission have a mass of . Most of this mass, however, is from the central unresolved peak. On the other hand, the total flux toward the VLA 2 source is 11 mJy. The mass would be 0.005 if the emission has the same properties as that around the VLA 1 source.
3.2 Line Emission
3.2.1 Spectra
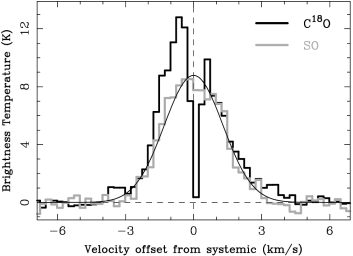
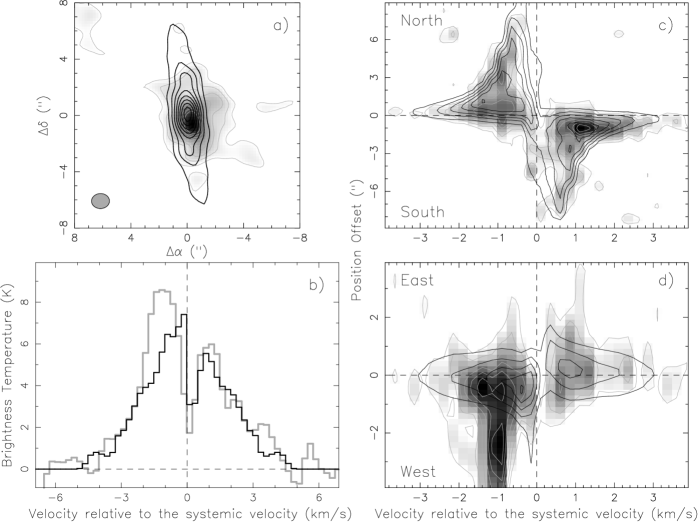
Figure 2 shows the C18O and SO spectra toward the VLA 1 source. These lines are detected upto 4.0 km s-1 from the systemic velocity. The SO spectrum is rather symmetric and can be roughly described by a Gaussian line profile, and its line center can be used here to define the systemic velocity. Since part of the SO emission comes from the outflow as discussed later, further observation at higher resolution is needed to refine the systemic velocity by separating the outflow from the envelope. The C18O spectrum shows a double-peaked profile with a dip near the systemic velocity, and with the blueshifted peak brighter than the redshifted peak (i.e., the blue asymmetry). As discussed in Paper I , the dip with the blue asymmetry could be due to self-absorption because of an infall motion in the envelope and the missing flux resolved out by the interferometer. The SO emission does not show a dip, likely because it is optically thin due to low SO abundance.
3.2.2 Morphologies at different velocities
In order to see how the envelope structure changes with velocity, the line emission is divided into 3 velocity ranges: low (01 km s-1), medium (12 km s-1), and high (23.7 km s-1) velocity ranges, on the redshifted and blueshifted sides.
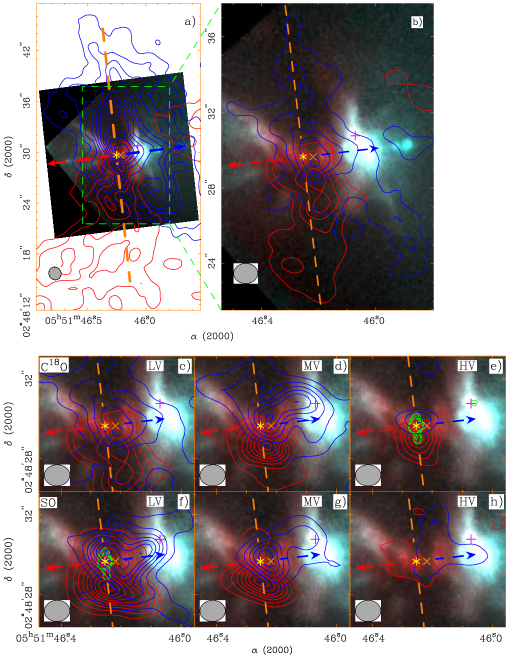
The structure of the envelope can be clearly seen in C18O at low velocity, as shown in Figure 3a. The envelope is seen extending to (6400 AU) to the north and south from the VLA 1 source, about twice as extended as that seen in Paper I . It is well confined in the equatorial plane perpendicular to the jet axis, fitting right in between the cavity walls outlined by the reflection nebulae. The detailed structure, however, is complicated. In particular, the emission in the north beyond out from the source is deviated away from the equatorial plane and the emission in the south is curvy. With respect to the VLA 1 source, the blueshifted emission is to the north and the redshifted one is to the south, as expected for a rotating envelope. As we zoom into the inner region at higher resolution, the emission appears to be aligned with the dark ridge at in the west of the VLA 1 source (see Figure 3b and c for the central region). The blueshifted emission also arises from the outflow, extending to the west along the jet axis, to the northeast along the cavity wall, and to the southwest. At medium velocity, the emission shrinks toward the VLA 1 source (Figure 3d), as expected if the velocity of the emission increases toward the source. The blueshifted peak is closer to the source than the redshifted peak. In addition, both the blueshifted and redshifted peaks shift to the east toward the equatorial plane of the VLA 1 source, as compared to those at low velocity. Note that the blueshifted emission also extends toward the VLA 2 source and along the jet. At high velocity, the emission shrinks even closer to the source (Figure 3e). In addition, the blueshifted and redshifted peaks shift further to the east into the equatorial plane of the VLA 1 source, coincident with the disk-like structure seen in the continuum in the CLEAN component map. Thus, the motion at high velocity is highly dominated by the rotation, with the emission in the equatorial plane. Again, the blueshifted peak is closer to the source than the redshifted peak, and here by .
Unlike the C18O emission, the SO emission is compact with a size of , tracing the innermost part of the envelope. At low velocity, the blueshifted and redshifted peaks are seen on the opposite sides of the VLA 1 source in the equatorial plane (Figure 3f), tracing the rotation motion. That both the redshifted and blueshifted emission also extend to the opposite sides of the source could be due to an additional motion, either infall or outflow. In addition, the blueshifted emission also extends to the VLA 2 source. At medium velocity, the emission shrinks toward the VLA 1 source (Figure 3g). The peak of the blueshifted emission, however, is shifted to the west of the VLA 1 source, likely due to the contamination of the emission extending to the VLA 2 source and the emission at the outflow base. At high velocity, the emission is very weak (Figure 3h). Both the redshifted and blueshifted emission seem to be contaminated by the outflow emission, extending along the cavity walls and along the jet axis.
3.2.3 Rotation motion
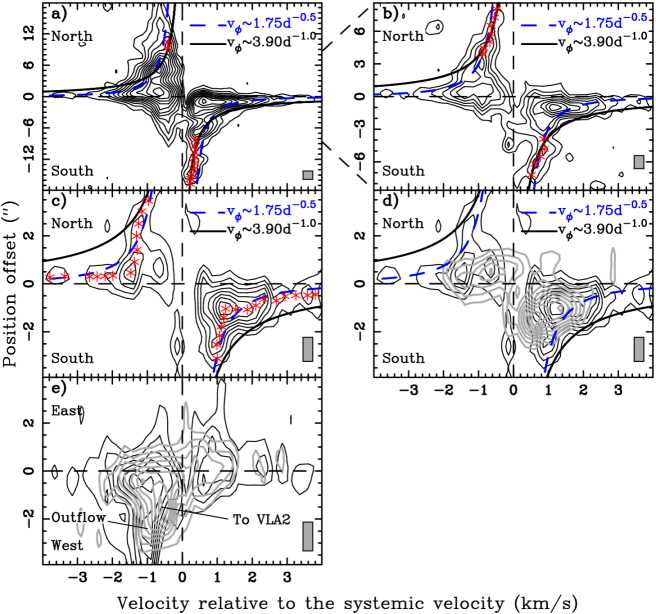
The rotation profile in the envelope can now be better constrained than that in Paper I , with more complete coverage. Figures 4a through 4c show the position-velocity (PV) diagrams centered at the VLA 1 source cut perpendicular to the jet axis in C18O, with increasing resolution toward the inner region. The blueshifted emission is seen mainly to the north and redshifted emission mainly to the south, confirming that the motion in the envelope is dominated by rotation. The blueshifted emission beyond in the north shows a velocity increasing with the distance from the source (Figure 4a). That part of the emission is seen deviated from the equatorial plane (see Fig. 3a) and thus may trace an interaction with the surrounding. Except for that part, the rotation velocity increases toward the source and thus could be Keplerian or that has constant specific angular momentum as seen in some infalling envelopes in the Class I phase (see, e.g., Ohashi et al., 1997a; Momose et al., 1998; Lee & Ho, 2005).
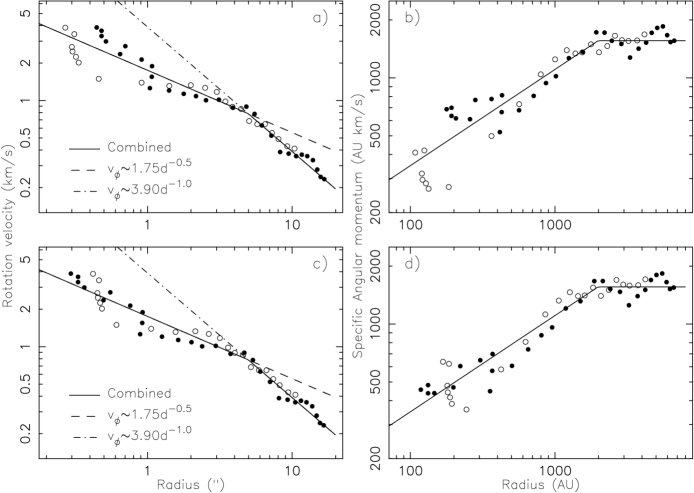
Figures 5a and 5b show the rotation velocity ( and the implied specific angular momentum (), respectively, as a function of , which is the radius measured from the source. The data points are extracted from the PV diagrams with increasing resolution toward the inner region and marked as “x”s in Figures 4a through 4c. Both the rotation velocity and specific angular momentum are corrected for the inclination angle assuming that the envelope is perpendicular to the jet axis and thus has an inclination angle of 10∘ to the line of sight (Reipurth, Raga, & Heathcote, 1992). As can be seen, the rotation profile can be roughly divided into two parts. For (2000 AU), the rotation velocity can be roughly reproduced by the rotation that has constant specific angular momentum (see also Figures 4a through 4c), with km s-1 and (or 400 AU). The specific angular momentum there is almost constant at 1550 AU km s-1. For , the rotation velocity increases slower toward the source and is better described by a Keplerian law (see also Figures 4a through 4c), with km s-1. The specific angular momentum decreases steadily to 300400 AU km s-1 at 100 AU (). Note that in Figures 5a and 5b, for , the blueshifted data points and the redshifted data points are separated from each other. As mentioned, at high velocity, the peak of the blueshifted emission in the north is closer to the source by than that of the redshifted emission in the south (Figure 3e). This difference in distance is also seen in the PV diagram in Figure 4c. Thus, it is possible that the center of the envelope is actually located at to the south of the VLA 1 source. If so, then the blueshifted data points and the redshifted data points will move closer to each other, as seen in Figures 5c and 5d. Observations at high angular resolution are needed to confirm this.
Rotation is also seen in the compact SO emission near the source. As shown in Figure 4d, the PV structure of the SO emission overlaps with that of the C18O emission near the source, tracing the rotation there. As in C18O, the center of the PV structure seems to be located slightly to the south.
3.2.4 Infall motion
The infall motion can be studied with the PV diagrams cut along the jet axis in C18O and SO, as shown in Figure 4e. The C18O emission at 1 km s-1 on the blueshifted side with the position offset is from the outflow emission extending to the west along the jet axis as seen in the low and medium-velocity maps (see Figures 3c and d). This blueshifted emission in the west also extends close to the source, contaminating the envelope emission. Also, the SO emission on the blueshifted side at (0.6 km s-1, ) extends to the VLA 2 source, and thus should be excluded for studying the infall motion. Excluding those parts of the emission, the C18O and SO PV structures appear to be similar and both are roughly symmetric about the source, with the blueshifted emission shifted slightly to the west and the redshifted to the east. With the near end of the envelope tilted to the east, these PV structures, together with the double-peaked line profile with a blue asymmetry and an absorption dip at the systemic velocity (Fig 2), suggest an infall motion in the envelope, as discussed in Paper I .
4 A flattened rotating envelope model
In order to roughly derive the structure, the physical properties (i.e., density and temperature), and the infall velocity of the envelope, a simple flattened envelope model is used to reproduce the PV diagrams, spectrum, and integrated intensity map of the C18O emission. In this model, the envelope has an inner radius of , an outer radius of , and a half-opening angle of , so that its half thickness, , can be given in the cylindrical coordinates by
| (1) |
where is measured from the equatorial plane, and is the minimum value of the half thickness near the source. The number density of molecular hydrogen in the envelope is assumed to be given by
| (2) |
where AU (, as in Section 3.2.3), is the density at and is a power-law index assumed to be , as in many theoretical infalling models (see, e.g., Shu, 1977; Nakamura, 2000). The abundance of C18O relative to molecular hydrogen is assumed to be constant and given by , as in Paper I . The temperature of the envelope is uncertain and assumed to be given by
| (3) |
where is the temperature at and is a power-law index.
As discussed in Section 3.2.3, the rotation is assumed to change from that with constant specific angular momentum in the outer part to that of Keplerian in the inner part. i.e.,
| (6) |
with the transition radius
| (7) |
at which the Keplerian rotation is the same as that with constant specific angular momentum. The infall motion is uncertain. It is assumed to be in the radial direction and given by
| (8) |
as in a collapsing envelope.
In the model, radiative transfer is used to calculate the emission, with an assumption of local thermal equilibrium. For simplicity, the line width is assumed to be given by the thermal line width only. The channel maps of the emission derived from the model are used to calculate the model visibility data with the observed coverage. This model visibility data are used to obtain the channel maps, and then the integrated intensity map, spectrum, and PV diagrams to be compared with the observations.
Figure 7 shows the comparison of the best model with the observations. As mentioned earlier, the envelope is assumed to have an inclination angle of 10∘ to the line of sight, with the nearside tilted to the east. The parameters that are used to reproduce the observations are km s-1, km s-1, and km s-1 for the envelope kinematics, (60 AU), (7200 AU), (160 AU), and 8∘ for the envelope structure, and cm-3, K, and for the envelope physical properties (see also Figure 6 for the parameter profiles). The values of and are set to those found in section 3.2.3, resulting in the transition radius of (2000 AU). The mass that supports the Keplerian rotation is 1.38 . Thus, the mass of the central source, which can be estimated by subtracting from this mass the mass of the dusty disk close to the source, is 1.25 . Here, the inner radius is set to where it has a Keplerian rotation velocity of 4.5 km s-1. is set to be the lower end of the dust temperature (Paper I, ). As can be seen, the simple model can reproduce the observed PV diagrams, spectrum, and integrated intensity map reasonably well. In the model, the intensity near the systemic velocity is higher than that in the observations, probably because a large-scale envelope (with a size larger than ) or core is needed to resolve out the emission there. Also, the blueshifted emission around 1 km s-1 is less than that in the observations because the observed blueshifted emission there is contaminated by the outflow emission (Figure 7b). Moreover, as compared to the observations, the PV structure perpendicular to the jet axis is shifted slightly to the north (Figure 7c), probably because the center of the envelope is indeed located slightly to the south, as discussed earlier.
As a result, the C18O envelope can be considered as a flattened envelope that extends from 60 to 7000 AU out from the source, with a small opening angle of 16∘. It has a differential rotation, with the outer part ( 2000–7000 AU) better described by a rotation that has constant specific angular momentum and the inner part ( 60–2000 AU) by a Keplerian rotation. The transition radius between the two parts is 2000 AU. The mass of the envelope (including helium and molecular hydrogen) is given by the following integration:
Thus, the mass of the whole envelope extending from 60 to 7000 AU is 0.62 , about 45% of the mass of the central source. On the other hand, the mass of the inner part of the envelope extending from 60 to 2000 AU is 0.13 . Since this mass is only 10% of the mass of the central source, the rotation in the inner part of the envelope can indeed become Keplerian. The envelope seems to have a small infall motion. The amount of the infall motion, however, could be overestimated due to the outflow contamination in the unresolved PV structure along the jet axis. Observation at higher resolution is really needed to confirm the infall motion by separating the outflow from the envelope.
5 Discussion
5.1 Comparing to the previous results
With a more complete coverage, the envelope is detected to a two times larger extent at upto three times higher resolution than that in Paper I . The infall velocity can now be better determined with less outflow contamination, and is found to be 40% of that derived in Paper I . The rotation profile in the inner part of the envelope can now be better constrained with a larger extent of the envelope, and is found to be more like Keplerian but with a 30% higher velocity than that found in Paper I . Thus, the inner part of the envelope is no longer to be consistent with a dynamically infalling disklike envelope (or pseudo-disk), as suggested in Paper I . Previously, the mass of the central source was derived from the infall velocity assuming a dynamical infall and found to be 0.8 , but now is from the Keplerian rotation velocity and found to be 1.25 . In addition, the compact SO envelope near the source is now better resolved and thus better separated from the outflow cavity walls. The PV structure that was seen at the outer edge of the SO envelope, with the velocity decreasing with the decreasing distance from the source, is not seen here anymore. That PV structure is expected to be from the outflow walls (Lee et al., 2000). Thus, the outer edge of the SO envelope does not trace the inner edge of a pseudo-disk, as suggested in Paper I . As a result, the previous comparison of the inner part of the envelope to a collapsing magnetized rotating toroid of Allen, Li, & Shu (2003) and Mellon & Li (2008) is not appropriate anymore.
5.2 Collapsing envelope
The outer part of the envelope seems infalling toward the center with constant specific angular momentum, as found in other Class I sources (Ohashi et al., 1997a; Momose et al., 1998; Lee & Ho, 2005). The kinematics there is qualitatively consistent with that predicted in some infalling disklike envelopes (or pseudo-disks), either magnetized Terebey et al. (1984); Krasnopolsky & Königl (2002) or nonmagnetized (see, e.g., Nakamura, 2000), where the material is infalling toward the center with its angular momentum. The infall velocity is 80% of the rotation velocity at 7000 AU at the edge of the envelope, and it drops to 40% of the rotation velocity at 2000 AU at the transition radius. Therefore, in details, this part of the envelope is actually different from those collapsing envelopes found in other Class I sources (Ohashi et al., 1997a; Momose et al., 1998; Lee & Ho, 2005), where the infall velocity is larger than the rotation velocity. The HH 111 is probably in a later stage than those sources, with the motion already dominated by the rotation. The material in the envelope here is slowly spiraling inward and the centrifugal force progressively increases, so that the rotation can indeed become Keplerian at 2000 AU. The infall rate in this part of the envelope is constant and given by
This infall rate is similar to that seen in other Class I sources (Ohashi et al., 1997a; Momose et al., 1998). Note that the infall rate here is a factor of 2 lower than that derived in Paper I because of a factor of 2 lower in the infall velocity derived here.
An accretion shock is expected to occur at the transition radius, see e.g., Yorke & Bodenheimer (1999). This accretion shock has also been suggested to be present in the younger protostellar system L1157 (Velusamy et al., 2002) at a much smaller radius at 400 AU at a much younger age in the Class 0 phase. Here in HH 111, the isothermal sound speed in the envelope, which can be derived from the temperature, is 0.15 km s-1 at 7000 AU and 0.22 km s-1 at 2000 AU. Thus, in the outer part of the envelope, the infall velocity is 1.11.4 times the isothermal sound speed, and is thus only slightly supersonic at that large distance. As a result, unlike that in L1157, the accretion shock is expected to be weak at the transition radius and thus not easy to be detected.
5.3 2000 AU Sub-Keplerian disk?
In the inner part of the envelope, where the rotation has become Keplerian, the infall velocity is uncertain and assumed to follow the same velocity profile as that in the outer part. It is 40% of the rotation velocity. It increases from 1.4 to 2 times the isothermal sound speed from the transition radius to the vicinity of the source at 240 AU (). However, as mentioned earlier, the infall velocity could be overestimated and it could actually be subsonic as expected for a rotationally-supported disk with a Keplerian rotation. Therefore, the transition radius could indeed be the centrifugal radius, where the centrifugal force is balanced by the gravitational force. If that is the case, then the rotationally supported disk is quite large with a radius of 2000 AU. A disk with such large radius has been seen in the simulations of Yorke & Bodenheimer (1999), as a result of a gravitational collapse of a rotating spherical cloud. In their simulations, the angular momentum is transported outward via tidally induced gravitational torque. The HH 111 system can be compared to their model H, in which the cloud was set up to have a mass of 2 and a specific angular momentum of 1333 AU km s-1 at the cloud edge. In that model, the cloud initially has a radius of 13333 AU and it collapses to form a quasi-static Keplerian disk surrounded by an infalling envelope. At the age of yr, the disk has grown up to 1800 AU in radius with a central mass of 1.121 (see their Figures 2), similar to the HH 111 system. Further observations at higher resolution are needed to check if the infall velocity here can really be subsonic.
Alternatively, this inner part of the envelope can be considered as a 2000 AU sub-Keplerian disk with a small infall motion. Assuming that both the infall and rotation motions are due to the gravitational force from the center, then the mass of the center source would be times that derived earlier, and the disk would be rotating at 96% of the Keplerian velocity. A similar sub-Keplerian disk with a radius of 2000 AU is also seen in the Class I source L1489 IRS, with a similar mass ( 1.3 ) of the central source and a similar ratio ( 0.4) of the infall velocity to the rotation velocity (Brinch et al., 2007). A smaller rotating disk with a radius of 600 AU is also seen in the Class I source IRAS 04365+2535, with a smaller mass of 0.5 for the central source (Ohashi et al., 1997b). This disk seems to have some small infall motion too (Ohashi et al., 1997b) and thus can also be considered as a sub-Keplerian disk. Note that the sizes of these sub-Keplerian disks seem to scale roughly linearly with the mass of the central source. These sub-Keplerian disks are expected to become fully rotationally-supported Keplerian disks closer to the source, where the infall velocity is expected to drop below the sound speed and thus become much smaller than the rotation velocity. Here in HH 111, the rotationally-supported disk must have already formed around the source to launch the jet.
The accretion rate in the disk can be assumed to be the same as the infall rate in the outer part of the envelope. From CO bullets along the jet axis, the mass-loss rate was estimated to be 4 yr-1 in one side of the jet (Cernicharo & Reipurth, 1996) and thus 8 yr-1 in two sides. Therefore, the mass-loss rate to accretion rate ratio is 0.19, comparable to that predicted in current MHD models (Shu et al., 2000; Pudritz et al., 2007). With a velocity of 300-500 km s-1 (Cernicharo & Reipurth, 1996), the jet has a mechanical luminosity of 6-16 , about 30-80% of the bolometric luminosity of the source, which is 20 (Reipurth, 1989, corrected for the new distance of 400 pc). Assuming a stellar mass of and a stellar radius of , the accretion luminosity is . This luminosity is comparable to the sum of the mechanical luminosity of the jet and bolometric luminosity of the source, as expected if both luminosities are derived from gravitational potential energy released in the accretion.
5.4 SO shocks in the disk?
The SO emission is seen in the equatorial plane, with a mean radius of 400 AU (). It is seen with a rotation similar to that seen in C18O. Since SO emission has been found to trace warm and shocked regions (Codella et al., 2005; Lee et al., 2006, 2010), could the SO emission here trace a shock in and around the disk? The peak intensity of the SO emission is Jy beam-1 km s-1 in a beam of . Assuming that the emission is optically thin and is from a region in LTE at a temperature of 100 K (Codella et al., 2005), then the column density of SO is cm-2. Since the emission is not well resolved, this value should be considered as a lower limit. Dividing this column density by that of H2 in the model at , which is 6.2 cm-2, the SO abundance is found to be , higher than that found in the ambient material, which is 1-4 (Codella et al., 2005), but lower than that found in the jet, which is 2 (Lee et al., 2010). Therefore, the SO emission here could trace a weak shock in the inner part of the disk, such as the inner accretion shock on the disk surface (Yorke & Bodenheimer, 1999). However, it is also possible that the SO emission traces the accretion shock between the sub-Keplerian disk and the rotationally-supported disk.
5.5 Ejection?
It has been proposed that the VLA 1 and 2 sources were first formed at the dark ridge position and then ejected to the east and west, respectively (Reipurth et al., 1999). In our observations, the peaks of the C18O emission shift from the dark ridge position to the east to the VLA 1 position from the low to high velocity. This shift of the emission peaks seems to support that the VLA 1 source was indeed formed at the dark ridge position and then ejected to the east, as proposed. The ejection was estimated to take place only 3000 yrs ago (Reipurth et al., 1999). Therefore, the outer part of the envelope that is seen at low velocity does not have enough time to react to this ejection. It is aligned with the dark ridge likely because it is the one that produces the dark ridge with dust extinction. No dust emission is detected toward the dark ridge position because of the low density in the outer part of the envelope. On the other hand, the inner part of the envelope that is seen at high velocity and the disk have reacted to this ejection, carried away by the VLA 1 source, as seen in the observations.
6 Conclusion
The envelope and disks in the HH 111 protostellar system can be better studied with more complete coverage than that in Paper I . The 1.33 mm continuum emission is now spatially resolved into two components, a bright one associated with the VLA 1 source and a much fainter one associated with the VLA 2 source, likely tracing the dusty putative disks around the two sources. The emission around the VLA 1 source is elongated in the equatorial plane with a radius of 300 AU. The envelope is well seen in C18O, extending from 60 to 7000 AU out from the VLA 1 source, with the innermost part overlapping with the dusty disk. It has a differential rotation, with the outer part ( 2000–7000 AU) better described by a rotation that has constant specific angular momentum and the inner part ( 60–2000 AU) by a Keplerian rotation. The envelope seems to have some infall motion too. The amount of infall motion, however, could be overestimated due to outflow contamination. The infall velocity to rotation velocity ratio is found to decrease from 0.8 at the edge of the envelope to 0.4 at the transition radius and in the inner part of the envelope. Thus, the material in the outer part of the envelope seems to be slowly spiraling inward with its angular momentum and the rotation can indeed become Keplerian in the inner part. A compact SO emission is seen around the VLA 1 source with a radius of 400 AU and it may trace a shock such as an (inner) accretion shock around the disk. It seems that the VLA 1 source was first formed in the dark ridge and then ejected to the east to its current position, as previously proposed.
References
- Allen, Li, & Shu (2003) Allen, A., Li, Z., & Shu, F. H. 2003, ApJ, 599, 363
- Brinch et al. (2007) Brinch, C., Crapsi, A., Hogerheijde, M. R., & Jørgensen, J. K. 2007, A&A, 461, 1037
- Cernicharo & Reipurth (1996) Cernicharo, J., & Reipurth, B. 1996, ApJ, 460, L57
- Codella et al. (2005) Codella, C., Bachiller, R., Benedettini, M., Caselli, P., Viti, S., & Wakelam, V. 2005, MNRAS, 361, 244
- Ho et al. (2004) Ho, P. T. P., Moran, J. M., & Lo, K. Y. 2004, ApJ, 616, L1
- Krasnopolsky & Königl (2002) Krasnopolsky, R., Königl, A. 2002, ApJ, 580, 987
- Lee et al. (2010) Lee, C.-F., Hasegawa, T. I., Hirano, N., Palau, A., Shang, H., Ho, P. T. P., & Zhang, Q. 2010, ApJ, 713, 731
- Lee & Ho (2005) Lee, C.-F., & Ho, P. T. P. 2005, ApJ, 632, 964
- Lee et al. (2006) Lee, C.-F., Ho, P. T. P., Beuther, H., Bourke, T. L., Zhang, Q., Hirano, N., & Shang, H. 2006, ApJ, 639, 292
- (10) Lee, C.-F., Mao, Y.-Y., & Reipurth, B. 2009, ApJ, 694, 1395
- Lee et al. (2000) Lee, C.-F., Mundy, L. G., Reipurth, B., Ostriker, E. C., & Stone, J. M. 2000, ApJ, 542, 925
- Lovas (1992) Lovas, F. J. 1992, Journal of Physical and Chemical Reference Data, 21, 181
- Mellon & Li (2008) Mellon, R. R., & Li, Z.-Y. 2008, ApJ, 681, 1356
- Momose et al. (1998) Momose, M., Ohashi, N., Kawabe, R., Nakano, T., & Hayashi, M. 1998, ApJ, 504, 314
- Nakamura (2000) Nakamura, F. 2000, ApJ, 543, 291
- Ohashi et al. (1997a) Ohashi, N., Hayashi, M., Ho, P. T. P., & Momose, M. 1997a, ApJ, 475, 211
- Ohashi et al. (1997b) Ohashi, N., Hayashi, M., Ho, P. T. P., Momose, M., Tamura, M., Hirano, N., & Sargent, A. I. 1997b, ApJ, 488, 317
- Pudritz et al. (2007) Pudritz, R. E., Ouyed, R., Fendt, C., & Brandenburg, A. 2007, Protostars and Planets V, 277
- Reipurth (1989) Reipurth, B. 1989, Nature, 340, 42
- Reipurth, Raga, & Heathcote (1992) Reipurth, B., Raga, A. C., & Heathcote, S. 1992, ApJ, 392, 145
- Reipurth et al. (1999) Reipurth, B., Yu, K. C., Rodríguez, L. F., Heathcote, S., & Bally, J. 1999, A&A, 352, L83
- Rodríguez et al. (2008) Rodríguez, L. F., Torrelles, J. M., Anglada, G., & Reipurth, B. 2008, AJ, 136, 1852
- Shu (1977) Shu, F. H. 1977, ApJ, 214, 488
- Shu et al. (2000) Shu, F.H., Najita, J., Shang, H., & Li, Z. -Y. 2000, in Protostars and Planets IV, ed. V. Mannings, A. P. Boss & S. S. Russell (Tucson: University of Arizona Press), 789
- Terebey et al. (1984) Terebey, S., Shu, F. H., & Cassen, P. 1984, ApJ, 286, 529
- Velusamy et al. (2002) Velusamy, T., Langer, W. D., & Goldsmith, P. F. 2002, ApJ, 565, L43
- Yorke & Bodenheimer (1999) Yorke, H. W., & Bodenheimer, P. 1999, ApJ, 525, 330