Large decrease of fluctuations for supercooled water in hydrophobic nanoconfinement
Abstract
Using Monte Carlo simulations we study a coarse-grained model of a water layer confined in a fixed disordered matrix of hydrophobic nanoparticles at different particle concentrations . For we find a first-order liquid-liquid phase transition (LLPT). For our simulations are consistent with a LLPT line ending in two critical points at low and high pressure . For at high and low temperature we find a dramatic decrease of compressibility , thermal expansion coefficient , and specific heat . Surprisingly, the effect is present also for as low as . We conclude that even a small presence of nanoscopic hydrophobes can drastically suppress therodynamic fluctuations, making the detection of the LLPT more difficult.
pacs:
64.70.Ja, 65.20.-w, 66.10.C-Many recent experiments investigate the behavior of water in confined geometries confined for its relevance to nanotechnology, e.g., filtering water in carbon nanotubes nanotube , and biophysics, e.g., intracellular water Granick08 . An interesting property of nanoconfined water is that it remains liquid at temperatures where bulk water freezes. The present technology allows us to observe bulk water in its liquid phase below C if quenched very rapidly (supercooled), but ice formation cannot be avoided below C (at 1 atm). Interestingly, a number of theories and models predict a peculiar thermodynamic behavior for bulk water below , with a liquid-liquid phase transition (LLPT) Poole ; Franzese ; Pashek . Although studying nanoconfined water could shed light on the phase diagram of deeply supercooled water, experiments and simulations theo show that fluid-fluid phase transitions in a confined space can differ from those in bulk water. Several studies using specific geometries, e.g., slits slits ; Truskett01 ; Kumar05 or disordered matrices of disks or spheres Urbic2004 ; Gallo07 , have clarified some aspects but leave open questions about the thermodynamics of supercooled confined water confined ; Truskett01 ; Soper08 ; Ricci09 .
It has been proposed that supercooled water forms highly structured regions in the hydration shell of nonpolar solutes ice-like , where the hydrogen bond (HB) network is weakened only when the size of the hydrophobic particles is above a characteristic value Stillinger , calculated using free energy analysis to be nm chandler . Muller explained experimental results by assuming enthalpic strengthening of the hydration HBs with a simultaneous entropy increase in the hydration shell Muller .
Here, motivated by several experiments on water in a strong hydrophobic confinement confined ; nanotube ; Granick08 ; Zhang09 , we consider a water monolayer of thickness nm in a volume partitioned into cells of a square section of size . Each cell is occupied by either a water molecule or a hydrophobic particle. Particles can occupy more than one cell, depending on their size, are spherical and approximated by the set of cells with more than of their volume inaccessible to water. Particles are randomly distributed and form a fixed matrix that mimicks a porous system or a rough atomic interface. is the total number of cells occupied by water molecules and is their total volume. The Hamiltonian for water-water interaction is Franzese
| (1) |
Here is the distance between water molecules and , for Å, the water van der Waals diameter, for with kJ/mol, the van der Waals attraction energy, and for , the cut-off distance.
The second term of Eq. (1) describes the directional HB interaction, with kJ/mol, and the total number of HBs , where for a water molecule when (liquid density, with ) and for a hydrophobic particle. A HB breaks when the OH—O distance exceeds Å, because when the O–O distance Å (Å). It also breaks if . Therefore, only 1/6 of the orientation range in the OH–O plane is associated with a bonded state. By allowing possible states for each index , we account for the entropy loss associated with the formation of a HB because, by definition, if , otherwise. The notation denotes that the sum is performed over nearest–neighbors (n.n.) water molecules and , so that each water molecule can form up to four HBs.
HB formation increases the volume per molecule, because it leads to an open network of molecules with reduced n.n. due to close molecular packing. We incorporate this effect by an enthalpy increase for each HB, where is the average density increase between high density ices VI and VIII and low density (tetrahedral) ice Ih.
The third term of Eq. (1) accounts for the HB cooperativity, with kJ/mol, where indicates each of the six different pairs of the four bond-indices of a molecule . It gives rise to the O–O–O correlation, locally driving the molecules toward an ordered configuration Ricci09 .
The water-nanoparticle interaction is purely repulsive, , with kJ/mol Gallo07 , where is the distance between the water cell and each of the cells occupied by the nanoparticle. The restructuring effect of hydrophobic particles on water is incorporated by replacing and in the hydration shell with and , following patel-debenedetti-stillinger . Because bonding indices facing the nanoparticle cannot form HBs, at intermediate they have a number of accessible states larger than those facing water molecules, inducing an increase of hydration entropy Muller .
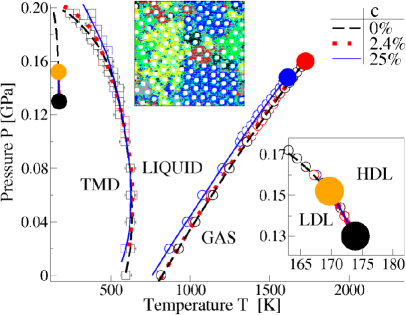
We perform Monte Carlo (MC) simulations for constant pressure , , and , with variable water volume , where is a stochastic continuous variable that fluctuates following the MC acceptance rule wolff . We simulate systems with within a fixed matrix of spherical nanoparticles of radius nm, with nanoparticle concentration and . We repeat the analysis for nm. For , the model has a phase diagram with a first-order LLPT, between a low density liquid and a high density liquid, starting at GPa for and ending in a critical point at K and GPa Franzese .
We find that for the liquid-gas spinodal is shifted to lower and the line of temperature of maximum density (TMD) is shifted to lower at low and to higher at high , with respect to the case, reminiscent of results for other models of confined water Gallo07 ; Kumar05 . We find stronger changes for increasing (Fig. 1).
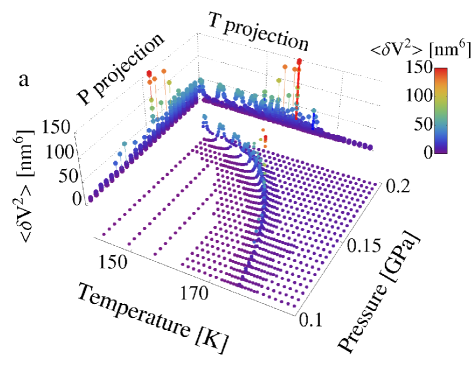
Further, we next find that confinement drastically reduces volume and entropy fluctuations at low . To quantify this reduction, we calculate volume fluctuations, entropy fluctuations, and cross-fluctuations of volume and entropy, and analyze the associated measurable response function, respectively, isothermal compressibility , isobaric specific heat and isobaric thermal expansion coefficient , e.g., see Figs. (2) and (3). For a water monolayer with cells confined within nanoparticles with nm at , we find a maximum along the isobar at GPa that is smaller than the case. If we decrease to , the reduction of is still remarkable: (Fig. 3). We find similar reductions for and .
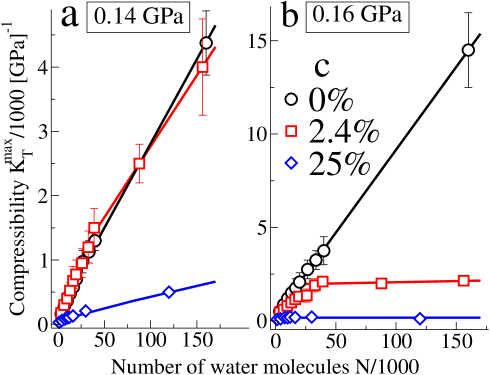
Such a dramatic reduction of at low and high suggests a possible change in the region of the phase diagram where water at displays the LLPT. From the general theory of finite size scaling, we know that at a first-order phase transition , and increase linearly with the number of degrees of freedom, here equal to . We find a linear increase for GPa GPa at , and only for GPa GPa at and , consistent with the absence of a first-order LLPT outside these ranges.
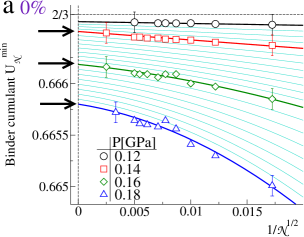
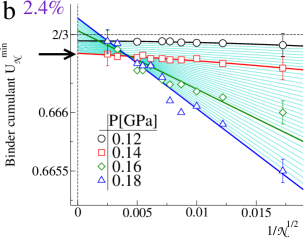
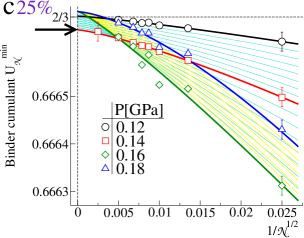
To better understand this new feature, i.e., the effect of confinement on the LLPT at high , we study the finite size scaling of the Binder cumulant Binder , where stands for the thermodynamic average for a system with cells. For , at fixed and , for any away from a first-order phase transition, while at a first-order phase transition Binder .
For , we find that for at GPa GPa, while , within the error bar, at GPa (Fig. 4a). Hence, this analysis confirms that for there is a first-order LLPT in the range GPa GPa.
For and , we find that, for large , at GPa, but not at GPa or at GPa (Fig. 4b,c). Hence, for and the first-order LLPT occurs only in a limited range of pressures around GPa, consistent with our results for (Fig. 2) or (Fig. 3), with two end-points: one at GPa, another at GPa (Fig. 1).
We interpret our findings as follows. As a consequence of the stronger HB in the hydration shell of each solute, at low the hydration water is more ordered with respect to the case. However, shells around different nanoparticles have a different local orientational order. This generates competing domains, reminiscent of the locally structured regions proposed in Ref. ice-like , and exhibits no macroscopic order (upper inset in Fig. 1). The large decrease in fluctuations and response functions, such as , is due to the presence of many domain boundaries. Our results for as low as indicates that the decrease is due to the introduction of a characteristic length scale, inversely proportional to , that limits the growth of the ordered structured regions. This is consistent also with the results for (Fig. 3), where the lower is , the larger is beyond which the confined behavior deviates from the case.
In previous theoretical analyses, with water confined by a fixed matrix of randomly distributed Lennard-Jones disks, the reduction of compressibility was observed only for large hydrophobic obstacle concentrations Urbic2004 . Here, instead, we find that is reduced for very low .
Our results are qualitatively consistent with recent experiments on H2O confined in the hydrophobic mesoporous material CMK-1-14 consisting of micrometer-sized grains, each with a 3-dimensional interconnected bicontinuous pore structure, with an average pore diameter Å, at a hydration level of at ambient pressure Zhang09 . Zhang et al. find that the TMD is shifted down by K with respect to the hydrophilic confinement in silica mesopores and that shows a much broader peak, spanning from to K, in contrast to the sharp peak at K in hydrophilic confinement Zhang09 , reminiscent of our results on the shift of TMD and the reduction of the response functions with respect to the case.
Recent results for small angle x-ray scattering for aqueous solutions of amphiphilic tetraalkyl-ammonium cations at ambient conditions suggest that the strengthening of the structure of hydration water is present only for solutes with radius smaller than nm Huang . We therefore repeat our analysis for small nanoparticles with nm, and find that our results are robust if the amount of hydrophobic interface in contact with water is kept constant with respect to the case of nm.
In conclusion, we predict that a water monolayer confined in a fixed matrix of hydrophobic nanoparticles at concentration displays changes in the thermodynamics and a drastic reduction, , in , , and with respect to the case. At as small as the first-order LLPT at high is no longer detected.
We thank S. V. Buldyrev, P. Ch. Ivanov, and K. Stokely for discussions and acknowledge support by NSF grants CHE0908218 and CHE0911389. GF thanks the Spanish MICINN grant FIS2009-10210 (co-financed FEDER).
References
- (1) M.-C. Bellissent-Funel et al., Phys. Rev. E 51, 4558 (1995). J. Swenson et al., Phys. Rev. Lett., 96, 247802 (2006). F. Mallamace et al., J. Chem. Phys. 124, 161102 (2006). S.-H. Chen et al., Proc. Natl. Acad. Sci. U.S.A. 103, 12974 (2006). D. Liu et al. ibid. 104, 9570 (2007). G. Findenegg et al., ChemPhysChem 9, 2651 (2008). C. A. Angell, Science 319, 582 (2008). R. Mancinelli et al., J. Phys. Chem. Lett. 1, 1277 (2010).
- (2) M. Majumder et al., Nature 438, 44 (2005). S. Joseph and N. R. Aluru, Phys. Rev. Lett. 101, 064502 (2008).
- (3) S. Granick and S. C. Bae, Science 322, 1477 (2008).
- (4) P. H. Poole et al., Nature 360, 324 (1992).
- (5) G. Franzese et al., J. Phys.: Condens. Matt. 14, 2201 (2002); 19, 205126 (2007); Phys. Rev. E 67, 011103 (2003). P. Kumar et al., Phys. Rev. Lett. 100, 105701 (2008). K. Stokely et al., Proc. Natl. Acad. Sci. U.S.A. 107, 1301 (2010).
- (6) D. Paschek, J. Chem. Phys. 120, 10605 (2004).
- (7) R. Kurita and H. Tanaka, Phys. Rev. Lett. 98, 235701 (2007). P. G. De Sanctis Lucentini and G. Pellicane, ibid. 101, 246101 (2008).
- (8) K. Koga et al., Nature 408, 564 (2000). N. Giovambattista et al., Proc. Natl. Acad. Sci. U.S.A. 105, 2274 (2008); G. Franzese and F. de los Santos, J. Phys.: Condens. Matter 21, 504107 (2009).
- (9) T. M. Truskett et al., J. Chem. Phys. 114, 2401 (2001).
- (10) P. Kumar et al., Phys. Rev. E 72, 051503 (2005).
- (11) T. Urbic et al., J. Mol. Liq. 112, 71 (2004).
- (12) P. Gallo and M. Rovere, Phys. Rev. E 76, 061202 (2007).
- (13) A. K. Soper, Mol. Phys. 106, 2053 (2008).
- (14) M. A. Ricci et al., Faraday Discuss. 141, 347 (2009).
- (15) H. S. Frank and M. W. Evans, J. Chem. Phys. 13, 507 (1945). K. A. T. Silverstein et al., ibid. 111, 8000 (1999).
- (16) F. H. Stillinger, J. Solution. Chem. 2, 141 (1973).
- (17) D. Chandler, Nature 437, 640 (2005).
- (18) N. Muller, Acc. Chem. Res. 23, 23 (1990).
- (19) Y. Zhang et al., J. Phys. Chem. B 113, 5007 (2009).
- (20) B. Patel et al., Biophys.J. 93, 4116 (2007).
- (21) M. G. Mazza et al., Comp. Phys. Comm. 180, 497 (2009).
- (22) At , increases for higher because depends weakly on , and occurs at lower .
- (23) K. Binder, Phys. Rev. Lett. 47 693 (1981); G. Franzese and A. Coniglio, Phys. Rev. E 58, 2753 (1998).
- (24) N. Huang et al., J. Chem. Phys. (under review).