MORPHOLOGY AND SIZE DIFFERENCES BETWEEN LOCAL AND HIGH REDSHIFT LUMINOUS INFRARED GALAXIES
Abstract
We show that the star-forming regions in high-redshift luminous and ultraluminous infrared galaxies (LIRGs and ULIRGs) and submillimeter galaxies (SMGs) have similar physical scales to those in local normal star-forming galaxies. To first order, their higher infrared (IR) luminosities result from higher luminosity surface density. We also find a good correlation between the IR luminosity and IR luminosity surface density in starburst galaxies across over five orders of magnitude of IR luminosity from local normal galaxies to SMGs. The intensely star-forming regions of local ULIRGs are significantly smaller than those in their high-redshift counterparts and hence diverge significantly from this correlation, indicating that the ULIRGs found locally are a different population from the high-redshift ULIRGs and SMGs. Based on this relationship, we suggest that luminosity surface density should serve as a more accurate indicator for the IR emitting environment, and hence the observable properties, of star-forming galaxies than their IR luminosity. We demonstrate this approach by showing that ULIRGs at and a lensed galaxy at exhibit aromatic features agreeing with local LIRGs that are an order of magnitude less luminous, but have similar IR luminosity surface density. A consequence of this relationship is that the aromatic emission strength in star-forming galaxies will appear to increase at for a given IR luminosity compared to their local counterparts.
Subject headings:
galaxies: evolution — galaxies: high-redshift — infrared: galaxies1. INTRODUCTION
Luminous and Ultraluminous Infrared Galaxies (LIRGs and ULIRGs) whose total infrared luminosities, , are in the range of and , respectively, are among the most important populations for the study of galaxy evolution. Their extreme signifies intense star formation hidden by dust and only visible through the infrared (IR) emission resulting from the reprocessing of UV photons that originate from populations of rapidly forming hot young stars. They are among the most extreme star-forming regions known.
A majority of the local ULIRGs are disturbed systems of galaxies undergoing mergers. Some ULIRGs harbor active galactic nuclei (AGN) often thought to be associated with merger activity and the resulting enhanced dense molecular gas fractions observed in the nuclei of these systems (e.g. Gao & Solomon, 2004; Juneau et al., 2009). Locally, luminous IR galaxies are very rare (Lagache et al., 2005) but they contribute significantly to the total IR energy density beyond redshift (e.g., Le Floc’h et al., 2005; Pérez-González et al., 2005; Rodighiero et al., 2010). At high redshift, , luminous IR galaxies are typified by submillimeter galaxies (SMGs; e.g. Blain et al., 2002). So far it is common to view SMGs as a more luminous counterpart of local ULIRGs. This naturally leads to the view of SMGs being disturbed, interacting systems (e.g. Tacconi et al., 2008).
However, there are many indications that the SEDs of the high redshift infrared galaxies differ systematically from those of local galaxies of similar luminosity. Papovich et al. (2007) found that the 70 (observed) outputs tended to be weaker relative to those at 24 (observed) than expected from local templates. Many authors have found that the aromatic bands in these galaxies appear to be similar in structure to those in significantly lower-luminosity local galaxies (e.g., Rigby et al., 2008; Farrah et al., 2008; Takagi et al., 2010). The far infrared SEDs appear to be cold, again similar to those of lower luminosity local galaxies (e.g., Pope et al., 2006; Symeonidis et al., 2009; Muzzin et al., 2010). These findings suggest an underlying physical difference between local luminous infrared galaxies and those at high redshift. Rigby et al. (2008) suggested that such a difference might arise either through reduced metallicity or lower optical depth due to a greater extent of the emitting regions. Erb et al. (2006) find that the metallicities are of order three times lower at for a given galaxy mass. Engelbracht et al. (2008) show that, for local galaxies, there is only a weak trend in 8 vs. down to solar metallicity, and that at lower metallicity the 8 luminosity is suppressed. This correlation is also reported for galaxies by Reddy et al. (2010). We conclude that reduced metallicity is unlikely to be the primary cause of the changes in SED with redshift. We therefore turn our attention to the second possibility, that the galaxies have structures different from local ones of similar luminosity.
Recent high-resolution studies of SMGs in the submillimeter, radio, and near-IR have shown that their star-forming regions are generally relatively extended, with diameters of order kpc (Chapman et al., 2004; Muxlow et al., 2005; Biggs & Ivison, 2008; Bothwell et al., 2010; Casey et al., 2009; Iono et al., 2009; Lehnert et al., 2009; Carilli et al., 2010; Swinbank et al., 2010a; Tacconi et al., 2010; Younger et al., 2010). Thus, the surface densities of the star formation rate (SFR) must be substantially lower in the high-z galaxies than for the local ones of similar . This paper explores the importance of this difference in explaining the different SED behavior. We make the simplest possible assumption, that the SED is a function of the SFR surface density, , and that galaxies with similar , and consequently similar surface density, , will have similar optical depths in their star forming regions and similar SEDs. In section 2, we describe the compilation of data for the study as well as discuss our derivation of a consistent set of sizes for the star forming regions for . Section 3 shows the results and discusses the implications for both galaxy evolution and for improved estimates of the SFRs of high redshift IR galaxies. We assume a CDM cosmology with , , and km s-1Mpc-1 throughout this paper.
2. THE MEASUREMENTS
A major challenge in studying the of galaxies across a broad redshift range is to obtain physical size information for the IR-emitting regions in a consistent way for both the local and high-redshift samples. We discuss in this section the compilation of physical sizes and IR luminosity data from the literature and our steps to compare them on the same metric. Despite the abundantly available high-quality data for local galaxies, it is necessary to select a subset that can best match the high-redshift sample. We therefore will begin our discussion with the high-redshift compilation, then follow with the local compilation.
2.1. Intermediate and High-Redshift Compilation
The past five years have seen an unprecedented number of high-resolution, multiwavelengths observations of high-redshift galaxies. Our compilation of the physical sizes of intermediate and high-redshift starburst galaxies is based on radio interferometric observations at the Multi-Element Radio Linked Interferometer Network (MERLIN) and the Very Large Array (VLA), as well as submillimeter interferometric observations at the IRAM Plateau de Bure Interferometer (PdBI). Submillimeter and 1.4 GHz observations, rather than rest-frame optical or near-IR, are chosen because they closely trace the star-forming regions of galaxies while being little affected by the old stellar light. The submillimeter is a more direct tracer in this regard because it observes thermal emission from dust while the 1.4 GHz data probe synchrotron radiation from supernovae remnants, whose progenitors are short-lived massive stars and hence indirectly trace star-formation. Because of the radio-infrared relation within galaxies (e.g., Murphy et al., 2006), radio observations should give a valid measure of the size of the active region in a star forming galaxy. Ivison et al. (2010a) report that the IR-radio relation could evolve at high redshifts. However, their reported evolution law given by is small and unlikely to affect significantly our estimation of IR-emitting region size using radio observations. Sargent et al. (2010), along with a recent result using Herschel by Ivison et al. (2010b), also found little or no evolution in the IR-radio relation at .
Although submillimeter transitions (e.g. CO) are more direct tracers of molecular clouds and star-forming regions than is radio emission, they tend to trace colder gas. In comparison, the star-forming regions in most local LIRGs and ULIRGs are sub-kpc in size (e.g., Condon et al., 1991). Thus the physical size given by submillimeter observation tends to be systematically larger than that of radio observations. Moreover, selection of high-redshift submillimeter galaxies will tend to result in a sample with colder SEDs, which are brighter in submillimeter wavelengths, and hence an inherently physically extended sample. This bias towards larger physical size should be more pronounced for the low CO transitions such as CO () and CO () and thus we will adopt sizes from higher CO transitions such as CO () and CO () if available. To be conservative, we will take the radio sizes to be the physical size of the star-forming region in galaxies and treat submillimeter sizes as upper limits to isolate this possible selection effect.
2.1.1 High-z Submillimeter Compilation
The submillimeter data were compiled from Tacconi et al. (2006), Tacconi et al. (2010), and Daddi et al. (2010). These authors used the IRAM PdBI to study submillimeter-selected samples using CO transitions with to resolution. Tacconi et al. (2006) observed six SMGs, including four sources from Greve et al. (2003) and Neri et al. (2003), and two new sources at redshifts . Their observations yield four resolved SMGs with a median FWHM diameter of kpc. One of the Tacconi et al. (2006) sources needs to be excluded because its radio emission is significantly stronger than predicted by the IR-radio relation, indicating the presence of an AGN. Tacconi et al. (2010) reported the physical sizes (effective CO diameters) of two sources in the Extended Groth Strip at redshifts to be 13 and 16 kpc in diameter, which they have found to be smaller but consistent with the size based on an I-band observation. It should be noted that although Tacconi et al. (2006) find the SMGs to be “compact”, they still generally are a factor of 100 larger in area than local ULIRGs of similar IR luminosities. Additionally, Daddi et al. (2010) reported sizes of four BzK-selected star-forming galaxies (one member of this sample also has 1.4 GHz size measurement from Casey et al. (2009), which we adopt in preference to the CO data). In total we have eight data points from the submillimeter observations; three from Tacconi et al. (2006), two from Tacconi et al. (2010), and three from Daddi et al. (2010). IR luminosities for these eight galaxies were estimated via the Rieke et al. (2009) formalism based on 24 fluxes from Hainline et al. (2009), Menéndez-Delmestre et al. (2009), and Spitzer deep imaging in Great Observatories Origins Deep Survey (GOODS, Dickinson et al., in prep.).
2.1.2 High-z Radio Compilation
The 1.4 GHz radio observations were drawn from Chapman et al. (2004); Muxlow et al. (2005); Biggs & Ivison (2008) and Casey et al. (2009). Chapman et al. (2004) used MERLIN+VLA with resolution to study 12 SMGs selected from the HDF at a median redshift of . of their targets were resolved with an effective median diameter measured above the contour of kpc. Biggs & Ivison (2008) used MERLIN+VLA to observe 12 SMGs in the Lockman Hole at with resolution (all sources were resolved). The sample was selected from SMGs found by surveys carried out with SCUBA and MAMBO (Scott et al., 2002; Greve et al., 2004; Coppin et al., 2006). Biggs & Ivison (2008) reported physical sizes of these SMGs ranging from kpc with a median of 5 kpc. Lastly, Casey et al. (2009) used MERLIN ( resolution) to observe seven ULIRGs and a HyLIRG selected by optical and radio color criteria from GOODS and the Lockman Hole at redshifts . They resolved all eight and report an average physical diameter of kpc, corresponding to the surface area within the detection level.
Muxlow et al. (2005) used MERLIN+VLA to conduct a deep 1.4 GHz survey of the HDF and Hubble Flanking Field (HFF) and studied 92 radio sources at with resolution. All but one source was resolved. For this study, we exclude sources that Muxlow et al. (2005) classified as AGN or AGN candidates. We also exclude the Muxlow sources that are observed only by the VLA and hence have lower resolution that may affect the accuracy of size estimates, as well as those with complex morphology such that their size estimation requires visual inspection (Muxlow et al., 2005; Thrall et al., 2007). Out of 92 objects from the Muxlow et al. (2005) sample, 72 have spectroscopic redshifts and 27 pass the aforementioned criterion and have a 24 counterpart in GOODS. Muxlow et al. (2005) reported sizes in terms of the largest angular size determined by Gaussian fitting (Thrall et al., 2007). Taking the largest angular size, which is the size of the major axis, as the diameter directly would overestimate the surface area; we assume that the sizes of the minor axes of these galaxies are 0.6 of the major-axis (the largest angular FWHM) and then calculate the surface areas and circularized diameters for the Muxlow et al. (2005) sample as reported in Table 2. This value is an average ratio of minor-to-major axes of SMGs from the Biggs & Ivison (2008) sample. An average physical diameter for the Muxlow et al. (2005) sample is kpc. for the Chapman et al. (2004), the Muxlow et al. (2005), and the Casey et al. (2009) samples in the GOODS field were estimated via the Rieke et al. (2009) formalism and the Spitzer 24 imaging in GOODS. for the Biggs & Ivison (2008) and the Casey et al. (2009) samples in other fields are also estimated using the Rieke et al. (2009) formalism based on the 24 fluxes reported by Ivison et al. (2007) and Casey et al. (2009).
Apparently there are two approaches in reporting galaxy sizes from the radio measurements: the deconvolved FWHM (Muxlow et al., 2005; Biggs & Ivison, 2008) and the circularized diameter enclosing the surface area of the radio detections (Chapman et al., 2004; Casey et al., 2009). Despite the methodological differences between these two approaches, they agree very well for the objects with overlapping observations, especially in the HDF where there are six such galaxies. This agreement is expected, since the area detected above is likely to be consistent with that of half-max power given the typical levels of signal to noise ratio in the observations. We also note a very good agreement of sizes from 1.4 GHz and CO () observations of a HDF object, SMMJ123707+6214SW, where observations from Muxlow et al. (2005) and Tacconi et al. (2006) overlap.
Although galaxies drawn from the aforementioned samples are likely dominated by star-forming activity, we independently confirm this by inspecting whether their ratio of 850 and 1.4 GHz fluxes follows the IR-radio relation for starburst galaxies given by Rieke et al. (2009). Galaxies with radio flux significantly stronger than predicted by the IR-radio relation likely harbor radio-loud AGN. Indeed, we have found that the only two objects with FF are the most compact objects in our compilation (consistent with AGN-domination) and thus we exclude these objects (SMMJ163650.43+405734.5 and SMMJ105207.49+571904.0). It is worth noting that this test is unnecessary for the Muxlow et al. (2005) sample, where both radio spectral slope and radio morphology are already employed to identify AGN and AGN candidates.
In total our compilation has 48 intermediate and high-redshift starburst galaxies with a median redshift of 1.0 and a median size of 5.1 kpc. Our primary sample comprises the 27 galaxies from Muxlow et al. (2005), which should provide an unbiased and complete sample, selected by radio flux alone. The results from the additional 21 galaxies are consistent with those from the Muxlow et al. (2005) observations.
2.2. Local Compilation
For local galaxies, there is no homogeneous set of radio or submillimeter images suitable for our needs. Therefore, we use two additional measures of the star formation rate, Paschen- images (Alonso-Herrero et al., 2006) and images at 24 from a number of sources. As with the radio, both measures are not strongly affected by extinction and are good tracers of star forming activity (e.g., Murphy et al., 2006; Calzetti et al., 2010). Although radio images of local galaxies have somewhat larger extent than these other indicators, the high surface brightness areas that would dominate the high-redshift measurement have very similar morphologies and sizes (Murphy et al., 2006).
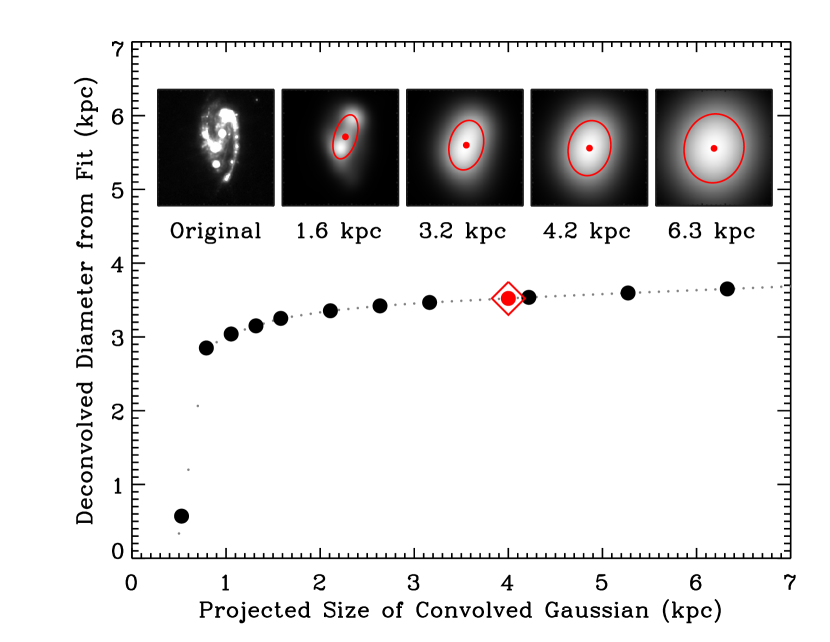
The high redshift galaxies have limited structural information, typically equivalent to a FWHM from Gaussian fitting or deconvolution of the observed image, in which the galaxy is only modestly well resolved. The FWHM of the beam is typically to . A beam corresponds to a diameter of 5 kpc at , 7.5 kpc at , and 8.5 kpc at . However, the images of local galaxies often provide many more resolution elements across the target. To put them on the same scale as the radio images at high redshift, we convolved them with a Gaussian beam, and then determined sizes by Gaussian fitting and deconvolution. We demonstrate with a typical case of local star-forming galaxy in Fig. 1 that this method yields a robust measurement of physical sizes for local galaxies.
Despite our efforts to put all the images on the same basis, a possible source of systematic error remains. An image with low signal to noise will tend not to go as far into the wings of the star-forming activity and hence there will be a tendency for a systematic reduction in the estimated FWHM with decreasing signal to noise. Thus, the sizes of the high-redshift galaxies may be underestimated compared with the local ones. Since the major result of this paper is that the high-z galaxies have substantially larger sizes than local ones of similar luminosity, the result is that we may understate this conclusion, not that it would be undermined.
We describe our compilation of local IR galaxies in detail in the Appendix. It comprises 19 normal star-forming galaxies ( ), 21 luminous IR galaxies (LIRG, ), and 4 ultraluminous IR galaxies (ULIRG, ).
2.3. HST Imaging of the High-Redshift Sample in the GOODS-N Field
Since 36 of 48 high-redshift galaxies in our sample are in the Hubble Deep Field imaged by the Great Observatories Origins Deep Survey (GOODS; Dickinson et al., in prep.) using the Advanced Camera for Survey (ACS) on the Hubble Space Telescope, we investigate the GOODS imaging (Version 2.0) of these galaxies in the B, V, , and bands. Details about the ACS observations of GOODS as well as the data can be found in Giavalisco et al. (2004) and at the survey’s website111http://www.stsci.edu/science/goods.
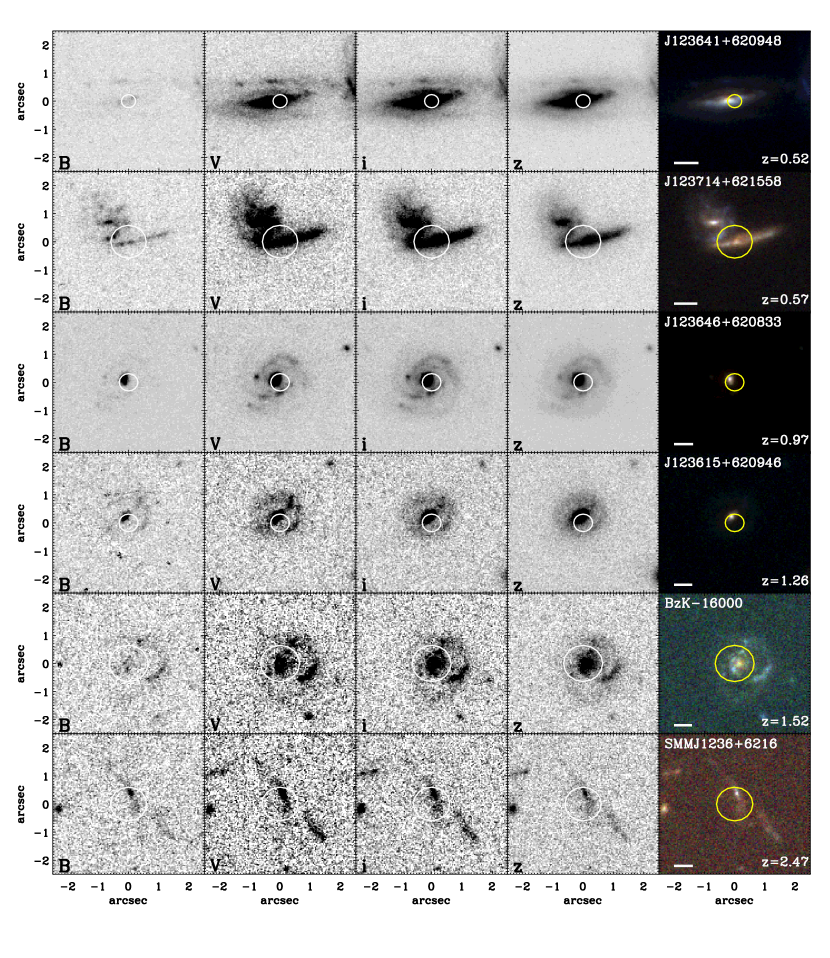
GOODS optical images are used to confirm independently that the sizes and positions of the star-forming regions determined by radio or submillimeter observations are consistent with the high-resolution optical observations. The synthesized beam sizes of the radio and submillimeter observations are while the optical imaging in GOODS/ACS has resolution at pixel. Although the radio and submillimeter observations can constrain the size of the star formation regions without being affected by stellar emission, their interpretation benefits from high-resolution optical imaging, especially for morphological classifications. We illustrate the circularized size for the star-forming regions compared to the optical extents of their host galaxies as seen in various optical filters in Fig. 2. The star-forming regions seen at radio and submillimeter wavelengths typically coincide with the central part of the optical structure, but there are a few cases where the star-forming region is at the collision interface of an interacting system (e.g. J123714+621558, J123716+621643). We will discuss our qualitative assessment of optical morphologies to address the structure of high-redshift star-forming galaxies in § 3.2.
3. RESULTS
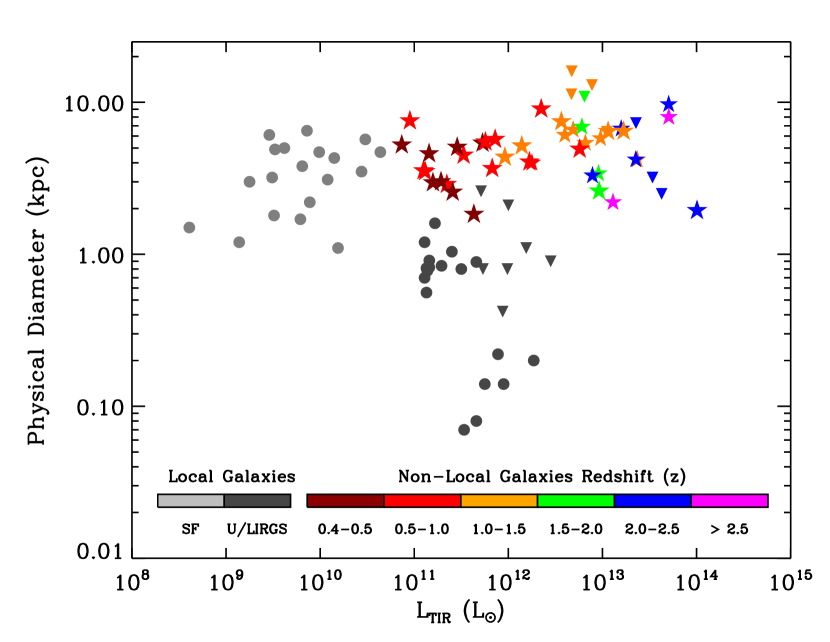
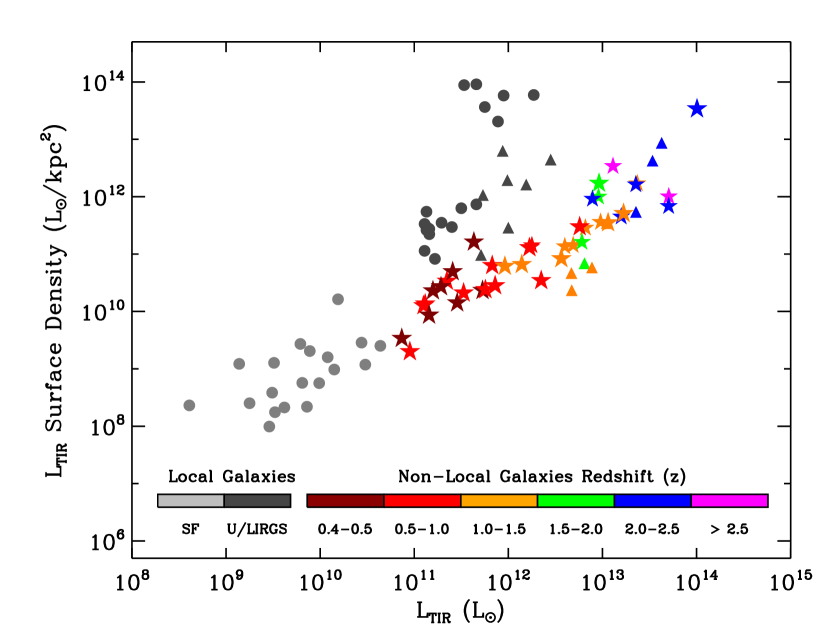
Our determinations of the physical sizes and luminosities for star-forming galaxies from the local sample out to the high-redshift SMGs are summarized in Fig. 4. We find the physical sizes of star-forming galaxies to be comparable within an order of magnitude across the entire IR luminosity ( ) and redshift range (). Local LIRGs and ULIRGs, however, are significantly smaller in size. It follows from Fig. 4 and is apparent from the diagram of as a function of in Fig. 4 that there is a correlation extending more than five orders of magnitude between and . A linear fit to this correlation yields a formal slope of . However, given the inhomogeneity of the methods employed to estimate uncertainties in each of the subsamples comprising our compilation, we expect the uncertainty for this formal slope to encompass the slope of unity and hence suggest that the two parameters are proportional to each other.
Local LIRGs and ULIRGs have orders of magnitude higher than indicated by this correlation suggesting that the starburst regions in these galaxies are not representative of their high-redshift counterparts of similar . In fact, local ULIRGs with have a comparable to high-redshift SMGs with .
3.1. as a Tracer of Star-Forming Environment
The aforementioned correlation suggests an explanation for the strong aromatic emissions as well as the SEDs of star-forming galaxies at high redshift. If we assume that , and hence , is an accurate indicator of the star-forming environment in starburst galaxies, Fig. 4 would suggest that ULIRGs have similar environments to local LIRGs with an order of magnitude lower , and likewise SMGs have similar environments to local ULIRGs with two orders of magnitude lower . We test this possibility with three independent approaches.
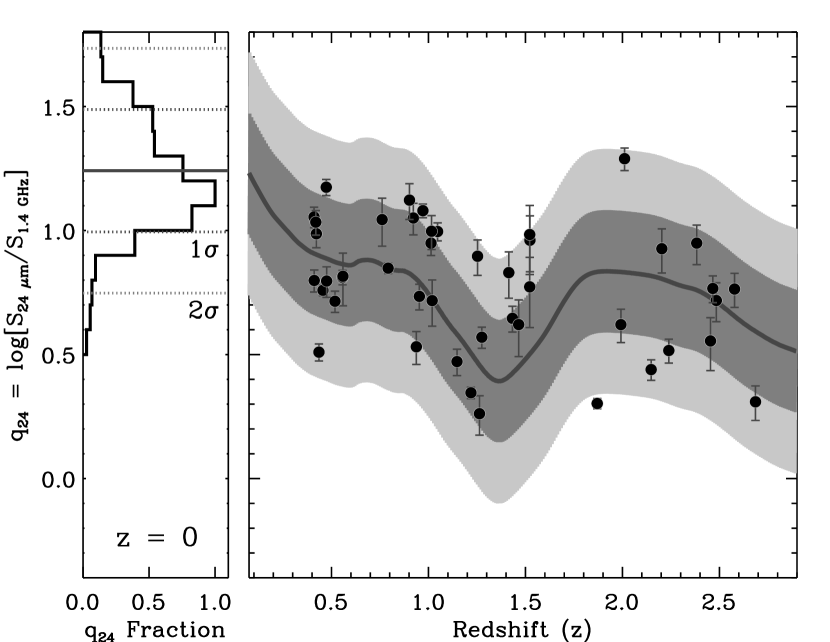
First, we compare the logarithmic ratio of flux and 1.4 GHz flux, log(S24/S1.4) or , predicted by the SEDs of local LIRGs and ULIRGs and the observed flux ratio for high-redshift galaxies. At redshift the Spitzer 24 observed bandpass probes rest-frame wavelengths of and thus at these redshifts is highly sensitive to emission from aromatic complexes, which are sensitive to the star formation environment. We first investigate the intrinsic scatter of by considering the scatter observed locally derived from the IRAS and VLA observations, shown in the top panel of Fig. 5. If we assume a similar scatter around the mean value of and project this scatter to higher redshifts, the bottom panel of Fig. 5 demonstrates that the observed scatter at high redshift is within the expected scatter based on local observations.
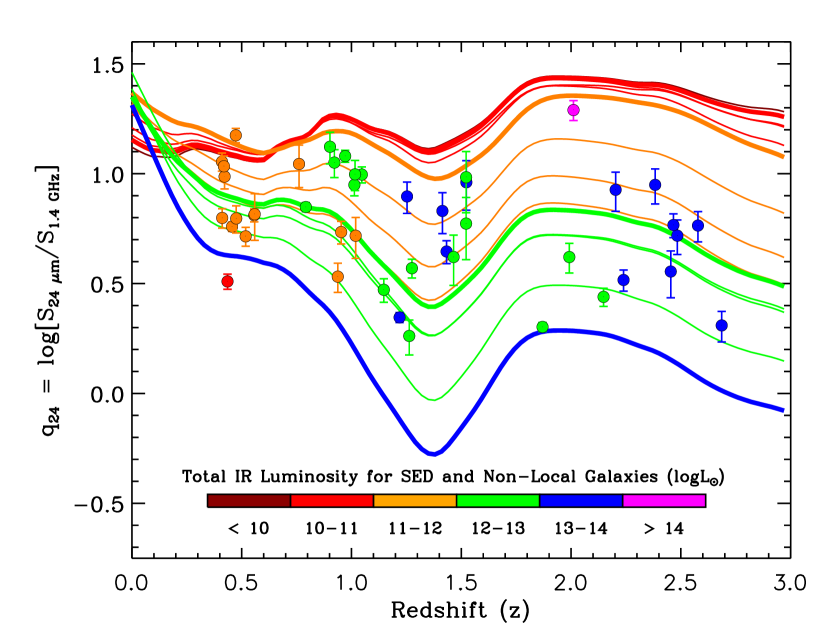
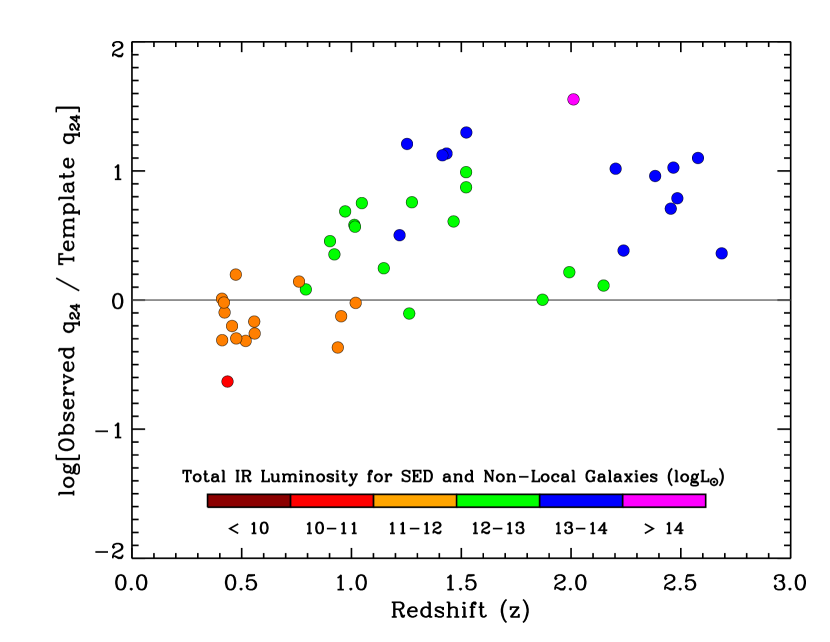
We then show in the right panel of Fig. 5 that for high-redshift galaxies is consistent with the ratios from local LIRGs and ULIRGs with significantly lower . Consider the SMGs at with ; the correlation in Fig. 4 suggests their starburst environment to be similar to local ULIRGs with and is clearly inconsistent with the extrapolation for local ULIRGs at while agreeing with the SED for local ULIRGs. Another way to interpret this is illustrated by Fig. 6 that the aromatic features are significantly stronger compared to local SED templates at redshifts greater than .
Second, we consider a result from Rigby et al. (2008), specifically their Fig. 3, that shows aromatic emissions for SMM J1635554.2+661225, a lensed SMG at . This SMG has of , which would be hardly detectable if not for the lensing magnification. The magnification also allows high signal-to-noise mid-IR spectroscopy with Spitzer, in which Rigby et al. (2008) found aromatic emission band shapes similar to those of NGC 2798 and to the average mid-IR spectra of 13 local normal starburst galaxies with average of (Brandl et al., 2006; Dale et al., 2007). This result is consistent with the relationship given in Fig. 4; high-redshift galaxies with of would have similar to local galaxies with an order of magnitude lower .
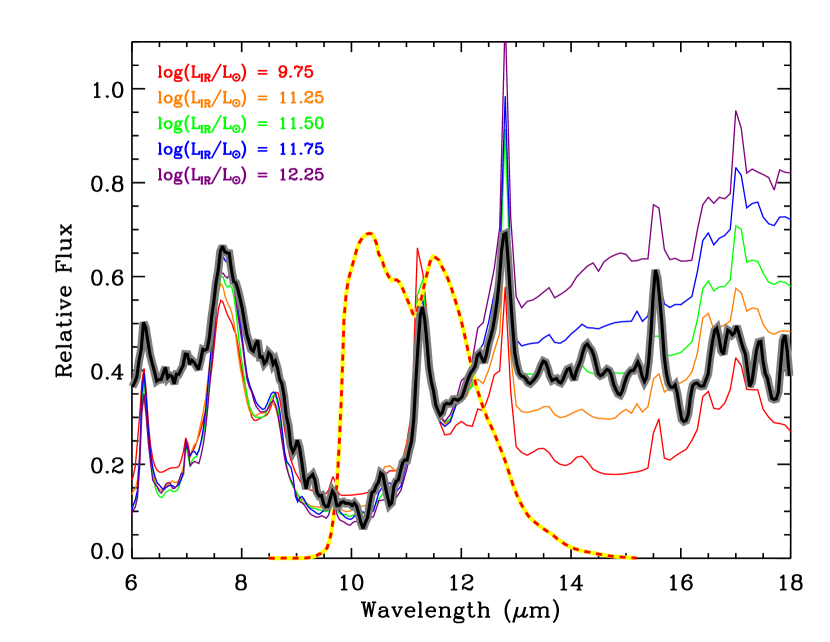
Third, we compare a stacked mid-IR spectrum of ULIRGs observed by Dasyra et al. (2009) with the local SEDs from Rieke et al. (2009). Fig. 4 suggests that the spectral features of local galaxies should be similar to those for ULIRGs with . We confirm this prediction in Fig. 7, where the average observed spectrum is indeed consistent with local LIRGs with of and clearly departs from the local SED for ULIRGs.
These tests support our hypothesis that is a valid tracer for the starburst environment and the observable spectral features. More importantly, they independently confirm that high-redshift star-forming galaxies, including SMGs, have similar star-forming environments to local normal star-forming galaxies and their higher star-formation rate is primarily due to higher .
3.2. A Unified View of Star-Forming Galaxies
We believe from the nearly consistent sizes of local and high-redshift star-forming galaxies that the most significant evolution between these two populations is in the . In other words, while the sizes of these galaxies remain about the same, their star formation rate densities increase greatly from normal star-forming galaxies to SMGs.
Apart from many high-resolution observations of high-redshift SMGs that find them to be physically extended systems, recent observations of the 158 [CII] line provide another probe into the environment of the star-forming regions. The [CII] line is an important cooling line for the photodissociation regions at the surfaces of molecular clouds. Combining this [CII] line with the CO () line yields a color-color diagram of LLIR vs. LLIR that is sensitive to both the incident UV flux and the gas density. Hailey-Dunsheath et al. (2010) study the environment of the galaxy MIPS 1428 that has and report that its LLIR is a factor of higher than for local ULIRGs while the LLIR ratios are comparable, indicating a similar incident UV flux in both populations but that the gas density of MIPS 1428 is lower than those in local ULIRGs. This behavior suggests a galaxy-wide starburst. Ivison et al. (2010c) apply this analysis using Herschel measurements, resulting in a similar finding for SMMJ2135 at . The star-forming environments in these two high-redshift galaxies appear to be similar to M82 and other normal starburst galaxies rather than to local ULIRGs (Hailey-Dunsheath et al., 2010; Ivison et al., 2010c). SMMJ2135 is a particularly noteworthy case because it is lensed by , which allowed Swinbank et al. (2010b) to observe it with the SMA at resolution. They resolved the galaxy into four pc massive star-forming regions distributed across the projected distance of 1.5 kpc, directly confirming the distributed nature of the galaxy-wide star formation.
The optical morphologies of the subsample observed by GOODS, shown in Fig. 2, suggest that of the subsample are quiescent, normal galaxies and the other show signs of disturbed morphologies. The fraction of disturbed morphologies increases with redshift. However, only systems out of 36 can be identified positively as interacting systems, while the rest of those with disturbed morphologies could as well be due to instabilities fueled by rapid, asymmetric infall of gas resulting in large clumps of star-forming regions similar to those seen in SMMJ2135. Lehnert et al. (2009) also observed clumpy, galaxy-wide starbursts in 11 star-forming galaxies at in rest-frame optical wavelengths. The optical surface brightnesses for their sample are more than an order magnitude greater than for local star-forming galaxies, consistent with our result.
The molecular gas and star formation relation, the Kennicutt-Schmidt Law (e.g. Schmidt, 1959; Kennicutt, 1998), is shown by Genzel et al. (2010) to have a slope of 1.1 to 1.2 over a large range of stellar mass surface density ( to M⊙pc-2) for both low and high-redshift samples. A remarkable difference between low and high-redshift star-forming galaxies is that the gas depletion time increased from 0.5 Gyr at to 1.5 Gyr locally (Genzel et al., 2010), which is consistent with the picture that star-forming galaxies at low and high-redshift harbor similar star-forming environments but the gas consumption rate, and hence the star formation rate, is significantly higher at high-redshift.
The finding that the physical conditions in high-redshift galaxies’ star-forming regions are similar to those in local quiescent star-forming galaxies indicates that their intense star formation is unlike the transient starbursting phase due to rapid infall of gas as a result of galaxy interaction, as seen in local ULIRGs. Rather they may represent an isolated evolution which could be observable for an extended period of time. This picture is supported by the behavior of massive star-forming galaxies at high-redshift found in the cosmological simulations of Agertz et al. (2009) and Davé et al. (2010). The latter simulated populations with observational properties consistent with SMGs consists of isolated galaxies in the middle of large potential wells with large gas reservoirs. It should also be noted that Davé et al. (2010) report a highly asymmetric distribution of gas density, star formation, and velocity field in the simulated SMGs consistent with the disturbed morphologies observed.
4. CONCLUSION
We made a compilation of physical size measurements for 43 local galaxies with ranging from normal star-forming galaxies at to ULIRGs at , as well as 48 intermediate and high-redshift galaxies, including SMGs.
Our compilation shows that (1) the physical scale of high-redshift ULIRGs and submillimeter galaxies is consistent within an order of magnitude with that of local normal star-forming galaxies (4.4 kpc in median diameter), while local LIRGs and ULIRGs are significantly smaller (0.8 kpc in median diameter); (2) there is a correlation of and extending over five orders of magnitude in for normal star-forming galaxies and high-z galaxies. Local LIRGs and ULIRGs have significantly higher than high-redshift galaxies with similar and diverge from this correlation.
The fact that we do not find a significant deviation from this relationship in high-redshift galaxies with in the ULIRG range indicates that the local ULIRGs as well as LIRGs belong to a rare population likely driven by a unique process. High-resolution studies of local ULIRGs have pointed out their disturbed morphology, double nuclei, and other signs of merger activity. The correlation we have found, however, suggests that the high of SMGs and ULIRGs at large redshifts can be explained, to first order, by the higher within isolated, quiescent galaxies.
We thank Anita Richards and Tom Muxlow for radio data in the HDF and insightful discussions; Scott Chapman for radio images from Chapman et al. (2004); Kalliopi Dasyra for spectra from Dasyra et al. (2009); Karín Menéndez-Delmestre for spectra published in Menéndez-Delmestre et al. (2009). We also thank Benjamin Weiner for his assistance with data compilation and valuable discussions. This work is supported by contract 1255094 from Caltech/JPL to the University of Arizona. WR gratefully acknowledges the support from the Thai Government Scholarship.
Appendix A Estimation of Physical Sizes for Local IR Galaxies
Our local sample of star-forming galaxies was selected to represent a broad range of IR luminosities from normal star-forming galaxy ( ), luminous IR galaxy (LIRG, ), to ultraluminous IR galaxy (ULIRG, ). Here we discuss how we select the local starburst galaxies and the methods we employ to estimate the physical sizes to compare with high-redshift star-forming galaxies in the same metric. For all but three local galaxies, was obtained from the IRAS Revised Bright Galaxy Sample (RBGS; Sanders et al., 2003). The RBGS provides that has a definition similar to that of from the Rieke et al. (2009) formalism used for our intermediate and high redshift compilation. The three exceptions are discussed separately.
A.1. Normal Star-Forming Galaxies
Galaxies from the Spitzer Infrared Nearby Galaxies Survey (e.g., Kennicutt et al., 2003; Calzetti et al., 2007) are used to represent normal star-forming galaxies. SINGS galaxies are selected from within the local volume to allow IR imaging at reasonably good physical resolution. We use the 24 images of these galaxies to map star formation. We only select high-luminosity galaxies. As noted by Calzetti et al. (2007), NGC 4125 and NGC 5195 contain Seyfert 2 nuclei and thus are excluded from our compilation. for the other galaxies was taken from the RBGS except for NGC 1512, NGC 2841, and NGC 4625 that are not in the catalog. For these three galaxies we use 24 fluxes from Dale et al. (2007) to estimate using the appropriate Rieke et al. (2009) SED.
We convolved the SINGS 24 MIPS images with a series of Gaussians that have angular FWHM corresponding to physical sizes ranging over kpc at the galaxy’s distance and then fit 2D Gaussians to estimate a deconvolved size from the convolved images. We found that the recovered FWHM is a slowly varying function of the convolved Gaussian’s FWHM, which assures that sizes estimated from this method are robust. For the actual size measurement for these galaxies we convolve all SINGS 24 imaging with a Gaussian that has FWHM corresponding to 4 kpc at each galaxy’s distance and measure deconvolved sizes from the convolved image. This procedure is illustrated by NGC 3627 in Fig. 1. These sizes are reported in Table 1 for normal star-forming galaxies.
We have 19 galaxies from the SINGS sample with in the range of , a median of , and a median physical diameter of 3.5 kpc.
A.2. LIRGs
Our local LIRGs were drawn from Condon et al. (1991), Alonso-Herrero et al. (2006), and Iono et al. (2009). Their size measurements are based on the 8.4 GHz VLA radio observations, Pa imaging using Hubble Space Telescope (HST), and Submillimeter Array (SMA) submillimeter observations, respectively.
Condon et al. (1991) observed 40 LIRGs selected from the IRAS Bright Galaxy Sample using the VLA with a resolution of . From these 40 LIRGs, 15 are dominated by a compact radio component likely to be an AGN, referred to by Condon et al. (1991) as “monsters” and another 5 are known to harbor AGN according to SIMBAD, which we exclude; 6 are multi-component with one or more components not reported, which we exclude; 2 are multi-component with well constrained sizes for both components (NGC 3690, which is Arp 299 for which we adopt CO size measurement from Iono et al. (2009), and IRAS F15163+4255); one has an observational issue (NGC 1614) but it was also observed by Iono et al. (2009) and therefore we adopt the Iono et al. (2009) size measurement for NGC 1614; there are size measurements for only four galaxies of the remaining 11. These four are UGC 2369, IRAS F03359+1523, UGC 4881, and IRAS F17132+5313. Along with the aforementioned IRAS F15163+4255, a multi-component object with well-measured size, we have five LIRGs from Condon et al. (1991).
The Alonso-Herrero et al. (2006) LIRGs were selected such that their Pa emission line would fall in the narrow band of the F190N filter of the Near Infrared Camera and Multi-Object Spectrometer (NICMOS) on HST. The resolution of NICMOS (pixel) resolved detailed structures of these LIRGs and thus we need to measure their sizes using the same procedure as in § A.1. However, we convolved the images using Gaussians with FWHMs corresponding to only 1 kpc at each LIRG’s distance. This was necessary because of the intrinsically smaller sizes of the LIRGs, which we also tested by measuring the diameter encircling 90% of flux. The results from our measurements are given in the LIRGs section of Table 1.
Iono et al. (2009) report sizes of LIRGs within 200 Mpc using the SMA, based on CO () observations by Wilson et al. (2008). The sample contains LIRGs harboring AGN (including NGC 2623, NGC 6240, UGC 5101, Mrk 231, Mrk 273, IRAS F10565+2448 and IRAS F17207-0014) and multicomponent objects where the sizes of some components cannot be determined (including Arp 55, Arp 299, NGC 5331, and NGC 5257/8) and thus we are left with four starburst-dominated objects with good size estimates. They are Arp 193, VV 114, NGC 1614, and IRAS 10565.
In total we have 21 LIRGs with median of and a median physical diameter of 0.8 kpc. This sample is dominated by the 12 galaxies with Pa images, and these galaxies by themselves should provide an unbiased estimate of sizes of the star forming regions in LIRGs. The estimated sizes of the galaxies measured in the radio and in CO are consistent with those from Pa.
A.3. ULIRGs
Despite the many local ULIRGs, selecting a sample to study the physical sizes of the starburst regions is complicated by two issues. First, a majority of these ULIRGs harbor AGN and thus do not represent a starburst environment. Second, the sizes of the IR-emitting regions are significantly smaller than the optical and near-IR extents of these galaxies and the existing mid-IR data in the literature (e.g. SINGS) do not resolve the ULIRGs’ IR emission. Our compilation therefore relies on radio and submillimeter interferometric observations of four ULIRGs that are known to have their IR luminosity dominated by star-forming emission: VII Zw 31, IRAS F23365+3604, Arp 220, and IRAS F17207-0014. Their IR luminosities according to Sanders et al. (2003) are in the range of .
Arp 220 has two nuclei 370 pc apart; the western nucleus is slightly more luminous than the eastern nucleus (Rovilos et al., 2003). This galaxy was studied with Very Long Baseline Interferometry (VLBI) at 18 cm by Smith et al. (1998) who found the western nucleus to contain most of the individual 18 cm sources (13 sources in the western nucleus vs. three in the eastern nucleus). They report that the sources in the western nucleus are confined within 75 pc pc. Circularizing these values gives a diameter of kpc for the western nucleus alone. The 1.6 and 5 GHz MERLIN radio maps by Rovilos et al. (2003) indicate both nuclei have similar physical sizes. We estimate the physical size of Arp 220 from the 5 GHz map where the two nuclei are clearly separated. Combining the emission regions from both nuclei, we adopt an effective diameter of 0.2 kpc for the starburst region of Arp 220.
The sizes of VII Zw 31 and IRAS F23365+3604 are reported by Downes & Solomon (1998) based on CO () observations; the IRAS F17207-0014 size by Iono et al. (2009) is based on CO () observations. Again, we treat these CO-derived sizes as upper limits for the size of the IR-emitting extent of the galaxy.
| Source | IRAS ID | DistanceaaDistance and from Sanders et al. (2003) and adjust to match our cosmology. | aaDistance and from Sanders et al. (2003) and adjust to match our cosmology. | Diameter | ReferencesbbDiameters references 1. measured from Spitzer MIPS 24 imaging taken by SINGS (Kennicutt et al., 2003; Calzetti et al., 2007, e.g.,), 2. measured from Hubble NICMOS Pa- taken by Alonso-Herrero et al. (2006), 3. 8.4 GHz radio sizes given by Condon et al. (1991), 4. CO () sizes given by Iono et al. (2009), 5. CO () or CO () sizes given by Downes & Solomon (1998), 6. 5 GHz radio size based on Rovilos et al. (2003). |
|---|---|---|---|---|---|
| (Mpc) | (logL⊙) | (kpc) | |||
| Normal SF Galaxies | |||||
| NGC 2976 | F09431+6809 | 3.8 | 8.61 | 1.5 | 1 |
| NGC 4826 | F12542+2157 | 6.0 | 9.14 | 1.2 | 1 |
| NGC 2403 | F07320+6543 | 3.8 | 9.25 | 3.0 | 1 |
| NGC 925 | F02242+3321 | 9.8 | 9.46 | 6.1 | 1 |
| NGC 1512 | … | 11.3 | 9.49 | 3.2 | 1 |
| NGC 5866 | F15051+5557 | 13.0 | 9.51 | 1.8 | 1 |
| NGC 2841 | … | 10.5 | 9.52 | 4.9 | 1 |
| NGC 4559 | F12334+2814 | 11.9 | 9.62 | 5.0 | 1 |
| NGC 4736 | 12485+4123 | 5.7 | 9.79 | 1.7 | 1 |
| NGC 3198 | F10168+4547 | 14.7 | 9.81 | 3.8 | 1 |
| NGC 3184 | 10152+4140 | 11.9 | 9.86 | 6.5 | 1 |
| NGC 3351 | F10413+1157 | 10.8 | 9.89 | 2.2 | 1 |
| NGC 3938 | F11502+4423 | 13.1 | 9.99 | 4.7 | 1 |
| NGC 4569 | F12343+1326 | 17.8 | 10.08 | 3.1 | 1 |
| NGC 5055 | F13135+4217 | 8.4 | 10.15 | 4.3 | 1 |
| NGC 5033 | F13111+3651 | 14.7 | 10.19 | 1.1 | 1 |
| NGC 3627 | F11176+1315 | 9.3 | 10.44 | 3.5 | 1 |
| NGC 5194 | F13277+4727 | 8.8 | 10.48 | 5.7 | 1 |
| NGC 7331 | F22347+3409 | 16.2 | 10.64 | 4.7 | 1 |
| LIRGs | |||||
| NGC 23 | F00073+2538 | 63.9 | 11.11 | 1.2 | 2 |
| NGC 6701 | F18425+6036 | 60.6 | 11.11 | 0.7 | 2 |
| UGC 1845 | F02208+4744 | 66.4 | 11.13 | 0.81 | 2 |
| NGC 5936 | F15276+1309 | 65.1 | 11.13 | 0.56 | 2 |
| MCG +02-20-003 | F07329+1149 | 72.4 | 11.14 | 0.78 | 2 |
| NGC 2369 | F07160-6215 | 47.1 | 11.16 | 0.82 | 2 |
| ESO 320-G030 | F11506-3851 | 40.4 | 11.16 | 0.91 | 2 |
| IC 5179 | F22132-3705 | 50.0 | 11.22 | 1.6 | 2 |
| NGC 2388 | F07256+3355 | 61.9 | 11.29 | 0.84 | 2 |
| NGC 7771 | F23488+1949 | 61.2 | 11.40 | 1.04 | 2 |
| MCG +12-02-001 | F00506+7248 | 68.9 | 11.50 | 0.8 | 2 |
| … | F03359+1523 | 146.9 | 11.53 | 0.07 | 3 |
| NGC 1614 | F04315-0840 | 67.1 | 11.66 | 0.9 | 4 |
| UGC 2369 | F02512+1446 | 130.7 | 11.66 | 0.08 | 3 |
| Arp 236 | F01053-1746 | 84.2 | 11.71 | 2.6 | 4 |
| Arp 193 | F13182+3424 | 107.1 | 11.73 | 0.8 | 4 |
| UGC 4881 | F09126+4432 | 172.7 | 11.75 | 0.14 | 3 |
| Arp 299 | F11257+5850 | 51.2 | 11.94 | 0.42 | 4 |
| … | F17132+5313 | 218.9 | 11.95 | 0.14 | 3 |
| … | F15163+4255 | 180.8 | 11.95 | 0.22 | 3 |
| … | F10565+2448 | 188.9 | 11.99 | 0.8 | 4 |
| ULIRGs | |||||
| VII Zw 31 | F05081+7936 | 230.2 | 12.00 | 2.1 | 5 |
| … | F23365+3604 | 269.8 | 12.19 | 1.1 | 5 |
| Arp 220 | F15327+2340 | 85.6 | 12.27 | 0.2 | 6 |
| … | F17207-0014 | 188.2 | 12.45 | 4 | |
| R.A. | Decl. | Source | z | S | S | Diameter | Referencesaa1. Chapman et al. (2004), 2. Chapman et al. (2005), 3. Tacconi et al. (2006), 4. Tacconi et al. (2010), 5. Hainline et al. (2009), 6. Menéndez-Delmestre et al. (2009), 7. Casey et al. (2009), 8. Biggs & Ivison (2008), 9. Daddi et al. (2010), 10. GOODS Spitzer Legacy Data, Dickinson et al., in prep., 11. Ivison et al. (2007), 12. Muxlow et al. (2005), 13. Weiner, private comm., 14. Morrison et al. (2010) |
|---|---|---|---|---|---|---|---|
| (J2000) | (J2000) | (Jy) | (Jy) | (kpc) | |||
| 10 51 46.61 | 57 20 33.4 | RGJ105146.61+572033.4 | 2.383 | 4.2 | 7 | ||
| 10 51 51.69 | 57 26 36.1 | SMMJ105151.69+572636.1 | 1.147 | 6.1 | 8, 11 | ||
| 10 51 54.19 | 57 24 14.6 | RGJ105154.19+572414.6 | 0.922 | 4.0 | 7 | ||
| 10 51 55.47 | 57 23 12.8 | SMMJ105155.47+572312.8 | 2.686 | 2.2 | 8, 11 | ||
| 10 51 58.02 | 57 18 00.3 | SMMJ105158.02+571800.3 | 2.239 | 6.7 | 8, 11 | ||
| 10 51 59.90 | 57 18 02.4 | RGJ105159.90+571802.4 | 1.047 | 5.4 | 7 | ||
| 10 52 01.25 | 57 24 45.8 | SMMJ105201.25+572445.8 | 2.148 | 3.3 | 8, 11 | ||
| 12 35 49.44 | 62 15 36.8 | SMM123549.44+621536.8 | 2.203 | 630 | 2.5 | 2, 3, 6 | |
| 12 36 07.13 | 62 13 28.6 | J123607+621328 | 0.435 | 5.3 | 10, 12, 14 | ||
| 12 36 15.60 | 62 09 46.4 | J123615+620946 | 1.263 | 5.2 | 10, 12, 14 | ||
| 12 36 16.15 | 62 15 13.7 | SMMJ123616.15+621513.7 | 2.578 | 8.0 | 2, 10, 12, 14 | ||
| 12 36 17.07 | 62 10 11.2 | J123617+621011 | 0.845 | 3.6 | 10, 12, 14 | ||
| 12 36 18.32 | 62 15 50.5 | J123618+621550 | 1.870 | 2.6 | 10, 12, 14 | ||
| 12 36 19.46 | 62 12 52.6 | J123619+621252 | 0.473 | 1.8 | 10, 12, 14 | ||
| 12 36 22.65 | 62 16 29.7 | SMMJ123622.65+621629.7 | 2.466 | 9.7 | 2, 10, 12, 14 | ||
| 12 36 26.52 | 62 08 35.4 | BzK-4171 | 1.465 | 142 | 34 | 11.3 | 9, 13 |
| 12 36 29.13 | 62 10 45.8 | SMMJ123629.13+621045.8 | 1.013 | 6.6 | 1, 2, 10 | ||
| 12 36 30.02 | 62 09 23.7 | J123630+620923 | 0.953 | 3.7 | 10, 12, 14 | ||
| 12 36 30.12 | 62 14 28.0 | BzK-16000 | 1.522 | 183 | 19 | 10.9 | 9, 13 |
| 12 36 33.67 | 62 10 05.8 | J123633+621005 | 1.016 | 7.5 | 10, 12, 14 | ||
| 12 36 34.45 | 62 12 12.9 | J123634+621213 | 0.456 | 5.4 | 10, 12, 14 | ||
| 12 36 34.49 | 62 12 41.0 | J123634+621241 | 1.219 | 6.4 | 10, 12, 14 | ||
| 12 36 35.57 | 62 14 24.0 | J123635+621424 | 2.011 | 1.9 | 10, 12, 14 | ||
| 12 36 41.52 | 62 09 48.2 | J123641+620948 | 0.518 | 2.9 | 10, 12, 14 | ||
| 12 36 45.89 | 62 07 54.1 | RGJ123645.89+620754.1 | 1.433 | 4.2 | 7, 10 | ||
| 12 36 46.64 | 62 08 33.3 | J123646+620833 | 0.971 | 4.9 | 10, 12, 14 | ||
| 12 36 49.68 | 62 13 12.9 | J123649+621313 | 0.475 | 4.6 | 10, 12, 14 | ||
| 12 36 50.01 | 62 08 01.6 | J123650+620801 | 0.559 | 3.5 | 10, 12, 14 | ||
| 12 36 51.11 | 62 10 30.8 | J123651+621030 | 0.410 | 5.1 | 10, 12, 14 | ||
| 12 36 53.37 | 62 11 39.6 | RGJ123653.37+621139.6 | 1.275 | 5.8 | 7, 10 | ||
| 12 36 55.73 | 62 09 17.4 | J123655+620917 | 0.419 | 2.6 | 10, 12, 14 | ||
| 12 36 55.93 | 62 08 08.2 | J123655+620808 | 0.792 | 4.1 | 10, 12, 14 | ||
| 12 36 59.92 | 62 14 50.1 | J123659+621449 | 0.761 | 5.7 | 10, 12, 14 | ||
| 12 37 04.08 | 62 07 55.3 | J123704+620755 | 1.253 | 6.5 | 10, 12, 14 | ||
| 12 37 05.88 | 62 11 53.7 | J123705+621153 | 0.902 | 9.1 | 10, 12, 14 | ||
| 12 37 07.21 | 62 14 08.1 | SMMJ123707.21+621408.1 | 2.484 | 7.3 | 2, 3, 10 | ||
| 12 37 08.32 | 62 10 56.0 | J123708+621056 | 0.422 | 3.0 | 10, 12, 14 | ||
| 12 37 10.60 | 62 22 34.6 | RGJ123710.60+622234.6 | 1.522 | 3.4 | 7 | ||
| 12 37 11.98 | 62 13 25.7 | SMMJ123711.98+621325.7 | 1.992 | 6.9 | 1, 2, 10 | ||
| 12 37 13.58 | 62 16 03.7 | J123713+621603 | 0.938 | 5.5 | 10, 12, 14 | ||
| 12 37 14.34 | 62 15 58.8 | J123714+621558 | 0.567 | 51 | 7.6 | 10, 12 | |
| 12 37 16.58 | 62 16 43.2 | J123716+621643 | 0.557 | 4.5 | 10, 12, 14 | ||
| 12 37 16.81 | 62 10 07.3 | J123716+621007 | 0.411 | 3.0 | 10, 12, 14 | ||
| 12 37 21.45 | 62 13 46.1 | J123721+621346 | 1.019 | 4.4 | 10, 12, 14 | ||
| 12 37 51.82 | 62 15 20.2 | BzK-17999 | 1.414 | 230 | 34 | 6.4 | 9, 13 |
| 14 18 03.55 | 52 30 22.3 | EGS 12007881 | 1.161 | 327.6 | … | 16 | 4, 13 |
| 14 20 05.43 | 53 01 15.5 | EGS 13035123 | 1.115 | 571.3 | … | 13 | 4, 13 |
| 16 36 58.19 | 41 05 23.8 | SMMJ163658.19+410523.8 | 2.454 | 3.2 | 2, 3, 5 |
References
- Agertz et al. (2009) Agertz, O., Teyssier, R., & Moore, B. 2009, MNRAS, 397, L64
- Alonso-Herrero et al. (2006) Alonso-Herrero, A., Rieke, G. H., Rieke, M. J., Colina, L., Pérez-González, P. G., & Ryder, S. D. 2006, ApJ, 650, 835
- Biggs & Ivison (2008) Biggs, A. D., & Ivison, R. J. 2008, MNRAS, 385, 893
- Bothwell et al. (2010) Bothwell, M. S., et al. 2010, MNRAS, 525
- Blain et al. (2002) Blain, A. W., Smail, I., Ivison, R. J., Kneib, J.-P., & Frayer, D. T. 2002, Phys. Rep., 369, 111
- Brandl et al. (2006) Brandl, B. R., et al. 2006, ApJ, 653, 1129
- Calzetti et al. (2007) Calzetti, D., et al. 2007, ApJ, 666, 870
- Calzetti et al. (2010) Calzetti, D., et al. 2010, ApJ, 714, 1256
- Casey et al. (2009) Casey, C. M., et al. 2009, MNRAS, 399, 121
- Carilli et al. (2010) Carilli, C. L., et al. 2010, ApJ, 714, 1407
- Chapman et al. (2004) Chapman, S. C., Smail, I., Windhorst, R., Muxlow, T., & Ivison, R. J. 2004, ApJ, 611, 732
- Chapman et al. (2005) Chapman, S. C., Blain, A. W., Smail, I., & Ivison, R. J. 2005, ApJ, 622, 772
- Condon et al. (1991) Condon, J. J., Huang, Z.-P., Yin, Q. F., & Thuan, T. X. 1991, ApJ, 378, 65
- Condon et al. (1998) Condon, J. J., Cotton, W. D., Greisen, E. W., Yin, Q. F., Perley, R. A., Taylor, G. B., & Broderick, J. J. 1998, AJ, 115, 1693
- Coppin et al. (2006) Coppin, K., et al. 2006, MNRAS, 372, 1621
- Daddi et al. (2010) Daddi, E., et al. 2010, ApJ, 713, 686
- Dale et al. (2006) Dale, D. A., et al. 2006, ApJ, 646, 161
- Dale et al. (2007) Dale, D. A., et al. 2007, ApJ, 655, 863
- Dasyra et al. (2009) Dasyra, K. M., et al. 2009, ApJ, 701, 1123
- Davé et al. (2010) Davé, R., Finlator, K., Oppenheimer, B. D., Fardal, M., Katz, N., Kereš, D., & Weinberg, D. H. 2010, MNRAS, 404, 1355
- Downes & Solomon (1998) Downes, D., & Solomon, P. M. 1998, ApJ, 507, 615
- Engelbracht et al. (2008) Engelbracht, C. W., Rieke, G. H., Gordon, K. D., Smith, J.-D. T., Werner, M. W., Moustakas, J., Willmer, C. N. A., & Vanzi, L. 2008, ApJ, 678, 804
- Erb et al. (2006) Erb, D. K., Shapley, A. E., Pettini, M., Steidel, C. C., Reddy, N. A., & Adelberger, K. L. 2006, ApJ, 644, 813
- Farrah et al. (2008) Farrah, D., et al. 2008, ApJ, 677, 957
- Gao & Solomon (2004) Gao, Y., & Solomon, P. M. 2004, ApJ, 606, 271
- Giavalisco et al. (2004) Giavalisco, M., et al. 2004, ApJ, 600, L93
- Genzel et al. (2010) Genzel, R., et al. 2010, arXiv:1003.5180
- Greve et al. (2003) Greve, T. R., Ivison, R. J., & Papadopoulos, P. P. 2003, ApJ, 599, 839
- Greve et al. (2004) Greve, T. R., Ivison, R. J., Bertoldi, F., Stevens, J. A., Dunlop, J. S., Lutz, D., & Carilli, C. L. 2004, MNRAS, 354, 779
- Hailey-Dunsheath et al. (2010) Hailey-Dunsheath, S., Nikola, T., Stacey, G. J., Oberst, T. E., Parshley, S. C., Benford, D. J., Staguhn, J. G., & Tucker, C. E. 2010, ApJ, 714, L162
- Hainline et al. (2009) Hainline, L. J., Blain, A. W., Smail, I., Frayer, D. T., Chapman, S. C., Ivison, R. J., & Alexander, D. M. 2009, ApJ, 699, 1610
- Iono et al. (2009) Iono, D., et al. 2009, ApJ, 695, 1537
- Ivison et al. (2007) Ivison, R. J., et al. 2007, MNRAS, 380, 199
- Ivison et al. (2010a) Ivison, R. J., et al. 2010a, MNRAS, 402, 245
- Ivison et al. (2010b) Ivison, R. J., et al. 2010b, arXiv:1005.1072
- Ivison et al. (2010c) Ivison, R. J., et al. 2010c, arXiv:1005.1071
- Juneau et al. (2009) Juneau, S., Narayanan, D. T., Moustakas, J., Shirley, Y. L., Bussmann, R. S., Kennicutt, R. C., & Vanden Bout, P. A. 2009, ApJ, 707, 1217
- Kennicutt (1998) Kennicutt, R. C., Jr. 1998, ApJ, 498, 541
- Kennicutt et al. (2003) Kennicutt, R. C., Jr., et al. 2003, PASP, 115, 928
- Lagache et al. (2005) Lagache, G., Puget, J.-L., & Dole, H. 2005, ARA&A, 43, 727
- Le Floc’h et al. (2005) Le Floc’h, E., et al. 2005, ApJ, 632, 169
- Lehnert et al. (2009) Lehnert, M. D., Nesvadba, N. P. H., Tiran, L. L., Matteo, P. D., van Driel, W., Douglas, L. S., Chemin, L., & Bournaud, F. 2009, ApJ, 699, 1660
- Menéndez-Delmestre et al. (2009) Menéndez-Delmestre, K., et al. 2009, ApJ, 699, 667
- Momjian et al. (2006) Momjian, E., Romney, J. D., Carilli, C. L., & Troland, T. H. 2006, ApJ, 653, 1172
- Morrison et al. (2010) Morrison, G. E., Owen, F. N., Dickinson, M., Ivison, R. J., & Ibar, E. 2010, ApJS, 188, 178
- Murphy et al. (2006) Murphy, E. J., et al. 2006, ApJ, 638, 157
- Muxlow et al. (2005) Muxlow, T. W. B., et al. 2005, MNRAS, 358, 1159
- Muzzin et al. (2010) Muzzin, A., van Dokkum, P., Kriek, M., Labbe, I., Cury, I., Marchesini, D., & Franx, M. 2010, arXiv:1003.3479
- Neri et al. (2003) Neri, R., et al. 2003, ApJ, 597, L113
- Papovich et al. (2007) Papovich, C., et al. 2007, ApJ, 668, 45
- Pérez-González et al. (2005) Pérez-González, P. G., et al. 2005, ApJ, 630, 82
- Pope et al. (2006) Pope, A., et al. 2006, MNRAS, 370, 1185
- Reddy et al. (2010) Reddy, N. A., Erb, D. K., Pettini, M., Steidel, C. C., & Shapley, A. E. 2010, ApJ, 712, 1070
- Rieke et al. (2009) Rieke, G. H., Alonso-Herrero, A., Weiner, B. J., Pérez-González, P. G., Blaylock, M., Donley, J. L., & Marcillac, D. 2009, ApJ, 692, 556
- Rigby et al. (2008) Rigby, J. R., et al. 2008, ApJ, 675, 262
- Rodighiero et al. (2010) Rodighiero, G., et al. 2010, A&A, 515, A8
- Rovilos et al. (2003) Rovilos, E., Diamond, P. J., Lonsdale, C. J., Lonsdale, C. J., & Smith, H. E. 2003, MNRAS, 342, 373
- Sanders et al. (2003) Sanders, D. B., Mazzarella, J. M., Kim, D.-C., Surace, J. A., & Soifer, B. T. 2003, AJ, 126, 1607
- Sargent et al. (2010) Sargent, M. T., et al. 2010, ApJ, 714, L190
- Schmidt (1959) Schmidt, M. 1959, ApJ, 129, 243
- Scott et al. (2002) Scott, S. E., et al. 2002, MNRAS, 331, 817
- Smith et al. (1998) Smith, H. E., Lonsdale, C. J., Lonsdale, C. J., & Diamond, P. J. 1998, ApJ, 493, L17
- Swinbank et al. (2010a) Swinbank, M., et al. 2010a, arXiv:1002.2518
- Swinbank et al. (2010b) Swinbank, A. M., et al. 2010b, Nature, 464, 733
- Symeonidis et al. (2009) Symeonidis, M., Page, M. J., Seymour, N., Dwelly, T., Coppin, K., McHardy, I., Rieke, G. H., & Huynh, M. 2009, MNRAS, 397, 1728
- Tacconi et al. (2006) Tacconi, L. J., et al. 2006, ApJ, 640, 228
- Tacconi et al. (2008) Tacconi, L. J., et al. 2008, ApJ, 680, 246
- Tacconi et al. (2010) Tacconi, L. J., et al. 2010, Nature, 463, 781
- Takagi et al. (2010) Takagi, T., et al. 2010, A&A, 514, A5
- Thrall et al. (2007) Thrall, H., Muxlow, T. W. B., Beswick, R. J., & Richards, A. M. S. 2007, Deepest Astronomical Surveys, 380, 291
- Wilson et al. (2008) Wilson, C. D., et al. 2008, ApJS, 178, 189
- Younger et al. (2010) Younger, J. D., et al. 2010, MNRAS, 984