Structure and Response in the World Trade Network
Abstract
We examine how the structure of the world trade network has been shaped by globalization and recessions over the last 40 years. We show that by treating the world trade network as an evolving system, theory predicts the trade network is more sensitive to evolutionary shocks and recovers more slowly from them now than it did 40 years ago, due to structural changes in the world trade network induced by globalization. We also show that recession-induced change to the world trade network leads to an increased hierarchical structure of the global trade network for a few years after the recession.
pacs:
89.65.Gh,89.75.Hc,89.75.-kPhysical theory of evolution predicts that under certain conditions, a changing environment leads to development of modular structure Sun and Deem (2007); He et al. (2009); Kashtan and Alon (2005). The prediction depends only on 1) the dynamics of the response to change being “slow” due to a glassy landscape, 2) presence of change, and 3) exchange of information between evolving agents. Since the trade network is an evolving system, this physics of evolution may be applied to the world trade system, previously studied by network analysis Hidalgo et al. (2007); Barigozzi et al. (2010). We assume that condition 1 is satisfied for the world trade network due to the complexities of inter-country relationships. Condition 2 is satisfied by viewing recessions as causing a change of the environment for the dynamics of the world trade system. Condition 3 is satisfied because information flow naturally results from transfer of business practices or material between countries. Thus, the theory of Sun and Deem (2007); He et al. (2009) allows us to make three predictions: decreased modular structure in the world trade network increases the sensitivity to recessionary shocks, decreased modular structure decreases the rate of recovery, and recessions themselves spontaneously increase modular structure of the world trade network. All three predictions will be borne out by data. These results are general predictions about how the detailed structural parameters of the evolving economic system will organize. Our theory shows that the modular and hierarchical structure formed in response to environmental fluctuation increases the resistance to and rate of recovery from perturbations. The theory predicts that globalization, which reduces hierarchical structure, should lead to increasingly large recessions and decreased rate of recovery, in contrast to standard economic understanding Alesina et al. (2005).
To apply the physical theory of evolution that describes the spontaneous emergence of modularity in fluctuating environments Sun and Deem (2007); He et al. (2009) to world trade, we seek a mathematical representation of hierarchy in the world trade network. Identification of network motifs or modules is an active research field in the physics of networks Sun and Deem (2007); Newman (2006); Alon (2007), with the study of structure at multiple scales, i.e. hierarchy, somewhat more recent Ravasz et al. (2002); Clauset et al. (2008). In this paper, we treat the world trade data as defining a geometry in trade space. We project the trade topology onto the best tree-like topology representing the data. The success of this projection in representing the original geometry is used to define the hierarchy of the original data.
We apply hierarchical clustering to construct the best tree-like representation of the world trade network. Correlation between the distances implied by the tree construction and the distances defined by the original trade data is calculated. This quantity is termed the cophenetic correlation coefficient (CCC) Everitt et al. (2001). We will display the general trend of the CCC since 1969, noting especially the increase of the CCC after each recession. The magnitude of the CCC will be shown to correlate with the ability of total world GDP to resist a recessionary shock. Theory shows that this result is, in fact, causal, not simply a correlation, which is a major result here.
We focus on how global recessions, such as the 2008–2009 recession, have affected the structure of the world trade network. Modular structures arises in the trade network, for example, because countries in a trade group trade among themselves to a greater extent than with others. These trade groups may interact with each other to form higher level groupings. The detailed reasons for an increase of hierarchy in the world trade network are many: perhaps protectionism for the domestic economy Anderson (2009), or because long-distance trade seems costly during a recession. Standard arguments in economic theory suggest a decreased rate of recovery from recession for trade networks with more modular structure Alesina et al. (2005). We will see, however, that our theory predicts that greater trade network structure increases both the resistance to recessionary shocks and the rate of recovery from recessions.
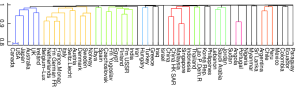
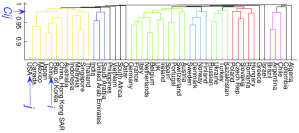
A hierarchical trade network occurs when countries with strong trade connections group into trade modules or regional trade clusters. A flat or non-hierarchical structure occurs when countries trade evenly with all other countries, and there are no regional trade modules in the trade network. We use the historical trade data from United Nation database (Comtrade) from 1962 to 2007. We build the world trade network with nodes representing countries and links representing the trade value. We do not scale the trade volume by the GDP, because small economic units should not have the same weight as large economic units. First, a distance matrix is calculated from the trade network matrix by , where . Here, is trade value between two countries. The average linkage hierarchical clustering algorithm is applied to the distance matrix to produce the tree-like dendrogram Everitt et al. (2001), see Fig. 1. We define the tree-like structure to have the most hierarchy. Therefore, the amount of hierarchy can be measured by the likeness between the original data and the best tree that is produced from original data by hierarchical clustering. The CCC quantifies this likeness. The cophenetic matrix is generated from the dendrogram. Its elements are the branch distance where two objects become members of the same cluster in the dendrogram: for two nodes, , we find the nearest common bifurcation point, and the branch length for this point is the cophenetic element of these two nodes, , see Fig. 1 for an example. The CCC is defined as , where and are the element and average of elements of the distance matrix, and and are the elements and average of elements of cophenetic matrix, respectively. Hierarchical datasets have a high CCC value, and nonhierarchical datasets have a low CCC value Kaesler and Cairns (1972).
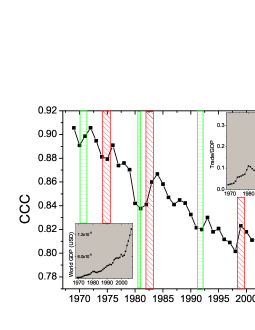
A major factor affecting the world trade network over the last 40 years has been the process of globalization. Qualitatively, this globalization has been expressed as a “flattening” of the world Friedman (2005). Here, we use the CCC to measure how the hierarchical structure of the world trade network has changed over time. Large CCC values indicate higher hierarchy. The major trend of CCC with time in Fig. 2 is a reduction of hierarchy as the “flattening” has taken place Friedman (2005). We notice, however, that the CCC does not always decrease year by year. We notice that during and after each recession, marked on the figure, the CCC value increases. The CCC values at the year after recession are larger than that at the year before the recession (-value of Kolmogorov-Smirnov test for null hypothesis that they are from the same distribution with the same mean, and -value for null hypothesis that CCC value before recession is larger than that after recession). This trend is true both for the past 3 major recessions and for the past 4 minor recessions. The scale of increase of hierarchical structure depends on the severity of recession. One possible reason for this CCC trend during recessions is the increase of trade protectionism during recessions. Also, regional integrations are greatly enhanced during recessions, leading to increased regional imports Elliott and Ikemoto (2004), which strengthens trade modules. Free trade promotes globalization and decreases the hierarchy of the trade networks. But trade protectionism and regional integration, which is common during recessions to protect domestic or regional economies by restraining trade between countries, tends to reduce trade between countries in different trade modules. Thus, recessions may promote the regionalization that enhances the modularity of the trade network. One example is the Asian currency crisis of 1997, which lead to the development of independent Asian monetary systems.
The CCC is a characterization of the world trade network that is independent from the total amount of world trade. In the process of globalization, a country tends not only to increase its total trade value, but also to trade with more partners. The upper right insert of Fig. 2 shows the typically increasing ratio of world trade to GDP. Only the recessions of 1981, 1991, 1997 and 2001 lead to a decrease in the trade to GDP ratio, whereas the CCC increased in all seven recessions. The increased hierarchical structure appearing after all seven recessions in Fig. 2, is therefore, a sensitive correlate of recessions, and independent of the trade to GDP ratio shown in the upper right insert of Fig. 2 and total trade volume shown in the lower left insert of Fig. 2. Measurement of globalization by both hierarchical structure (CCC) and total trade provides complementary information.
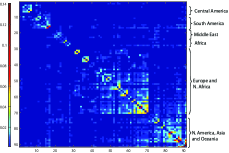
The CCC quantifies the development of hierarchical structure in the trade network at multiple scales in an integrated way. The clustering of the world trade network shows the modularity of global trade, see Fig. 3. The development of regional trading partners occurs simultaneously with globalization. By comparing the structure of trade network in 1969 and in 2007, we found that the increased trade among Canada, United States, and Mexico as a result of NAFTA is one example of a regional trading group. Regional trade pacts among the Middle East countries are other examples of regionalization. In general, free trade markets will develop modular structure at multiple geographical scales.
The ability of the trade system to respond to recessionary perturbations is proportional to the hierarchical structure present, i.e. increases with the CCC value, according to the evolutionary theory of modular structure development Sun and Deem (2007); He et al. (2009). That is, the modular structure that exists at multiple scales affects how recessions propagate in the trade network, just as modular structure of person-to-person contacts affects how diseases spread in a population. We examine how the network structure affects the propagation of a recession throughout the world. For example, if there is a one percentage decrease of the GDP of the USA, by how much does the total GDP of world excluding the USA decrease due to the spread of recession from the USA? We investigate the five most recent global recessions including the 2007-2009 crisis. We calculate the ratio of GDP change (percentage) of world excluding the USA to the GDP change (percentage) of USA in each recession as a function of the CCC value in each recession, see Fig. 4(a). We observe that in more recent recessions with less hierarchical structure of trade network, a recession in the USA has a stronger impact on the rest of the world. This result indicates a strong positive correlation between lack of hierarchical structure and severity of recession impact.

(a) (b)
We also perform an impulse response analysis of the vector autoregression (VAR) model to analyze the time evolution of recession Carvalho (2007); Koop et al. (1996); Abeysinghe and Forbes (2002). We explore the possible underlining causal links between lack of hierarchical structure and severity of recession. A recession is assumed to start in the USA. The US GDP is initially reduced by the maximal GDP decline during the recession, e.g. the maximal quarterly US GDP decline was 5.4% S in the 2008–2009 recession eco (May 2nd, 2009). The export from country to country , , is updated by a factor of ratio of GDP of country at time , , and , ) Abeysinghe and Forbes (2002). Thus, . Then the GDP of country is updated by . Where is the ratio of export to GDP for country . The GDP of each country decreases until steady state is reached, at which point the simulation is terminated. We calculate the world GDP change as . We observe how the crisis spreads globally and measured the GDP loss during crisis.
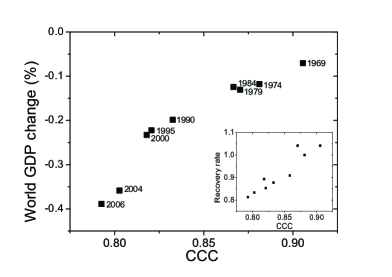
The impulse response analysis results support that the severity of the 2008-2009 recession may be due to loss of hierarchical structure in the global trade network. Lack of hierarchical structure makes the world trade network less resistant to recession, as observed from Fig. 4(b). We believe this increased sensitivity is due to a loss of modular or hierarchical structure in the world trade network, see Fig. 2. As an example, the impact of a recession on the GDP is more severe in 2006 than in 1968, by a factor of 5.7. Interestingly, after this calculation was carried out, an estimate of the ratio of the reduction of GDP in 2009 to the average reduction over past recessions equaling 6 was reported eco (May 2nd, 2009).
Evolutionary theory has shown that systems under environmental perturbation not only increase their modularity, but also increase their response function to perturbations Sun and Deem (2007); He et al. (2009). In the present context, this would imply that as trade has been globalized, and the CCC reduced, the rate of recovery from recession should decrease. We consider this phenomenon in the world trade network, using the VAR model. After the system reaches steady state following the reduction to the USA GDP, we impose a positive impulse to restore the USA GDP to its initial value. The world GDP recovers, at a rate that depends on the hierarchical structure of the trade network. We observe that when the trade network has greater hierarchical structure, indicated by a larger CCC value, the trade network recovers more quickly from recession, as shown in the insert figure of Fig. 4(b).
We have used the concept of viewing the world trade network as defining a geometry in trade space and the idea of projecting this geometry to the best tree-like topology to define the hierarchy in the world trade network. With that necessary mathematical prolegomena, we introduced the world trade network as an evolving system. Physics of evolution in changing environments was then used to predict that the world trade network is more sensitive and recovers more slowly from evolutionary shocks now than it did 40 years ago, because globalization has reduced hierarchical structure in the world trade network. We also predict that recession-induced change to the world trade network should lead to a temporarily increased hierarchical structure of the global trade network. These predictions, contrary to standard economic thinking, were born out by our study of the world trade data since 1969.
References
- Sun and Deem (2007) J. Sun and M. W. Deem, Phys. Rev. Lett. 99, 228107 (2007).
- He et al. (2009) J. He, J. Sun, and M. W. Deem, Phys. Rev. E 79, 031907 (2009).
- Kashtan and Alon (2005) N. Kashtan and U. Alon, Proc. Natl. Acad. Sci. USA 102, 13773 (2005).
- Hidalgo et al. (2007) C. Hidalgo, B. Klinger, A. Barabasi, and R. Hausmann, Science 317, 482 (2007).
- Barigozzi et al. (2010) M. Barigozzi, G. Fagiolo, and D. Garlaschelli, Phys. Rev. E 81, 046104 (2010).
- Alesina et al. (2005) A. Alesina, E. Spolaore, and R. Wacziarg, in Handbook of Economic Growth, edited by P. Aghion and S. N. Durlauf (North Holland, Amsterdam, 2005), chap. 23, pp. 1499–1542.
- Newman (2006) M. E. J. Newman, Phys. Rev. E 74, 036104 (2006).
- Alon (2007) U. Alon, Nat. Rev. Genet. 8, 450 (2007).
- Ravasz et al. (2002) E. Ravasz, A. L. Somera, D. A. Mongru, Z. N. Oltvai, and A. L. Barabási, Science 297, 1551 (2002).
- Clauset et al. (2008) A. Clauset, C. Moore, and M. E. J. Newman, Nature 453, 98 (2008).
- Everitt et al. (2001) B. S. Everitt, S. Landau, and M. Leese, Cluster Analysis (Oxford Univ. Press, 2001).
- Anderson (2009) J. Anderson, Measurement of protection (2009), Prepared for the Palgrave Handbook of International Trade.
- Kaesler and Cairns (1972) R. Kaesler and J. Cairns, American Midland Naturalist 88, 56 (1972).
- Friedman (2005) T. Friedman, The world is flat: A brief history of the twenty-first century (Farra, Straus and Giroux, New York, 2005).
- Elliott and Ikemoto (2004) R. J. R. Elliott and K. Ikemoto, Asian Economic Journal 18, 1 (2004).
- Carvalho (2007) V. Carvalho, Economics Working Papers 1206, Universitat Pompeu Fabra (2007).
- Koop et al. (1996) G. Koop, M. Pesaran, and S. Potter, Journal of Econometrics 74, 119 (1996).
- Abeysinghe and Forbes (2002) T. Abeysinghe and K. Forbes, Review of International Economics 13, 356 (2002).
- eco (May 2nd, 2009) Trade, exchange rates, budget balances and interest rates (May 2nd, 2009), The Economist.