Thermal evolution and structure models of the transiting super-Earth GJ 1214b
Abstract
The planet GJ 1214b is the second known super-Earth with a measured mass and radius. Orbiting a quiet M-star, it receives considerably less mass-loss driving X-ray and UV radiation than CoRoT-7b, so that the interior may be quite dissimilar in composition, including the possibility of a large fraction of water. We model the interior of GJ 1214b assuming a two-layer (envelope+rock core) structure where the envelope material is either H/He, pure water, or a mixture of H/He and H2O. Within this framework we perform models of the thermal evolution and contraction of the planet. We discuss possible compositions that are consistent with , , an age Gyr, and the irradiation level of the atmosphere. These conditions require that if water exists in the interior, it must remain in a fluid state, with important consequences for magnetic field generation. These conditions also require the atmosphere to have a deep isothermal region extending down to 80800 bar, depending on composition. Our results bolster the suggestion of a metal-enriched H/He atmosphere for the planet, as we find water-world models that lack an H/He atmosphere to require an implausibly large water-to-rock ratio of more than 6:1. We instead favor a H/He/H2O envelope with high water mass fraction ( 0.50.85), similar to recent models of the deep envelope of Uranus and Neptune. Even with these high water mass fractions in the H/He envelope, generally the bulk composition of the planet can have subsolar water:rock ratios. Dry, water-enriched, and pure water envelope models differ to an observationally significant level in their tidal Love numbers of respectively , , and .
Subject headings:
planets and satellites: general — planets and satellites: individual(GJ 1214b)1. Introduction
Among the nearly 500 detected planet candidates, and in particular among the planets for which both the mass and radius have been determined, our Earth is the only planet that is known to harbor liquid water oceans on a solid surface crust. These conditions have proven favorable for the development of life forms. With the discovery of CoRoT-7b (; Léger et al. 2009) and GJ 1214b (; Charbonneau et al. 2009), the search for other habitable worlds has just recently passed the milestone of discovering transiting extrasolar planets in the 2-10 super-Earth mass regime.
Higher-mass planets such as Uranus () are predicted by interior models to retain a H/He-rich atmosphere (Hubbard et al., 1995) whose size may vary depending on , and temperature. Pressures at the bottom of this envelope are high, and may reach 1 to 1000 kbar if the planet is of Neptune-size (Nettelmann et al., 2010) or even several Mbar if of Saturn-size (Guillot, 1999) before a presumably solid core is reached. Lower-mass objects on the other hand such as Mars or Ganymede have been observed not to retain a thick enough atmosphere that could prevent the planet’s surface from cooling below the freezing point of water.
CoRoT-7b –orbiting a Sun-like star at short orbital distance AU– falls into the intermediate super-Earth mass regime; the stellar extreme ultraviolet (EUV) flux it receives is so strong that its current atmosphere is either a tiny remnant of an initially massive gaseous envelope, or hot evaporating core material at an equilibrium temperature K (Valencia et al., 2010; Jackson et al., 2010). In contrast, GJ 1214b (AU) orbits an M star of smaller luminosity (Charbonneau et al., 2009) translating into a planet-average K, only a factor of two higher than that of Earth. Hence the discovery of GJ 1214b manifests an important step toward a detection of an extrasolar ocean planet.
Rogers & Seager (2010) investigated the response of interior models to the uncertainties in , , and intrinsic temperature and showed that GJ 1214b might have a thick H/He atmosphere, or else an outgassed H atmosphere, or a water envelope atop a silicate-iron core with an ice:rock (I:R) ratio of 0.06 to .
In this paper we adopt the fiducial values and investigate how the unknown temperatures of the deep interior can be constrained by thermal evolution calculations. Our models are two-layer models with one homogeneous envelope overlying a rock core. We take into account mass loss during evolution and explore how that affects the possible mass of an outer H/He layer (§ 3.1). In § 3.2 we consider pure water atmospheres and ask whether condensation or even solidification of water could then have occured within 10 billion years of cooling. In line with recent transmission spectrum measurements that indicate 70% or more water by mass in the atmosphere (Bean et al., 2010), we vary in § 3.3 the envelope water mass fraction between 50 and 100% and suggest plausible models with about solar I:R ratio. In § 4 we discuss our model assumptions and propose to discriminate between our three classes of models (dry, water, water-rich envelope) by observationally determining the Love number and the mean molecular weight of the atmosphere. Our method of modeling this planet is explained in § 2, where we describe the irradiated atmosphere grid (§ 2.1), applied equations of state (§ 2.2), mass loss (§ 2.3), and the calculation of structure and evolution (§ 2.4).
2. Methods
In this section we describe the four components that our interior models rely on: the model atmosphere grid, the equations of state used, structure assumptions, and the thermal evolution to the present state. The evolutionary models have some similarities to what has previously been applied to hot Neptunes and hot Jupiters (e.g. Fortney et al., 2007; Baraffe et al., 2008), but with additional complications due to radiogenic heating. As the planet’s interior cools, the external radiative zone grows deeper (Guillot et al., 2006), reaching a depth of up to several hundreds of bars. The transition pressure of the atmosphere from radiative to adiabatic, at the current time, , is a quantity we aim to constrain with our evolution model. We also perform explorations of the planet’s structure as a function of , to investigate the full range of hotter, higher entropy interiors (lower ) and cooler, lower entropy interiors (higher ) that may be possible today.
2.1. The model atmosphere
Under the assumption the deep envelope layers convect efficiently, it is the radiative atmosphere atop the convective region that serves as the bottleneck for interior cooling, just as in Neptune, Uranus, and giant planets generally (e.g., Hubbard 1977). Observations of GJ1214b’s atmosphere are consistent with a water-dominated composition as well as with a H/He atmosphere with clouds or hazes (Bean et al., 2010). Given our current ignorance of the composition of the atmosphere, we consider the two likely end-member cases, either a H/He-dominated atmosphere, or a pure steam atmosphere, and find that the opacity is dominated by water vapor in either case (Miller-Ricci & Fortney, 2010). For planetary structure, we assume chemical equilibrium in the atmosphere, thereby ignoring possible alterations of the T-P profile through photoionization.
For planetary evolution, a grid of model atmospheres is generally used as the upper boundary condition, see, for instance, Fortney et al. (2007). These grids relate the specific entropy () of the convective interior, surface gravity () of the planet, and the intrinsic effective temperature () from the interior. We have computed such a grid from K down to 30 K, with the correct limiting behavior down to 0 K (an exhausted interior) across surface gravities from 100 to 1500 cm s-2. The grid is computed at 50 solar metallicity, under the assumption of complete redistribution of absorbed stellar flux (meaning f=1/4, see Fortney et al. 2007; Miller-Ricci & Fortney 2010), and no clouds. Similar models, which describe the technique in more detail, are found in Fortney et al. (2007). The opacity database is described in Freedman et al. (2008). We note that this very high metallicity is realistic given that Neptune and Uranus are 30-60 times solar in carbon (see Guillot & Gautier (2009), for a review).
We use this grid for all evolution calculations of our models, whether they posses thin H/He - atmospheres or pure steam atmospheres. This is certainly a broad brush treatment for a wide range of possible atmospheres, but given our current ignorance regarding the planet’s atmosphere, we feel our treatment is justified. The importance and utility of the coupled model atmosphere/interior cooling calculation is that it allows us to estimate and as a function of time. For instance, in the recent work of Rogers & Seager (2010), the value of was not calculated, but was extrapolated from evolutionary models of Baraffe et al. (2008), for higher mass objects. Generally, we find a 15 K lower , meaning a colder interior, than Rogers & Seager (2010) used. While may change from 175 down to 30 K during evolution, we find that the effective temperature remains nearly constant within 562 to 557 K, which is close to the zero-albedo, planet-average equilibrium temperature of 555 K.
2.2. Equations of state
Metal-rich111The label metals comprises all elements heavier than H and He. planets such as super-Earths are generally suspected to harbour a variety of materials. We aim to represent this variety in a simplified manner by confining silicates and iron into a ’rocky’ core, and H, He, and water to an envelope. For core material we use the relation for rocks by Hubbard & Marley (1989) which describes an adiabatic mixture around K of 38% SiO2, 25% MgO, 25% FeS, and 12%FeO. Such kind of rocks’ mass fraction of Si, Mg, and Fe is, respectively, about 0.5, 0.62, and 1.05 times that of the bulk Earth (McDonough & Sun, 1995). For H/He envelopes we use the interpolated hydrogen and helium EOS developed by Saumon et al. (1995). For water we use H2O-REOS, which was applied to Jupiter (Nettelmann et al., 2008), Uranus and Neptune (Fortney et al., 2010b) and in a slightly modified version to CoRoT-7b (Valencia et al., 2010). This water EOS comprises various water EOS appropriate for different pressure-temperature regimes. It includes the melting curve and phase Ice I (Feistel & Wager, 2006), the saturation curve and liquid water (Wagner & Pruß, 2002), vapor and supercritical molecular water (SESAME 7150, Lyon & Johnson, 1992), and for K and g cm-3 supercritical molecular water, ionic water, superionic water, plasma, ice XII, and ice X based on FT-DFT-MD simulations (French et al., 2009). At pressures below 0.1 GPa, and/or temperatures below 1000 K, H2O-REOS relies on Sesame EOS 7150 (Lyon & Johnson, 1992). For mixtures of hydrogen, helium, and water we use H-REOS for hydrogen (Nettelmann et al., 2008), H2O-REOS for water, and an improved version (Kerley, 2004) of the helium Sesame EOS 5761 (Lyon & Johnson, 1992). Other materials are not considered here 222 We do not consider the lighter and more volatile ices CH4 and NH3. We performed simple tests by perturbing warm H2O-REOS adiabats with the zero-temperature relations for CH4 and NH3 by Zharkov & Trubitsyn (1978). In a solar C:N:O proportion, this reduces the density by g cm-3 if GPa, but enhances the density for smaller pressures, due to neglection of finite temperature effects which are important for supercritical ices. Since these EOS are not of comparable quality to those used for all other components, we do not include them here..
2.3. Mass loss
Mass escape caused by stellar energy input is known to occur from the highly irradiated atmosphere of the hot Jupiter HD 209458b (Vidal-Madjar et al., 2003; Yelle, 2004; Erkaev et al., 2007; Murray-Clay et al., 2009), and shown to have a significant impact on the current composition of super-Earth CoRoT-7b (Valencia et al., 2010; Jackson et al., 2010). While the sun-like star CoRoT-7 irradiates the planet with a present X-ray and ultra-violet energy flux (XUV) (Valencia et al., 2010), GJ 1214 is supposed to be an inactive M star (Charbonneau et al., 2009). Assuming it obeys the empirical relation for the surface energy flux of M stars, (Scalo et al., 2007), then with , , the energy flux received by GJ 1214b is only (0.880) erg cm, i.e. that of CoRoT-7b, at the current time. We then expect XUV irradation to have a comparatively lesser, but still important, influence on the atmospheric mass through time.
We use the energy limited escape model of Erkaev et al. (2007) to investigate the mass-loss history of the planet. With a heat absorption efficiency , and a correction factor accounting for the height decrease of the Roche-lobe boundary through tidal effects (Erkaev et al., 2007), the energy-limited mass escape rate (following Valencia et al., 2010) is g s-1. This is the mass loss of present (rocky) CoRoT-7b, with a value of g s-1, for the fiducial GJ 1214b values and . Correcting for the altitude where the XUV flux is absorbed (Lammer et al., 2003), the actual value can further rise by a factor of 10. Within 1 Gyr, this mass loss accummulates to . For a low-mass atmosphere of only about 1% of GJ 1214b’s total mass (which is quite possible for a small mean molecular weight atmosphere: see § 3.1), the fraction of the atmosphere lost during the 3 to 10 Gyr lifetime of this planet can be large enough to influence its cooling behavior. In particular, according to the estimates above and assuming constant mass loss over time, the initial atmosphere can have been larger by . We therefore must include mass loss in our evolution calculations of H/He envelope models, as described below.
2.4. Interior structure and evolution modeling
Three classes.
We consider three classes of hydrostatic two-layer interior models of present GJ 1214b assuming a homogeneous envelope above a rocky core. The three classes differ in the materials constituting the envelope. Class I models have a H/He envelope with solar He mass fraction . Class II models have a pure water envelope (“water worlds”), and class III models a H/He/H2O envelope with variable water mass fraction , and also . The rock core mass of present GJ 1214b models is found by the condition to match the radius (recently confirmed through both optical and infrared photometry (Sada et al., 2010)) for a given planet mass and surface thermal boundary condition. We do not consider different possible pairs within the observational error bars and as such work has already been presented by Rogers & Seager (2010). For the thermal structure of the atmosphere we apply the solar composition model atmosphere between 20 mbar and 10 bar to model classes I and III, and to model class II the water model atmosphere between 20 mbar and 1 bar from Miller-Ricci & Fortney (2010). At higher pressure in the radiative atmosphere, we assume an isothermal temperature—a reasonable assumption (Miller-Ricci & Fortney, 2010) and given and our general understanding of highly irradiated atmospheres.
Calculating the structure.
We choose 20 mbar as the low-pressure boundary of our models. This is a choice of convenience, since our water EOS ends at this pressure, but it is also realistic. The wide-band optical transit radius for the planet is at 10 mbar (E. Miller-Ricci, personal communication). This is consistent with the cloud-free atmosphere calculations of Fortney et al. (2003) for HD 209458b, as well.
The high-pressure boundaries of the model atmospheres of respectively 1 and 10 bar are chosen within the isothermal part of the atmosphere, before it transitions to the adiabatic interior at some pressure . For present time () structure models, we consider the transition pressure a variable parameter and investigate the response of the core mass and the cooling time on the choice of .
Since the model atmospheres predict almost constant equilibrium abundances of H, He, and H2O, we derive the mass density in the atmosphere from an EOS table for constant composition. Given , , and the relations according to the EOS in the atmosphere, and constant in the adiabatic interior, we obtain internal profiles , , and by integrating the equation of hydrostatic equilibrium from the surface toward the center. Mass conservation is ensured by the proper choice of the rock core mass .
The rock core assumption.
We assume the rocky core to be appropriatly described by an EOS of homogeneous, adiabatic ’rocks’ at all times (compare Rogers and Seager 2010: differentiation into an iron core and a silicate layer of at uniform temperature). Differentiation will have occurred when temperatures in the primitive rock core rose above the melting temperature of iron during formation, and will have affected the thermal evolution. In the Earth, solidification of the inner iron core still causes a bouyancy of light elements driving convection of the outer iron core, and supports –together with gravitational energy release from core shrinking– subsolidus convection of the silicate mantle. If the melting line of iron rises steeply with temperature as indicated by ab initio data (see Valencia et al., 2010, for an overview), also the central part of a several earth mass core of GJ 1214b might transition from liquid to solid iron due to high pressure up to Mbar, supporting the assumption of an adiabatic interior.
Due to the poorly constrained iron mass fraction of GJ 1214b and uncertainties in the iron melting line, the deep interior could potentially be fully liquid or solid and isothermal. Since the equations of state of rocky materials at high pressure above few Mbar are not well known and the effect of temperature on the relation is negligible (Seager et al., 2007), we believe the relation of the rock-EOS used is appropriate for our purpose of determining the core mass and its contribution to the cooling time. We denote by the temperature at the core-mantle boundary and assume its time derivative to be representative for the whole core.
Calculating the evolution.
Chosing for class I and II models, and and for class III models uniquely defines the core mass of resulting interior models. A selection of six such present time interior models is shown in Table 1. For class I and II models, we calculate the cooling curve by first generating profiles with decreasing transition pressures mbar values, thereby increasingly warmer interiors. For each of these intermediate profiles, core mass and composition are conserved. As the interior becomes warmer with decreasing , the planet radius rises. In order to obtain the cooling curve , we integrate the energy balance equation
| (1) |
backward in time, starting with the present time structure models. In Eq.(1), is the net luminosity the planet radiates into space, and is the stellar energy absorbed. The difference is provided by our atmosphere grid , see § 2.1, and sets the intrinsic luminosity the planet can radiate away from the interior through its atmosphere at a given gravity and internal entropy. Given , we can then derive the time interval it needs to lose the intrinsic energy ,
| (2) |
Expression (2) accounts for the heat loss of each envelope mass shell , the heat loss of the core due to cooling, and the energy gain of rocky core material due to decay of radioactive elements (see below).
Experimental data for the specific heat of warm, compressed rocks at Mbar are not available. Ab initio calculations for iron at a few Mbar and several thousand K (Earth’s core conditions) predict (Alfè et al., 2001), while was formerly applied by Guillot et al. (1995) to the core of Jupiter and by Valencia et al. (2010) to the silicate-iron interior of CoRoT-7b. We aim to bracket the uncertainty in by chosing . For given , the time interval required to lose rises with .
Radiogenic heat.
As we will see, our class I and III planet models have large rocky cores. Modeling the radiogenic heat from the rocky portion of the interior is important to accurately calculate the thermal evolution. For we consider the isotopes 238U, 235U, 232Th, and 40K. We adopt isotopic abundances and element abundances of meteorites for the elements U, Th, K, and Si333The Si mass abundance of meteorites (10.65%) is unequal that of the rock EOS (16.8%). as given in Anders & Grevesse (1989). With respective half-life times in Gyrs of 4.468, 0.704, 14.05, and 1.27, and respective decay energies in MeV of 4.27, 4.679, 4.083, and 1.33444These values are in part an average over the surprisingly wide spread of literature values, see e.g. http://ie.lbl.gov/education/, and in part over decay chains (40K), we find a radioactive energy release for of meteoric material on Earth today of and 4.56 Gyr ago of . The dominant contribution during this time interval is mostly due to decay of 40K into 40Ca. Extension of the radioactive decay law to 10 Gyr ago would increase to , an unrealistically high value for rock material in the young universe. Of course, for small core masses (), cooling of the core does not significantly affect the model’s cooling time, but for large core mass models it does, and in particular the choice of the initial value matters. Therefore, we define a cosmological luminosity that we require each cooling model of GJ 1214b to start with, within 10%. Models with long cooling times (10 Gyr) will then have , and models with short cooling times (3 Gyr) will have . By this choice of we avoid extremely high or low initial values.
| Label | envelope material | age | ||||||
|---|---|---|---|---|---|---|---|---|
| () | (bar) | ( g/s) | (K) | (Gyr) | ||||
| Ia | 6.464 | 300 | 0 | H/He | 1.84 | 0.0183 | 42.7 | 3.1 |
| Ib | 6.434 | 800 | 0 | H/He | 1.84 | 0.0170 | 31.8 | 7.2 |
| IIa | 0.873 | 80 | 1 | water | - | 0.5769 | 51.9 | 3.05 - 3.16 |
| IIb | 0.203 | 300 | 1 | water | - | 0.737 | 37.6 | 9.23 - 9.26 |
| IIIa | 4.432 | 120 | 0.85 | H/He/water | - | 0.14336 | 48.4 | 2.92 - 3.22 |
| IIIb | 4.016 | 400 | 0.85 | H/He/water | - | 0.186 | 35.6 | 9.21 - 10.10 |
Note. — These structure models have and .
Evolution with mass loss.
For a given planet radius, low mean molecular weight atmospheres or envelopes are also of low mass, and hence such envelopes may lose a larger relative mass fraction than large mean molecular weight atmospheres. We take into account mass loss only for the H/He envelope models, e.g. models Ia,b in Table 1. For each neighbored pair of interior profiles as given by , we calculate the mass lost during a time interval self-consistently using a Newton-Raphson scheme to find the root of the function .
Other contributions.
We did not include the effect of tidal heating due to tides raised on the planet by the star. This additional amount of energy would tend to delay the cooling time, in particular in the past when the eccentricity , and hence the tidal heating (to second order in , e.g.; Batygin et al. 2009b), was larger than today. On the other hand, inclusion of tidal migration of the planet would have reduced the amount of stellar irradition received at early times (Miller et al., 2009). A proper treatment of both effects is beyond the scope of this paper since the orbital eccentricity is not well-constrained (Charbonneau et al., 2009). Instead, we make the standard assumption that the formation of GJ 1214b yielded an initial heat of accretion that was not released before the planet arrived at its current location.
The cooling time of our thermal evolution models is the time between the present state and the time when the derivative approaches , which corresponds to a hot start that is insensitive to the initial conditions. While such a treatment of young planets is common (Baraffe et al., 2003, e.g.;), it actually ignores the process of planet formation which has been shown to alter the luminosity during the first tens of millions of years (Fortney et al., 2005). This is important for mass determinations from cooling tracks, whereas in our case it just might induce an error of Myrs to the calculated cooling time.
Love number .
We follow the call by Ragozzine & Wolf (2009) to tabulate the tidal Love Number values of representative models. This quantity is a planetary property which solely depends on the internal density distribution. If known, imposes an additional constraint on interior structure models. Physically, quantifies the quadrupolic gravity field deformation at the surface in response to an external perturbing body of mass , which can be the parent star, another planet, or a satellite. causes a tide-raising potential , where is the distance between the centers of mass (planet and body), is the radial coordinate of the point under consideration inside the planet, is the angle between the planetary mass element at and the center of mass of at , and are Legendre-Polynomials. Each external potential’s pole moment induces a change in the corresponding degree of the planet’s potential, where defines the Love numbers. For the calculation of we follow the approach described in Zharkov & Trubitsyn (1978).
To first order in the expansion of the planet’s potential, is proportional to the gravitational moment (see e.g. Hubbard, 1984, § 4). That is why measuring will provide a constraint for extrasolar planets that is equivalent to for the solar system planets. In particular, is known to be a measure of the central condensation of an object, which can be parameterized by the core mass within a two-layer model approach. However, as for , the inverse problem—the deduction of the internal density distribution of the planet from , is non-unique.
We stress that the Love number is a potentially observable parameter if the planet’s eccentricity is non-zero. It can be obtained with the help of transit light curves that contain information about the tidally induced apsidal precession of close-in planets (Ragozzine & Wolf, 2009), or for specific two-planet systems can also be derived from measuring the orbital parameters (Batygin et al., 2009b), given that the planets are in apsidal alignment and on co-planar orbits (Mardling, 2010).
3. Results
The framework of the three structure classes I-III is used to investigate the possible set of models with respect to core mass, internal pressures and temperatures, water to rock ratio, and the H/He mass fraction.
3.1. GJ 1214b with a H/He atmosphere and a rock core
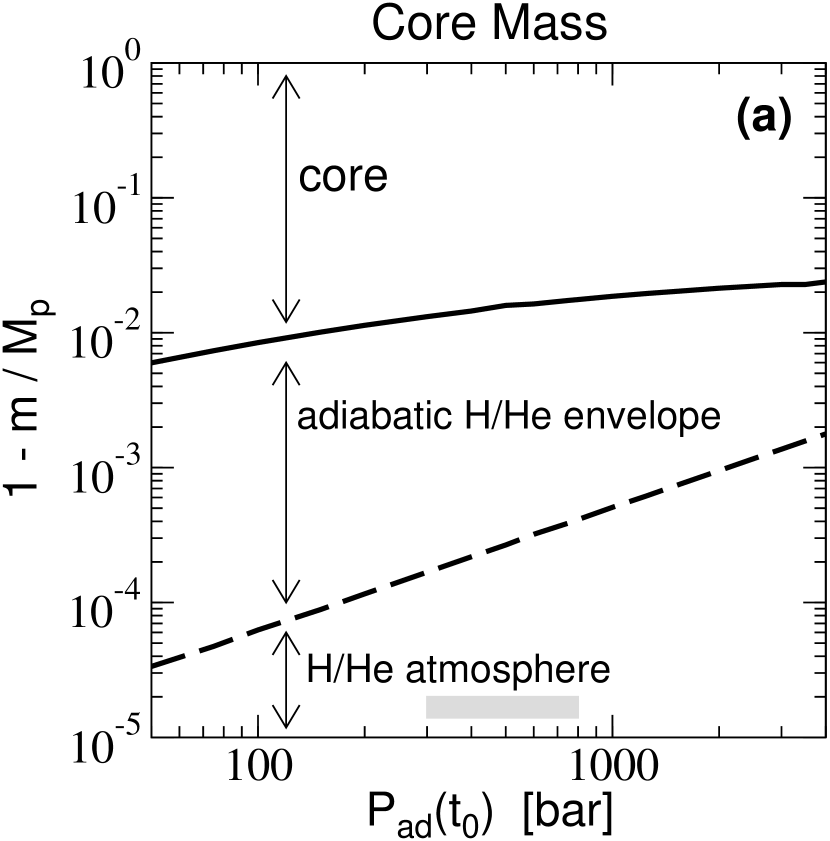
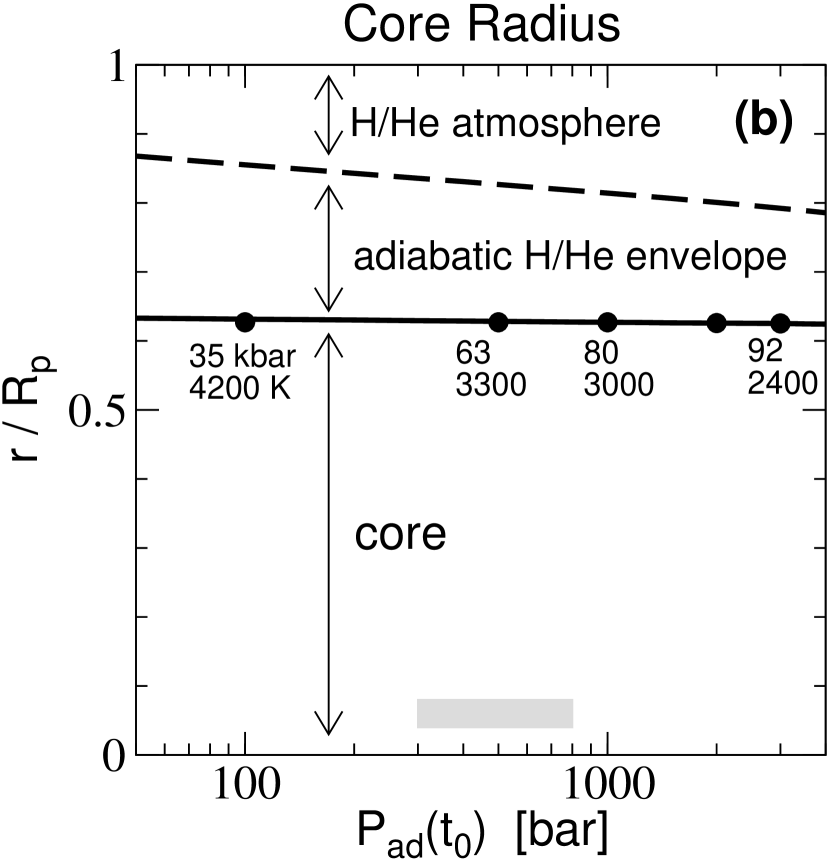

For our H/He envelope+rock core models we find a narrow core mass fraction range of 0.9750.995 for a wide pressure range bar (
). Despite its low mass fraction, the H/He envelope extends over (
) independent of the envelope mass. This is because of its high temperature, which increases from 1030 K at to 24004200 K at kbar at the envelope-core boundary. At these conditions, hydrogen is molecular throughout the envelope according to the SCvH-i EOS.
Not all of the models shown in
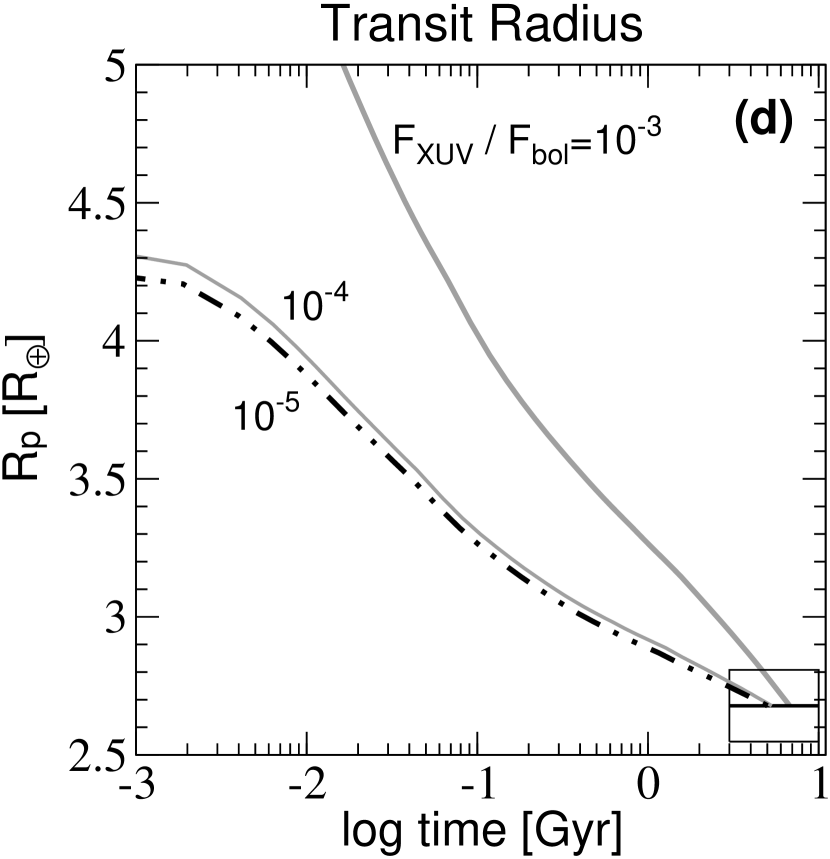
,b are consistent with an age to 10 Gyr of the star GJ 1214. If decreases (increases), internal entropy rises (falls) and the planet will need less (more) time to cool down to this state. This behavior is illustrated by the cooling curves in Fig. 1c, according to which an age of 3 Gyr requires bar; and a much longer cooling time of 7.2 Gyr is obtained for bar, whereas bar would give a cooling time below 1 Gyr. With a mass loss rate according to as assumed for the cooling curves in
, a cooling time of 10 Gyr can not be obtained through a further increase of beyond 800 bar if is not to drop below . The colder the interior, the lower as predicted by our model atmsphere grid, and hence the intrinsic energy then can be transported through the radiative atmosphere. Enhancing from 300 to 800 bar lowers from 42.7 to 31.8 K (Table 1). For even colder interiors, the atmosphere is no longer capable of radiating away the heat generated by radioactive decay, which would contradict the assumption of such a cold interior.
The cooling time increases with the mass loss rate (Fig.1d). For stellar XUV radiation as typical for quiet M-stars (Scalo et al., 2007), this enhancement is small (see
) and we obtain essentially the same range of and hence structure models. Of GJ 1214b’s initial total mass (initial H/He envelope mass), only 0.00540.013% (0.410.74%) is lost if , and about 0.1% (6%) if . On the other hand, for a permanent, strong irradiation as observed for young, active M-Stars listed in the ROSAT catalogue, GJ 1214b would have lost 1.8% (53%). These numbers are in agreement with the rough estimates in § 2.3. In the last case, existence of a thin H/He atmosphere to-date becomes less likely since it begins to require fine-tuning of the initially accreted H/He envelope mass. We have found cooling tracks with an age of 10 Gyrs or more only if bar and the mass loss rate is high, or , which we do not favor.
Models with bar as constrained by our evolution calculations have and implying a high degree of central condensation. The presence of an iron core could even enhance the central condensation. Therefore, although the H/He layer is low in mass, it significantly strengthens the property of central condensation compared to a closer to zero-mass atmosphere planetary object such as the Earth, the theoretical value of which is (Zhang, 1991).
Class I models are closest to giant planets that formed within the snowline of the disk and did not have enough time and/or material in their surrounding to accrete a massive H/He envelope. Class I structure models can best be compared to ’case I’ models by Rogers & Seager (2010), where the difference in composition assumptions can be reduced to the core (undifferentiated rock core versus differentiated iron-silicate-water-ice core in their models), and a slightly different envelope He abundance of respectively 0.27 and 0.28.
Our obtained H/He mass fraction range, 1.31.8%, is due to the uncertainty in . This range is much smaller than theirs (), which includes uncertainties from the 1 errors of and contributing an uncertainty of 0.41.6%, from their values used contributing up to 1.5%, and from the uncertainty in core composition (pure iron, iron-silicates-water, or pure water). Since iron is included in our rock EOS, we consider (1.8%+1.6%=) 3.4% a reliable upper limit of the H/He mass fraction if observations reveal a low-mean molecular weight atmosphere. Recent observations of GJ 1214b’s atmosphere in the 0.78 to 1 m wavelengths range with the VLT facility’s UT1 telescope suggest a mean molecular weight of 5 g/mol or more and thus disfavor a H/He-dominated atmosphere (Bean et al., 2010). On the other hand, the presence of clouds or hazes in such an atmosphere could mimic a short scaleheight, hence high mean moelcular weight, and cannot be excluded by current observations and model atmospheres.
3.2. GJ 1214b as a water planet with a rock core
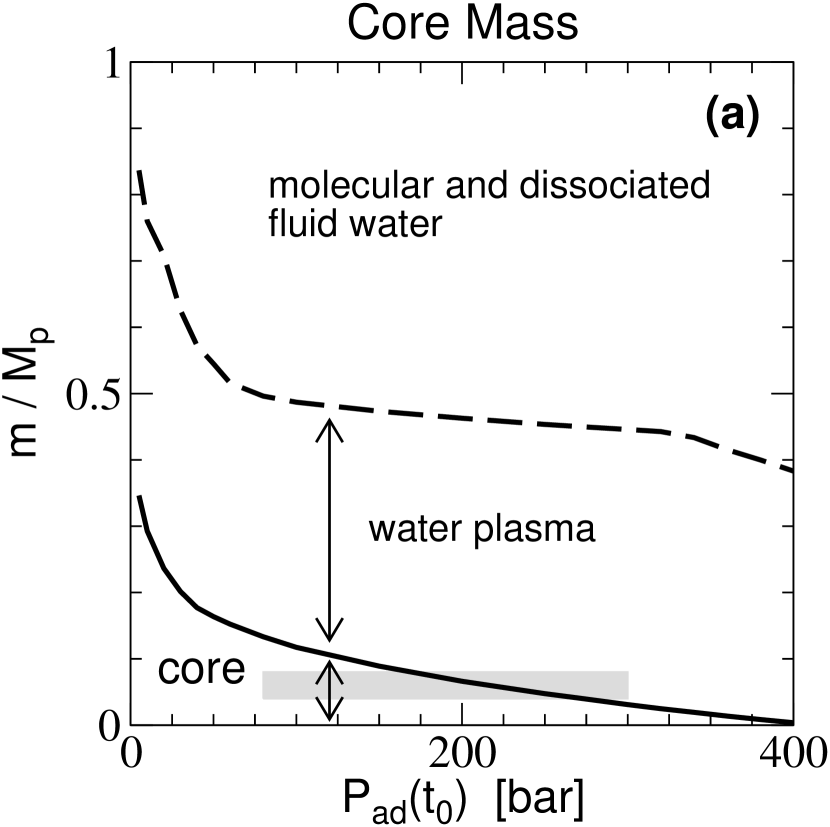

The derived core mass of water envelope+rock core models responds much more strongly to a change of the onset of the adiabatic part of the envelope than models with H/He envelope. At bar, the core mass reaches zero: a pure water planet (
). Deeper isothermal regions would only be possible if some amount of the pure water planet would be replaced by lighter elements such as methane or ammonia. Warming up the deep envelope by an outward shifting of the onset of the adiabatic region below 50 bar is accompanied by a strong rise in core mass. A solar water:rock ratio of 2.5 occurs for bar—when the deep interior is extremely hot. Smaller ratios would be possible only if the isothermal region is allowed to disappear. We next consider whether such models are consistent with the cooling time.
Because of the relatively small core mass fraction of class II models, varying the specific heat of the core has a negligible effect on the cooling time. For bar the resulting cooling times are consistent with , see Table 1 and
. Those models have , and a water:rock ratio of 6.531. This is much higher than the solar ice to rock ratio (I:R), which would give a cooling time shorter than 3 Gyr.
In contrast to models Ia,b, models IIa,b are weakly centrally condensed as parametrized by their high values of respectively 0.57 and 0.74.
Class II models are different from those by Fu et al. (2010) who consider cold water planets with ice or liquid ocean layers above silicate/iron cores. GJ 1214b is not that cold. Our models also differ from the water steam atmosphere models of CoRoT-7b by Valencia et al. (2010) who find water envelope + silicate/iron core models where water in present CoRoT-7b contributes at most 10% to the total mass and is in the vapor phase or supercritical molecular phase. They also differ from the water steam atmosphere models by Rogers & Seager (2010) who describe the deep interior by a water-ice equation of state, whereas according to the phase diagram (
(updated from French et al., 2009; Valencia et al., 2010), water would be in the plasma phase in GJ 1214b.
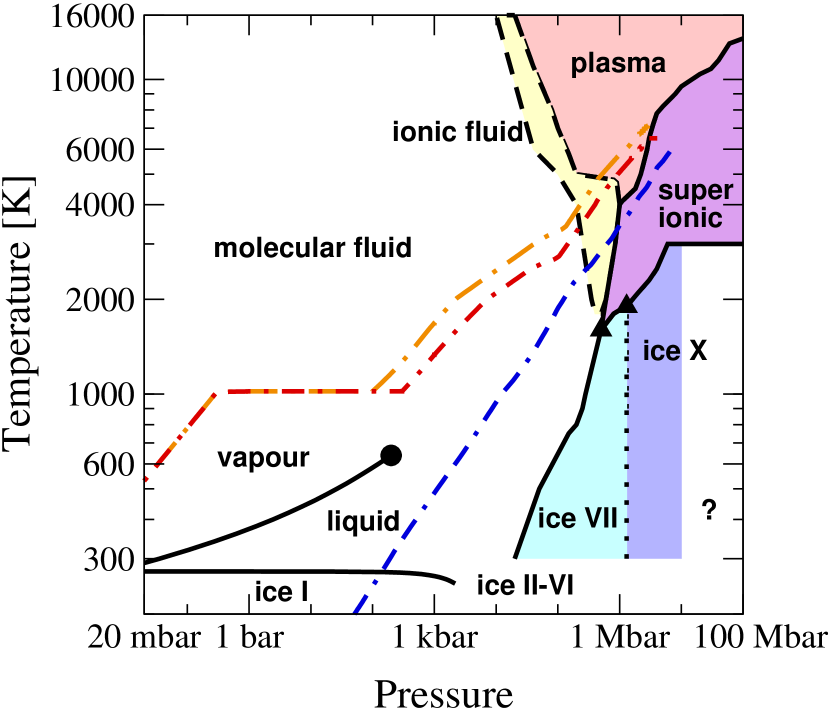
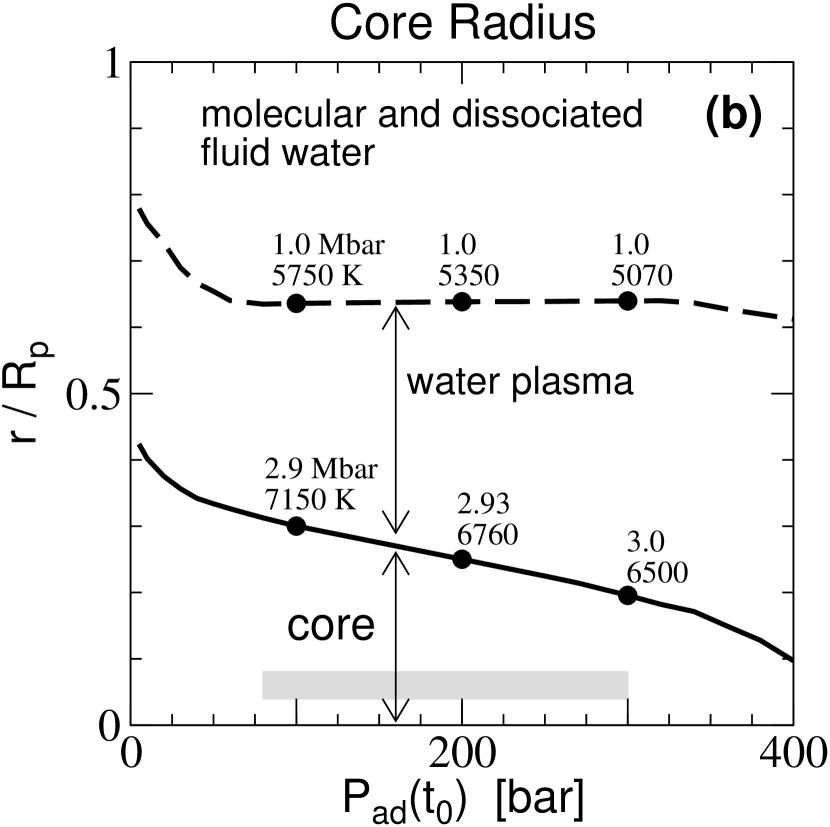
In our class II models, water transitions from the vapor phase to supercritical molecular water still in the atmosphere, becomes dissociated into an ionic fluid at about 4000 K and 0.2 Mbar, and finally fully dissociated and ionized for K and Mbar (
) forming a plasma with electronic conductivity (Redmer et al., 2011).
Under these circumstances, a planetary interior can be able to maintain a dynamo generating a dipolar magnetic field. In Uranus and Neptune, the magnetic field may be generated in a thin shell (Stanley & Bloxham, 2006) of possibly ionic water (Nellis et al., 1988). This view of the cold ( K) outer planets Uranus and Neptune is supported by the Neptune adiabat in
while in GJ 1214b, since it is warmer, the fluid conductive envelope would extend down to the small core, somewhat akin to Jupiter, and therefore preferably lead to a dipolar field, according to the field geometry considerations by Stanley & Bloxham (2006).
3.3. GJ 1214b as a H/He/H2O planet with a rock core
This structure type resembles the outer envelope of Uranus and Neptune if , or their inner envelope if according to three-layer Uranus and Neptune models of Fortney & Nettelmann (2010). A strong enrichment in metals of the outer H/He layer in Uranus and Neptune is necessary to match the gravity field data, and also some admixture of light elements in the deep interior.


In § 3.2 we have seen that water envelope+rock core models of GJ 1214b yield supersolar I:R ratios of more than solar. Lowering this ratio can be achieved by replacing water with hydrogen and helium. The two limiting cases of this implementation are a structure where a H/He layer is on top of a water layer, or a homogeneous mixture of H/He and H2O. We find that in the first case, such differentiated three-layer models (H/He, water, rock) can not have (I:R)⊙ and be in agreement with , the reason of which is the following. Class I and class II models require a radiative atmosphere down to 80 bar or more at present in order to meet . If composed solely of H/He, the atmosphere extends over about . In order to match a remaining radius , the core mass fraction of the remaining water+core body is of the order of 20-50% (see Valencia et al., 2010, LABEL:8). We find I:R and for this case of differentiated models. Increasing increases the depth of the thin H/He atmosphere, thereby lowering the I:R ratio even more. Increasing the planet’s mean density within the error bars of and allows for I:R up to at most (I:R)⊙.
Consequently, the only way to obtain a solar I:R ratio is to limit the radius of the H/He atmosphere by enhancing its mean molecular weight (Miller-Ricci et al., 2009) through admixture of water. Here we consider the case of equal metallicity in the radiative atmosphere and in the adiabatic envelope (our class III models) as parameterized by the water mass fraction . Figure 14a shows the change of the I:R ratio of single models. The water to core mass ratio rises moderately up to , passes (I:R)⊙ at , and then rises rapidly up to the values found for class II models. This behavior depends very weakly on the choice of .
For class III models, the resulting H/He mass fraction of the planet (see
) is about 23 times larger than in case of a H/He layer on top of a water layer. It reaches the maximum for (the core mass must not be too large, requiring a high metallicity, and also not too close to 1). We find a planetary H/He mass fraction % if bar as in
,b, and slowly rising with up to 7% (colder envelopes reduce the core mass). However, a colder present time interior would take longer than 10 Gyrs to cool. For the cooling curve calculations we choose a metallicity , which gives a H/He mass fraction close to the maximum value but also a core mass below , hence a real alternative to classes I and II. Figure 14c shows that the isothermal region of present GJ 1214b must end between 120 and 400 bar to give consistency with a cooling time of 3 to 10 Gyrs.
With , K, and Mbar (
), model IIIb resembles the interior of Uranus and Neptune in composition and temperature (Fortney & Nettelmann, 2010). Lower in total mass, the pressure does not rise up to 57 Mbar as in the outer solar system giant planets, so that water will not adopt the superionic phase according to the phase diagram of water, but remain in a fluid state in GJ 1214b (
. This property bolsters our assumption of a homogeneous mixture of water with hydrogen and helium.
4. Discussion
4.1. Structure assumptions
Our GJ 1214b interior models rely on a separation of the interior into a rock core and one homogeneous envelope of the same composition as in the visible atmosphere. In contrast, giant and terrestrial planets in the solar system are not successfully described by such a two-layer structure but require the assumption of various internal layer boundaries to be consistent with the atmospheric He abundance and the gravity field data (giant planets: see Gudkova & Zharkov, 1999; Saumon & Guillot, 2004; Nettelmann et al., 2008; Fortney & Nettelmann, 2010), long-term spacecraft tracking data (Mars: see Konopliv et al., 2006), and with seismic data (Earth).
4.1.1 class III: H/He phase separation?
For the giant planets, a layered structure is suggested in part because of a measured atmospheric depletion in He indicating H/He phase separation, and in part because of relatively low measured ratios indicating an enhancement with metals in the deep interior. According to experimental and theoretical data on H/He demixing (see e.g. Lorenzen et al., 2009; Morales et al., 2009), immiscibility of He in H might also occur in our class III models close to the core-mantle boundary. Given the low interior temperatures (relative to Saturn) this could very strongly deplete most of the envelope in helium (Fortney & Hubbard, 2004). While accurate measurements of the atmospheric He abundances are extraordinary difficult to perform without the use of entry probes even in case of solar giant planets, this effect can affect the current depth of the isothermal region (120400 bar) that we have derived from the cooling time calculations. This would be a completely different pathway towards a helium-depleted hydrogen atmosphere than the outgassing scenario discussed in Rogers & Seager (2010). On the other hand if , then the envelope does not become massive and dense enough for He sedimentation to occur.
4.1.2 class II: Incomplete Differentiation?
Our class II models require a process that causes a downward sedimentation of rocks in order to separate out a water layer, as in Ganymede (Kirk & Stevenson, 1987). Up to now, there is no experimental evidence that water and silicates or iron become immiscible under high pressure, and the timescale for gravitational settling before the onset of convection, terminating gravitational settling, is essentially unknown for Ganymede (Kimura et al., 2009). Since the larger primordial heat deposited in the times more massive GJ 1214b might have caused a rapid onset of convection, a water+rock interior of GJ 1214b is possibly not fully differentiated. Internal layer boundaries dividing regions with different water to rock ratios can not be excluded, and the core rather be an ice-rock mixture as suggested for Callisto (Nagel et al., 2004) than pure rocks. On the other hand, more detailed envelope models of GJ 1214b would be underdetermined by current observational parameters.
4.1.3 class I: Choked off giant planet formation?
The core mass of our class I models is within the range of rock core masses currently proposed for Jupiter (Fortney & Nettelmann, 2010). With an initial H/He atmosphere of only 12% , GJ 1214b appears to be a giant planet whose envelope mass accretion was choked off during formation. It is of general interest for more super-Earth planets to be detected to see whether this is a common outcome of planet formation.
4.2. Composition
From interior and atmosphere models that are consistent with the observationally derived parameters , , and after 310 Gyrs of cooling, the most certain conclusion we can draw about the composition of GJ 1214b is a metallicity of 94100%. The lower limit can further shrink somewhat if the planet in reality is dry, and the mass fraction of water in our class III models then resembles a mixture of H/He and rocks. In contrast, the mass fractions of water, used as a proxy for the ices H2O, CH4, NH3, and H2S, is essentially unconstrained (097%) as is the mass fraction of rocks (399%).
Two further observables we can hope to attain in the near future are the Love number from transit timing variations or from the shape of the transit light curves (Ragozzine & Wolf, 2009), and second the mean molecular weight in the atmosphere from transmission spectroscopy, in particular from the wavelength dependence of star light absorption in the planetary atmosphere during transit (Miller-Ricci & Fortney, 2010).
4.2.1 Love number
The values of models from our classes I-III differ greatly from each other and thus we consider a useful quantity to discriminate between atmospheres of different mean molecular weight. The trend of decreasing value with increasing core mass that is known for two-layer models of Jupiter-mass giant planets with a core and one envelope (Batygin et al., 2009b), or for n=1 polytropic planets in general (Kramm et al., 2011), is confirmed by our two-layer models of GJ 1214b. An illustration of the behavior is shown in
which contains the same data as Table 1 and also some intermediate points as well as two solutions of the H/He envelope models with respectively and 2 kbar, which are too cold as explained in § 3.1.
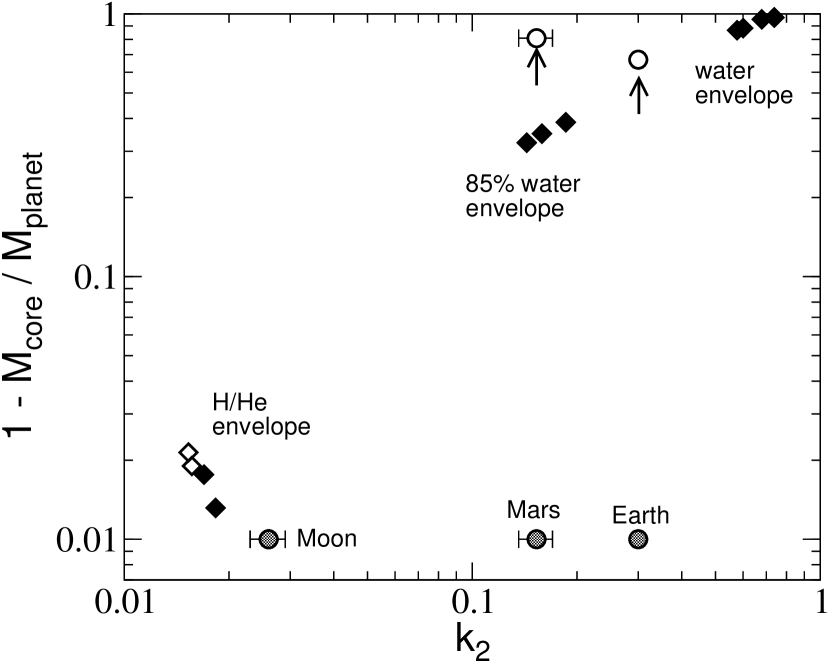
However, when the H/He atmosphere becomes thin and its mass low enough (), this planet begins to more closely resemble a relatively homogeneous rock body than a core+envelope planet, and rises again. This degeneracy of that is otherwise well-known for multi-layer models is –at first glance– a surprising finding in two-layer super-Earth models. As
uggests, pure H atmosphere models of GJ 1214b (Rogers & Seager, 2010) would approach the values of solar system bodies such as the Moon, i.e. higher than that of H/He atmospheres.
Moon, Mars, and Earth can be considered as remnant protoplanetary cores () that did not accumulate sufficient mass to accrete a significant envelope. On the other hand, because measured values of Earth (see Ray et al., 2001), Mars (Yoder et al., 2003; Konopliv et al., 2006), and Moon (Zhang, 1992) cannot be explained by a homogeneous rock interior but require the assumption of a dense, iron-rich core (e.g. Zharkov et al., 2009), they can also be considered as objects with small (iron) core and large (silicate) mantle (). This places Mars and Earth close to our GJ 1214b models with H/He/Z envelope in the diagram, implying that is a degenerate quantity with respect to composition, too. Separation into layers of different composition owing to phase differentiation and phase transitions in rocks (Valencia et al., 2007) has likely also occured in GJ 1214b. Such an advanced treatment of a core would enhance the level of central condensation, and result in even lower minimum values below 0.017. The same trend is expected for inclusion of solid-body effects, which will be important for colder super-Earth planets and those with less extended, less massive atmosphere. Theoretical values for the terrestrial objects are in good agreement with the observations when making the simplifying assumption of an elastic interior (Zhang, 1992; Yoder et al., 2003) (in which case the shear modulus becomes frequency-independent, i.e. a static Love number), while their observed moments of inertia are close to 0.4 indicating a nearly homogeneous interior, the theoretical Love number of which would approach 1.5 if the body were fluid and compressible.
4.2.2 Mean molecular weight
Class III models with solar I:R ratio are not excluded by our thermal evolution calculations. Those models require , corresponding to a mean molecular weight and 440solar O:H particle number ratio (assuming a solar O:H of according to Anders & Grevesse 1989). However, we do not consider such models a realistic description of GJ 1214b. For rapid translations between metallicity and atmospheric values from transmission spectroscopy observations, we present the simple relations between , O:H, and in

In particular, our class III models with have , a solar atmospheric O:H ratio, 0.2 times solar bulk I:R ratio, and of is H/He. For , our class III models become severely rock-dominated with , and O:H solar. A 50solar O:H ratio as of our model atmosphere grid applied to the thermal evolution calculations (see § 2.1) implies . For as suggested from the first transmission spectrum observations by Bean et al. (2010),
ives and according to
GJ 1214b could be mostly rocky with an I:R ratio of 0.15, where the H/He/H2O atmosphere contributes to the planet’s mass and 40% to its radius.
5. Conclusions
Our results for the composition of the super-Earth mass planet GJ 1214b confirm that it has a gaseous atmosphere atop a fluid envelope. We find a minimal total H/He mass fraction of 1.3% for pure H/He envelopes, which can rise to 56% if the envelope contains 6090% H2O in mass, and even further if also silicates and iron are mixed into the envelope.
Water in GJ 1214b does not solidify within 10 Gyrs of cooling, and it not a liquid as is found on Earth’s surface, but becomes a plasma if its abundance is high (). This leads to a large water mass (), where the deep internal matter is warm ( K) and dense ( Mbar).
The intrinsic heat loss of GJ 1214b after 310 Gyr of cooling corresponds to K, where the lower bound depends on assumptions about the heat production by radioactive elements and slightly on mass loss. By our self-consistent mass-loss calculations we conclude that GJ 1214b is a genuine super-Earth that has lost an insignificant amount of its initial mass, unlike CoRoT-7b.
Nevertheless, some of our computed models may fall into the realm of the unlikely. These include class I models that have lost more than 50% of their initial H/He envelope (i.e. lost) due to extraordinary XUV irradiation and thus require fine-tuning of their initial H/He mass fraction. Moreover, extremely low-mass H/He atmospheres in general might be an unlikely outcome of planet formation. The unlikelihood of forming a massive planet with an extreme ice-to-rock ratio of more than 6 casts our class II (“water world”) models in doubt. We instead favor what is thought to be the most Uranus- and Neptune-like planet models, class III. It includes envelopes with water by mass mixed into H and He atop a rock core with about solar bulk ice:rock ratio. These models have higher H/He masses (5.8% of the planet mass) than class I models with pure H/He atmospheres, lessening worries about the survival of a H/He envelope in the face of mass loss. A general outcome of these models is K, while the conditions at the core-mantle boundary are Mbar and K. The atmosphere can be strongly depleted in helium due to H/He phase separation deeper inside the planet (if ) or not be depleted in He if is much smaller than this.
Calculated Love numbers of water envelope models that are consistent with the observables , , , and the age, are in the range 0.580.74, whereas pure H/He envelope models have , and our favorite models . An observational determination of and the atmospheric mean molecular weight is crucial for determining the envelope metallicity and the core mass of this and other planets that are located along the relation of water planets. However, ambiguities in composition are an inherent property of such planets.
References
- Alfè et al. (2001) Alfè, D., Price, G. D., & Gillan, M. J. 2001, Phys. Rev. B, 64, 045123
- Anders & Grevesse (1989) Anders, E., & Grevesse, N. 1989, GeCoA, 53, 197
- Baraffe et al. (2008) Baraffe, I., Chabrier, G., & Barman, T. 2008, A&A, 482, 315
- Baraffe et al. (2003) Baraffe, I., Chabrier, G., Barman, T. S., Allard, F., & Hauschildt, P. 2003, A&A, 402, 701
- Batygin et al. (2009b) Batygin, K., Bodenheimer, P., & Laughlin, G. 2009b, ApJ, 704, L49
- Bean et al. (2010) Bean, J. L., Miller-Ricci Kempton, E., & Homeier, D. 2010, Nature, 468, 669
- Charbonneau et al. (2009) Charbonneau, D., Zachory, B. K., Irwin, J., et al. 2009, Nature, 462, 891
- Erkaev et al. (2007) Erkaev, N. V., Kulikov, Y. N., Lammer, H., Selsis, F., D., L., Jaritz, G. F., & Biernat, H. K. 2007, A&A, 472, 329
- Feistel & Wager (2006) Feistel, R., & Wager, W. 2006, Phys. Chem. Ref. Data, 35, 1021
- Fortney & Hubbard (2004) Fortney, J. J., & Hubbard, W. B. 2004, ApJ, 608, 1039
- Fortney et al. (2010b) Fortney, J. J., Ikoma, M., Nettelmann, N., Guillot, T., & Marley, M. S. 2010b, ApJ, 729, 32
- Fortney et al. (2007) Fortney, J. J., Marley, M. S., & Barnes, J. W. 2007, ApJ, 659, 1661
- Fortney et al. (2005) Fortney, J. J., Marley, M. S., Hubickyj, O., Bodenheimer, P., & Lissauer, J. J. 2005, AN, 326, 925
- Fortney & Nettelmann (2010) Fortney, J. J., & Nettelmann, N. 2010, in Springer Space Science Reviews, Vol. 157, Planetary Magnetism, ed. U. Christensen, A. Balogh, D. Breuer, & K.-H. Glaßmeier, 423–447
- Fortney et al. (2003) Fortney, J. J., Sudarsky, D., Hubeny, I., Cooper, C. S., Hubbard, W. B., Burrows, A., & Lunine, J. I. 2003, ApJ, 589, 615
- Freedman et al. (2008) Freedman, R. S., Marley, M. S., & Lodders, K. 2008, ApJS, 174, 504
- French et al. (2009) French, M., Mattsson, T. R., Nettelmann, N., & Redmer, R. 2009, Phys. Rev. B, 79, 954107
- Fu et al. (2010) Fu, R., O’Connel, R., & Sasselov, D. D. 2010, ApJ, 708, 1326
- Gudkova & Zharkov (1999) Gudkova, T. V., & Zharkov, V. N. 1999, Planet. Space Sci, 47, 120
- Guillot (1999) Guillot, T. 1999, Science, 296, 72
- Guillot et al. (2006) Guillot, T., Burrows, A., Hubbard, W. B., Lunine, J. I., & Saumon, D. 2006, ApJ, 459, L35
- Guillot et al. (1995) Guillot, T., Chabrier, G., Gautier, D., & Morel, P. 1995, ApJ, 450, 463
- Guillot & Gautier (2009) Guillot, T., & Gautier, D. 2009, arXiv:0912.2019v1
- Hubbard (1977) Hubbard, W. 1977, Icarus, 30, 305
- Hubbard (1984) Hubbard, W. B. 1984, Planetary Interiors (Van Nostrand Reinhold Company Inc.)
- Hubbard & Marley (1989) Hubbard, W. B., & Marley, M. S. 1989, Icarus, 78, 102
- Hubbard et al. (1995) Hubbard, W. B., Podolak, M., & Stevenson, D. J. 1995, in Neptune and Triton, ed. Cruishank (University of Arizona, Tucson), 109–138
- Jackson et al. (2010) Jackson, B., Miller, N., Barnes, R., Raymond, S. N., Fortney, J. J., & Greenberg, R. 2010, MNRAS, 407, 910
- Kerley (2004) Kerley, G. 2004, An equation of state of Helium, Tech. rep., KTS04-2
- Kimura et al. (2009) Kimura, J., Nakagawa, T., & Kurita, K. 2009, Icarus, 202, 216
- Kirk & Stevenson (1987) Kirk, R. L., & Stevenson, D. J. 1987, Icarus, 69, 91
- Konopliv et al. (2006) Konopliv, A. S., Yoder, C. F., Standish, E. M., Yuan, D.-N., & Sjogren, William, L. 2006, Icarus, 182, 23
- Kramm et al. (2011) Kramm, U., Nettelmann, N., Redmer, R., & Stevenson, D. S. 2011, A&A, 528, A18
- Lammer et al. (2003) Lammer, H., Selsis, F., Ribas, I., Guinan, E. F., Bauer, S. J., & Weiss, W. W. 2003, ApJ, 598, L121
- Léger et al. (2009) Léger, A., Rouan, D., Schneider, R., et al. 2009, A&A, 506, L287
- Lorenzen et al. (2009) Lorenzen, W., Holst, B., & Redmer, R. 2009, Phys. Rev. Lett., 102, 5701
- Lyon & Johnson (1992) Lyon, S., & Johnson, J. D. e. 1992, SESAME: Los Alamos National Laboratory Equation of State Database, Tech. rep., LANL report no. LA-UR-92-3407
- Mardling (2010) Mardling, R. A. 2010, MNRAS, 410, 1048
- McDonough & Sun (1995) McDonough, W. F., & Sun, S.-S. 1995, Chem. Geology, 120, 223
- Miller et al. (2009) Miller, N., Fortney, J. J., & Jackson, B. 2009, ApJ, 702, 1413
- Miller-Ricci & Fortney (2010) Miller-Ricci, E., & Fortney, J. J. 2010, ApJ, 716, L74
- Miller-Ricci et al. (2009) Miller-Ricci, E., Seager, S., & Sasselov, D. 2009, ApJ, 690, 1056
- Morales et al. (2009) Morales, M. A., Schwegler, E., Ceperly, D., Pierleoni, C., Hamel, S., & Casperson, K. 2009, PNAS, 106, 1324
- Murray-Clay et al. (2009) Murray-Clay, R., Chiang, E. I., & Murray, N. 2009, ApJ, 693, 23
- Nagel et al. (2004) Nagel, K., Breuer, D., & Spohn, T. 2004, Icarus, 169, 402
- Nellis et al. (1988) Nellis, W. J., Hamilton, D. C., Holmes, N. C., Radousky, H. B., Ree, F. H., Mitchell, A. C., & Nicol, M. 1988, Science, 240, 779
- Nettelmann et al. (2008) Nettelmann, N., Holst, B., Kietzmann, A., French, M., Redmer, R., & Blaschke, D. 2008, ApJ, 683, 1217
- Nettelmann et al. (2010) Nettelmann, N., Kramm, U., Redmer, R., & Neuhäuser, R. 2010, A&A, 523, A26
- Ragozzine & Wolf (2009) Ragozzine, D., & Wolf, A. S. 2009, ApJ, 698, 1778
- Ray et al. (2001) Ray, R. D., Eanes, R. J., & Lemoine, F. G. 2001, Geophys. J. Int., 144, 471
- Redmer et al. (2011) Redmer, R., French, M., Nettelmann, N., & Mattsson, T. R. 2011, Icarus, 211, 798
- Rogers & Seager (2010) Rogers, L. A., & Seager, S. 2010, ApJ, 716, 1208
- Sada et al. (2010) Sada, P. V., et al. 2010, ApJ, 720, L215
- Saumon et al. (1995) Saumon, D., Chabrier, G., & van Horn, H. M. 1995, ApJ, 99, 713
- Saumon & Guillot (2004) Saumon, D., & Guillot, T. 2004, ApJ, 609, 1170
- Scalo et al. (2007) Scalo, J., et al. 2007, Astrobiology, 7, 85
- Seager et al. (2007) Seager, S., Kuchner, M., Hier-Majumder, C. A., & Militzer, B. 2007, ApJ, 669, 1279
- Stanley & Bloxham (2006) Stanley, S., & Bloxham, J. 2006, Icarus, 184, 556
- Valencia et al. (2010) Valencia, D., Ikoma, M., Guillot, T., & Nettelmann, N. 2010, A&A, 516, A20
- Valencia et al. (2007) Valencia, D., Sasselov, D. D., & O’Connell, R. J. 2007, ApJ, 656, 545
- Vidal-Madjar et al. (2003) Vidal-Madjar, A., Lecavalier des Etangs, A., Desert, J.-M., Ballester, G. E., Ferlet, R., Hebrard, G., & Mayor, M. 2003, Nature, 422, 143
- Wagner & Pruß (2002) Wagner, W., & Pruß, A. 2002, J. Phys. Chem. Ref. Data, 31, 387
- Yelle (2004) Yelle, R. V. 2004, Icarus, 170, 167
- Yoder et al. (2003) Yoder, C. F., Konopliv, A. S., Yuan, D. N., Standish, E. M., & Folkner, W. M. 2003, Science, 300, 299
- Zhang (1991) Zhang, C. Z. 1991, Earth, Moon, and Planets, 54, 129
- Zhang (1992) —. 1992, Earth, Moon, and Planets, 56, 193
- Zharkov et al. (2009) Zharkov, V. N., Gudkova, T. V., & Molodensky, S. M. 2009, PEPI, 172, 324
- Zharkov & Trubitsyn (1978) Zharkov, V. N., & Trubitsyn, V. P. 1978, Physics of Planetary Interiors (Tucson: Parchart)