Modeling of the spectral energy distribution of the cataclysmic variable TT Ari and evaluation of the system parameters
Abstract
The spectral energy distribution (SED) of the TT Ari system, which is well known from published IUE and optical photometric observations, was modeled by a steady-state accretion -disc around a white dwarf. Parameters of the system were derived from time-resolved optical spectral observations in the bright state that we obtained in Sep. 1998. The radial velocity semi-amplitude of the white dwarf (33.8 2.5 km s-1) and corresponding mass function ( = 5.5 ) were derived from the motion of the emission components of Balmer lines. The mass ratio ( 0.315) was evaluated from the fractional period excess of the superhump period over the orbital period ( 0.085), and a secondary mass range () was estimated from the orbital period. Therefore, the white dwarf mass range is and the inclination angle of the system to the line of sight is 17 – 22.5 degrees. The adopted distance to the system is 335 50 pc. To fit the observed SED it is necessary to add a thermal spectrum with K and luminosity to the accretion disc spectrum. This combined spectrum successfully describes the observed Balmer lines absorption components. Formally the best fit of the HeI 4471 line gives minimum masses of the components ( = 0.18 and = 0.57 ), with the corresponding inclination angle and mass-accretion rate g s-1.
Keywords:
binaries: spectroscopic, novae, cataclysmic variables, stars: individual: TT Arietis:
97.10.Gz,97.80.Gm,97.80.Fk1 Introduction
TT Ari is a bright (V10.m8) anti-dwarf nova with orbital period =0.d13755 (Thorstensen et al., 1985). The photometric period varies from =0.d1329 (Smak & Stepiec, 1969) to =0.d14926 due to accretion disc precession (Skillman et al., 1998). In the bright state, optical spectra of the system show broad Balmer absorption lines with narrow central emission peaks together with HeII 4686 and CIII/NIII 4645 emissions (Stanishev et al., 2001; Wu et al., 2002). Gänsicke et al. (1999) determined the spectral class of the secondary (M3.50.5) and obtained a distance to the system = 33550 pc.
Here we present the spectroscopic observations of TT Ari and the estimation of the system parameters using spectral energy distribution (SED) modeling.
2 Observations
Spectroscopic observations of TT Ari were carried out on Sept. 13-14, 1998, by the 6–meter telescop BTA of the Special Astrophysical Observatory with the long-slit spectrometer SP-124, which gives a = 2.9 Å resolution in the wavelength region 4000–5300 Å. 180 consecutive spectra with the same exposure time of 60 s were obtained. The average normalized speectrum is shown in Fig. 2.
The radial velocities of the white dwarf were measured using the narrow emission cores of hydrogen lines. Dependences of the radial velocity on the orbital phase for Hβ and Hγ are shown in Fig. 1.


3 Estimation of system parameters
We adopted = 33.75 2.5 km s-1 from our radial velocity measurements and other authors, results (Stanishev et al., 2001; Wu et al., 2002). Using this value, we derive the corresponding red dwarf mass function .
The mass of the secondary star can be evaluated from the orbital period using the mass-radius relation for main sequence stars: (Howell et al., 2001), (Knigge, 2006), and (Patterson et al., 2005) .
The mass ratio can be found from the fractional period excess using the relation (Patterson et al., 2005)
| (1) |
This relation gives 0.315, because 0.085 for TT Ari.


4 SED modeling
We tried to employ the SED of TT Ari to obtain an additional limitation on the TT Ari parameters. To model of the accretion disc spectra our code was used (Suleimanov, 1992, 1996). In this code, stellar atmosphere spectra with solar chemical composition and corresponding and are taken as local spectra of the disc. The external disc irradiation is not taken into account. The accretion disc model spectra were computed for six models with parameters presented in Table 1. The mass accretion rates were obtained using the observed flux at 1460 Å (IUE,Verbunt (1987)), and the adopted distance pc.
| 0.18 | 0.22 | 0.26 | 0.30 | 0.34 | 0.38 | |
|---|---|---|---|---|---|---|
| 0.57 | 0.75 | 0.83 | 0.95 | 1.08 | 1.20 | |
| , deg | 22.1 | 20.6 | 19.4 | 18.5 | 17.7 | 17.0 |
| g s-1 | 2.59 | 1.91 | 1.48 | 1.18 | 0.94 | 0.76 |
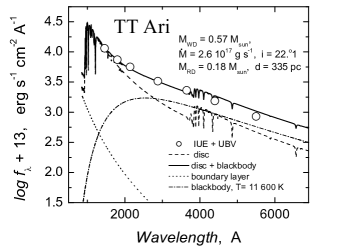
The accretion disc spectrum alone cannot describe the observed SED (Verbunt, 1987; Bruch & Engel, 1994), see Fig. 3 (left panel). This problem was first mentioned by Wade (1988). Formally, the relatively good agreement with the observed SED can be obtained adding a blackbody spectrum with = 11 600 K and luminosity 0.4 . This additional flux can arise due to irradiation of the outer disc by the central disc part and a boundary layer. But a huge outer disc half-thickness 0.4 is necessary for this (at a radiation reprocessing efficiency = 0.3). There is a similar problem for the optical flux of supersoft X-ray sources (Popham & DiStefano, 1996) and can be also explained by a system of optically thick clouds above the outer disc (Suleimanov et al., 2003), see Fig. 3 (right panel).
The model spectra with the blackbody component satisfactorily describe the widths of absorption wings of Balmer and HeI lines (Fig. 2). The best description of the HeI 4471 line gives the pair = 0.18 and = 0.57 . The red wing of this line is blended by the MgII 4481 line. A very small ( 1% of solar) magnesium abundance is suggested to explain the shallow depth of this line.

5 Conclusions
We conclude that the observed TT Ari SED and the absorption components of Balmer and HeI lines can be described by the accretion disc radiation with an additional blackbody ( = 11 600 K, = 0.4 ). The system parameters range between , and the inclination angle .
References
- Thorstensen et al. (1985) J. R. Thorstensen, J. Smak, and F. V. Hessman, PASP 97, 437-445 (1985).
- Smak & Stepiec (1969) J. Smak, and K. Stepiec, in Non-periodic Phenomena in Variable Stars, edited by L. Detre, Academy Press, Budapest, 1969, pp. 355-360.
- Skillman et al. (1998) D. R. Skillman, D. A. Harvey, J. Patterson et al. 1998, Astrophys. Journal 503, L67-L70 (1998).
- Stanishev et al. (2001) V. Stanishev, Z. Kraicheva, and V. Genkov, Astron. and Astrophys. 379, 185-198 (2001).
- Wu et al. (2002) X. Wu, Z. Li, Y. Ding, Z. Zhang, and Z. Li, Astrophys. Journal 569, 418-422 (2002).
- Gänsicke et al. (1999) B. T. Gänsicke, E. M. Sion, K. Beuermann, D. Fabian, F. H. Cheng, and J. Krautter, Astron. and Astrophys. 347, 178-184 (1999).
- Howell et al. (2001) S. B. Howell, L. A Nelson, and S. Rappaport, Astrophys. Journal 550, 897-918 (2001).
- Knigge (2006) C. Knigge, MNRAS 373, 484-502 (2006).
- Patterson et al. (2005) J. Patterson, J. Kemp, D. Harvey et al., PASP 117, 1204-1222 (2005).
- Suleimanov (1992) V. Suleimanov, Astr. Lett. 18, 104-108 (1992).
- Suleimanov (1996) V. Suleimanov, Astr. Lett. 22, 92-107 (1996).
- Verbunt (1987) F. Verbunt, Astron. and Asstrophys. Suppl. 71, 339-361 (1987).
- Bruch & Engel (1994) A. Bruch, and A. Engel, Astron. and Asstrophys. Suppl. 104, 79-88 (1994).
- Wade (1988) R. Wade, Astrophys. Journal 335, 394-405 (1988).
- Popham & DiStefano (1996) R. Popham, and R. DiStefano, 1996, in Supersoft X-ray Sources, Proceedings of the International Workshop Held in Garching, Germany, 28 February - 1 March 1996, Lecture Notes in Physics, V.472, Edited by J. Greiner, Springer-Verlag, Berlin Heidelberg New York, 1996, p.65.
- Suleimanov et al. (2003) V. Suleimanov, F. Meier, and E. Meier-Hofmeister, Astron. and Astrophys. 401, 1009-1015 (2003).