Nanocrystalline Zr3Al Made through Amorphization by Repeated Cold Rolling and Followed by Crystallization
Abstract
The intermetallic compound Zr3Al is severely deformed by the method of repeated cold rolling. By X-ray diffraction it is shown that this leads to amorphization. TEM investigations reveal that a homogeneously distributed debris of very small nanocrystals is present in the amorphous matrix that is not resolved by X-ray diffraction. After heating to 773 K, the crystallization of the amorphous structure leads to a fully nanocrystalline structure of small grains (10 - 20 nm in diameter) of the non-equilibrium Zr2Al phase. It is concluded that the debris retained in the amorphous phase acts as nuclei. After heating to 973 K the grains grow to about 100 nm in diameter and the compound Zr3Al starts to form, that is corresponding to the alloy composition.
1 Introduction
The intermetallic compound Zr3Al has been of special interest as a nuclear structural material although a drawback of the material is embrittlement under certain irradiation conditions [1]. Recently, it was shown that nanostructuring of materials can enhance the irradiation resistance, e.g. for the intermetallic compound NiTi [2]. One successful method to achieve nanostructuring in bulk materials is severe plastic deformation (SPD). The formation of the nanocrystalline structure can occur directly by grain refinement of the coarse grained material or by crystallization of SPD induced amorphous material. For example, crystallization of the intermetallic alloy NiTi amorphized by severe plastic deformation can lead to nanocrystalline structures and by modification of the deformation path and the heat treatment, properties of the alloy can be tailored [3].
Bulk intermetallic alloys can be deformed severely using high pressure torsion (HPT). For Zr3Al, it was shown that HPT at room temperature leads to a final grain size of approximately 20 nm, but amorphization of a significant volume fraction of the sample has not been encountered [4]. Furthermore, it was observed that upon HPT deformation, Zr3Al exhibits inhomogeneous microstructures, as were also observed in the case of L12 structured Ni3Al [5, 6, 7].
Deformation by cold rolling with intermediate foldings (repeated cold rolling - RCR) is an alternative promising deformation route to produce bulk nanocrystalline materials [8]. The minimum final grain sizes that can be achieved for a material are often smaller than the corresponding ones after SPD under high pressure (e.g. HPT, equal-channel angular pressing) [9]. In addition, RCR can lead to amorphization.
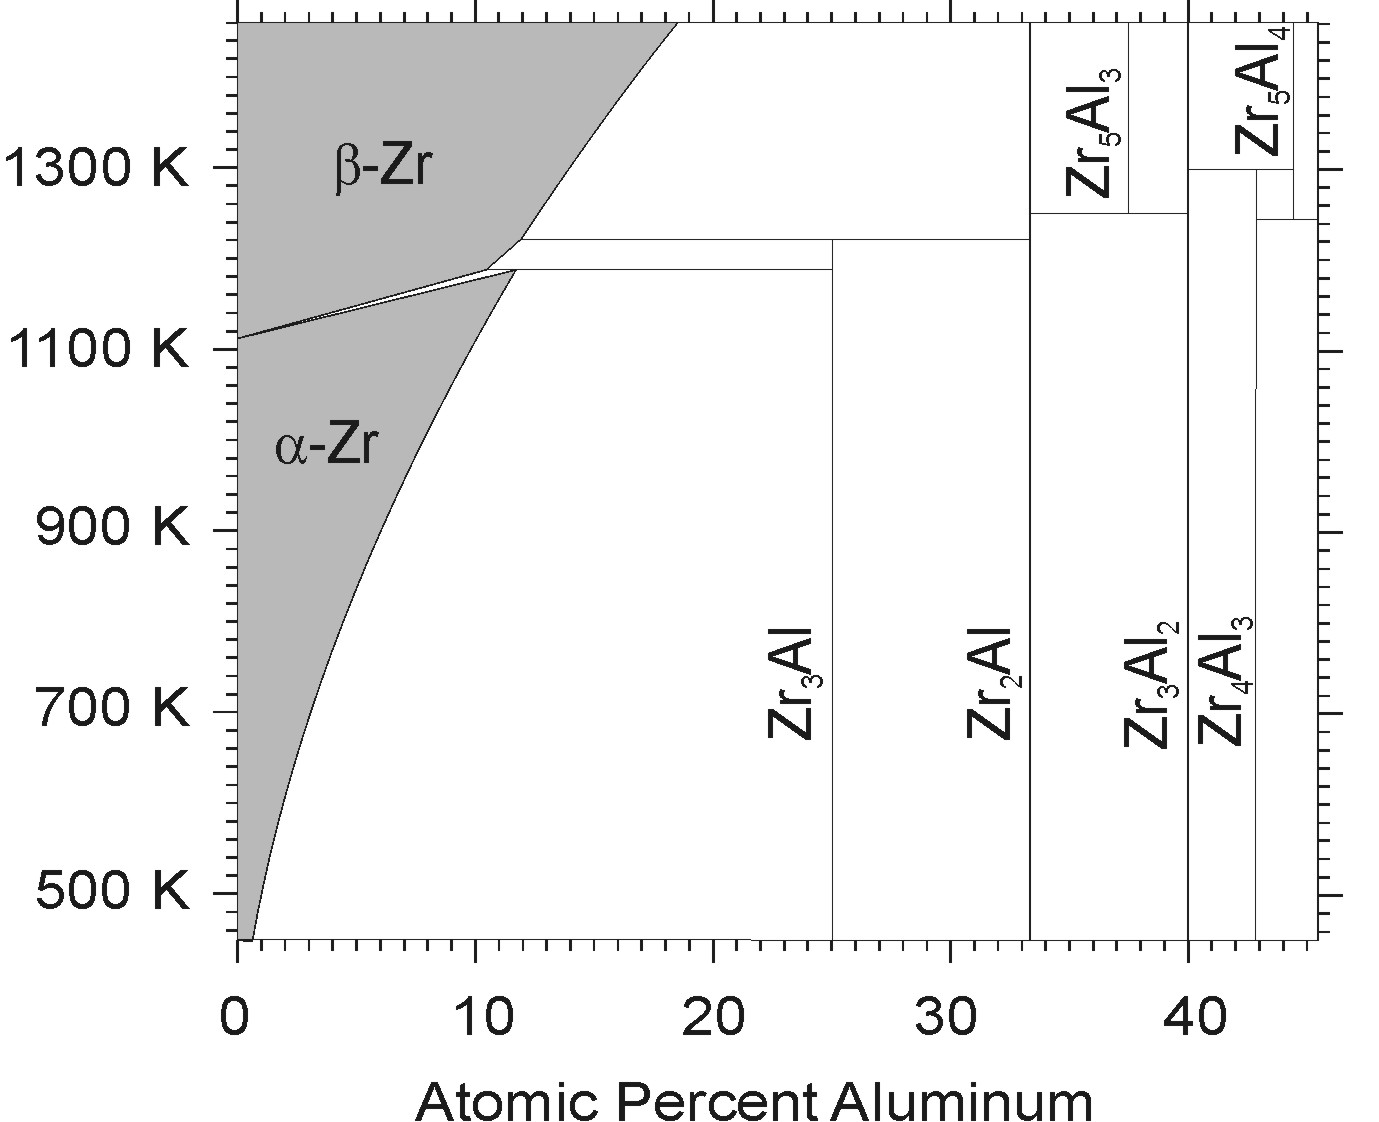
It is the aim of this work to study the effect of RCR on the grain refinement of Zr3Al and the behaviour of the refined material upon heating to different temperatures. Crystallization of the amorphous phase is also of interest since the Zr-Al system exhibits several intermetallic phases (cf. Fig. 1) and the driving force to form the L12 structure was reported to be rather weak compared to the one of neighbouring phases [10].
2 Experimental Procedure
Zr3Al was alloyed with an initial composition of Zr with 27 at.% Al. The alloy was homogenized at 1160 K for 24 h leading to the ordered L12 structure with 10% residual Zr2Al and -Zr. The material was cut to sheets 10mm x 10mm x 0.8mm in size. The thickness of the sheets was reduced to 0.25 mm by repeated cold rolling. Then they were folded and again cold rolled until a thickness of 0.25 mm was achieved. This process was repeated up to 80 times. During rolling the alloy was placed between two spring steel plates.
The deformed material with the highest strain (80 foldings, ) was heated to different temperatures at different heating rates in a differential scanning calorimeter (DSC). For the baseline subtraction, the material was kept at the maximum temperature after heating until the exothermic signal was negligible to avoid exothermic processes in the subsequent run that provided the baseline.
Undeformed samples, samples deformed for 80 foldings and samples heated to 773 K and 973 K at 20 K min-1 after deformation for 80 foldings were investigated by X-ray diffraction (XRD) and transmission electron microscopy (TEM). The XRD data were analysed to get information about the coherently scattering domain (CSD) size and the crystal structure of the samples.
The TEM preparation was done by cutting disks suitable for TEM preparation from samples of different states, subsequent grinding and dimpling and finally electropolishing using the same parameters as described in [12]. Acceleration voltages of 200 kV and 300 kV were used for conventional TEM and high-resolution TEM, respectively.
3 Experimental Results
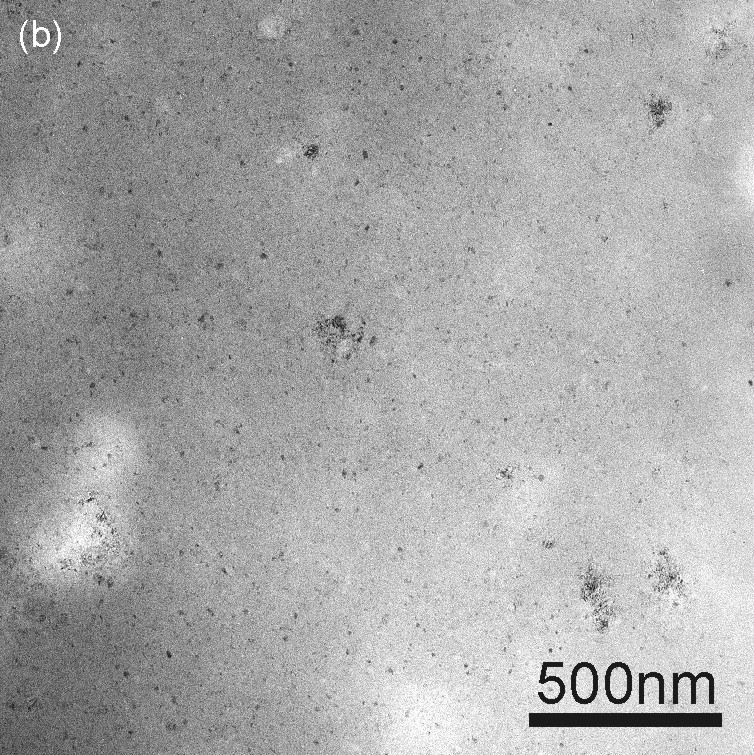
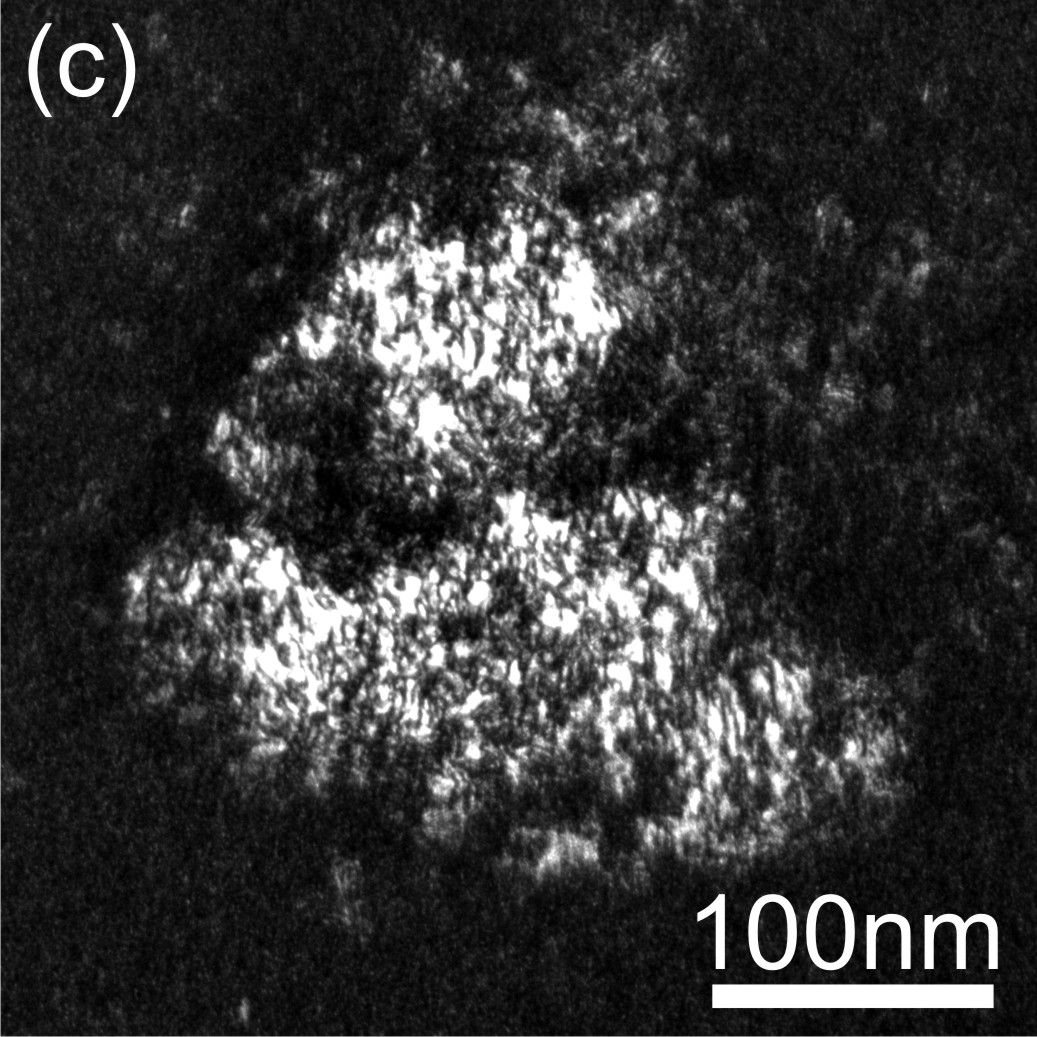
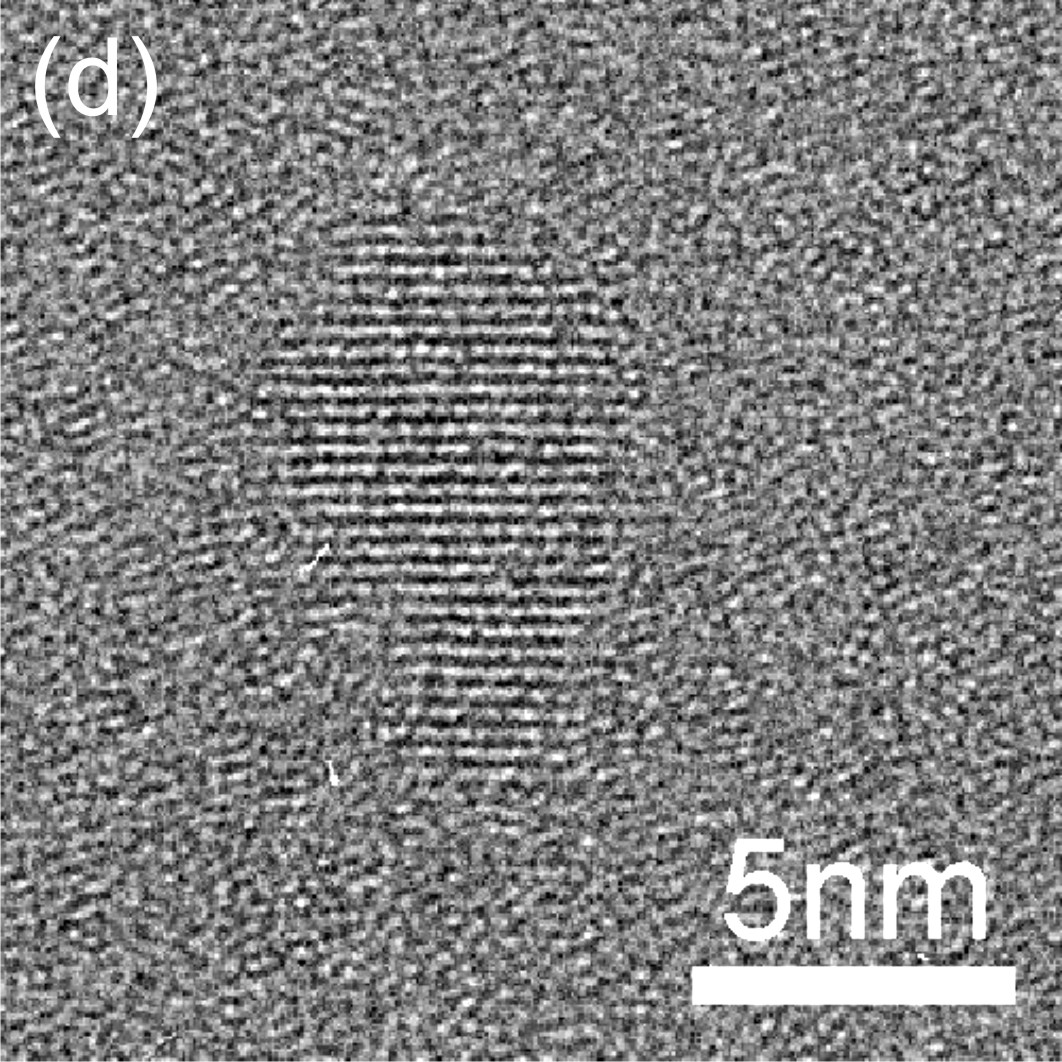
TEM analysis of samples deformed for 5, 10 and 20 foldings reveals that already at these relatively low strains (, , ), grain refinement is clearly visible. At 80 foldings (), XRD shows two broad peaks (cf. Fig. 2a) indicating an amorphous sample. Complementary TEM images taken of the same material yield additional important information (cf. Fig. 2b): a mostly homogeneous intensity distribution with a few remaining crystalline regions that are 100 to 200 nm in diameter (Fig. 2c). From dark-field images, it can be seen that the whole crystalline region is oriented in a similar way, so it is rather one crystallite than an agglomeration of many small crystallites. The complex contrast is an indication for a very high defect density in the crystallite. In addition, small crystallites were identified using high-resolution TEM in the amorphous matrix (Fig. 2d); they show up as dark dots in Fig. 2b (The large ( 500 nm) roundish bright areas originate from thickness variations in the TEM foil developed as an artifact during electropolishing.). Combining the XRD and TEM results, a small crystalline volume fraction of a few percent in a mostly amorphous sample was identified as the sample structure after 80 foldings.

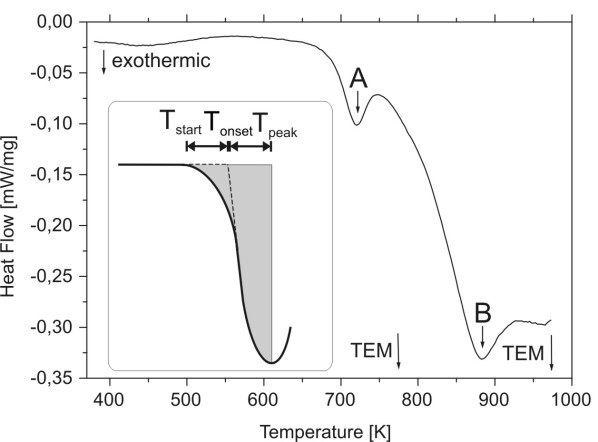
DSC experiments were conducted to clarify the thermal stability of the as-deformed material. Fig. 3 shows a baseline-subtracted DSC curve for a heating rate of 5 K min-1. The baseline was obtained by a second run after annealing at 973 K for 30 min. Two exothermic peaks are revealed. The first peak (peak A) that starts at 650 K and has its maximum at 720 K is caused by crystallization of the amorphous phase. To determine the enthalpy of peak A, the following method (cf. inset in Fig. 3) was chosen under the assumption that the peak is symmetric and that peak B has a negligible influence on the low-temperature half of peak A: From the left integration limit ( was determined using the tangent method), the enthalpy between a horizontal baseline and the DSC curve was integrated until (grey area in inset in Fig. 3). This value was taken as the enthalpy of the low-temperature half of the enthalpy of the peak. Due to the above-mentioned assumptions, doubling this value yields the total enthalpy of the peak. The determination of the enthalpies for four different heating rates yielded a crystallization enthalpy of 3 J/g. This statistical uncertainty, however, seems to underestimate the real one, that might be as high as 20%, due to systematic instrumental errors and the assumption of peak B not having an influence on the low-temperature half of peak A. A Kissinger plot using the four different heating rates ranging from 5 K min-1 to 50 K min-1 leads to an activation enthalpy of eV. The second exothermic peak with a plateau-like behaviour at high temperatures is attributed to a superposition of grain growth and phase transformation processes.
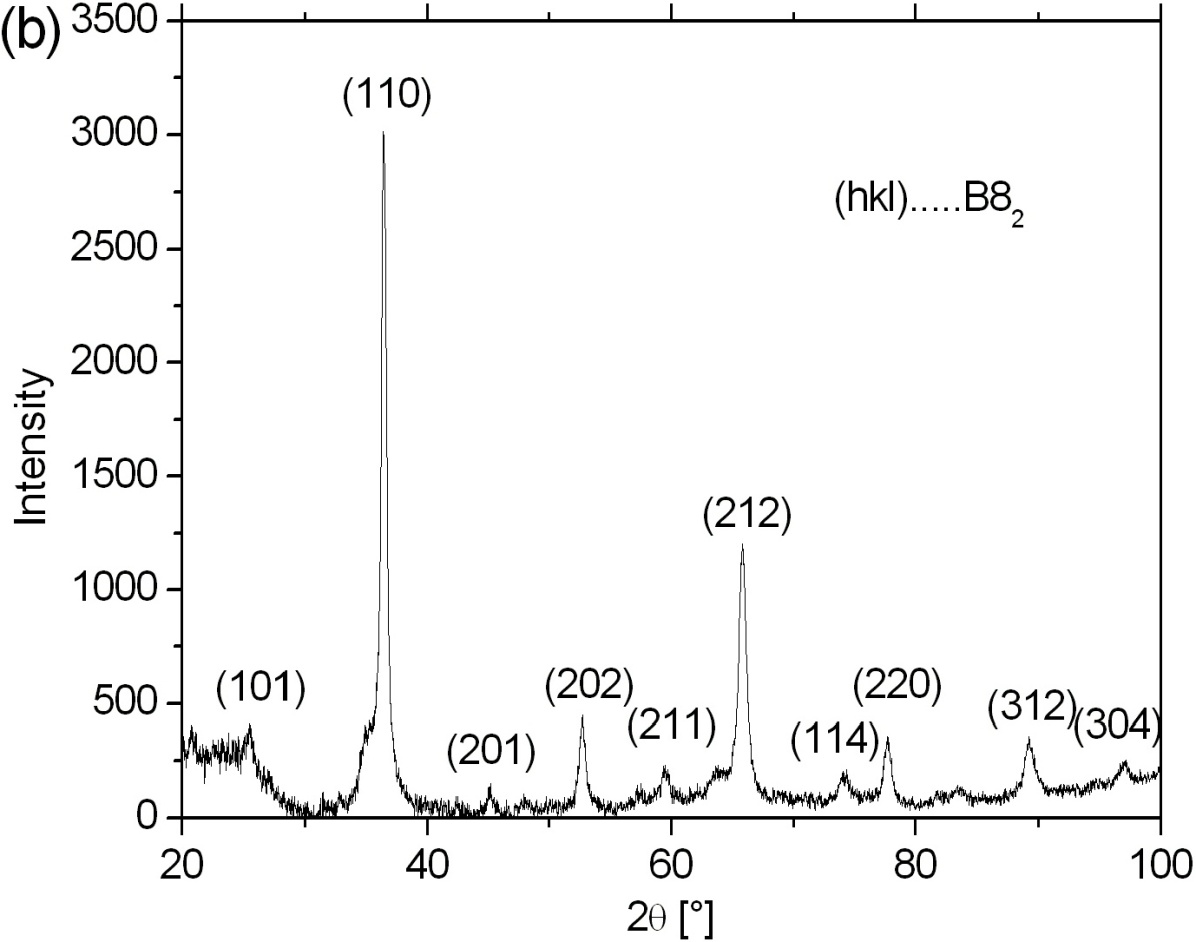
Using a heating rate of 20 K min-1, samples were heated to 773 K and to 973K, i.e. after the crystallization peak and to the maximum temperature of the DSC curve, respectively. Fig. 4a shows a TEM bright-field image of the sample heated to 773 K revealing nanocrystalline material with a grain size of approximately 10-20 nm.
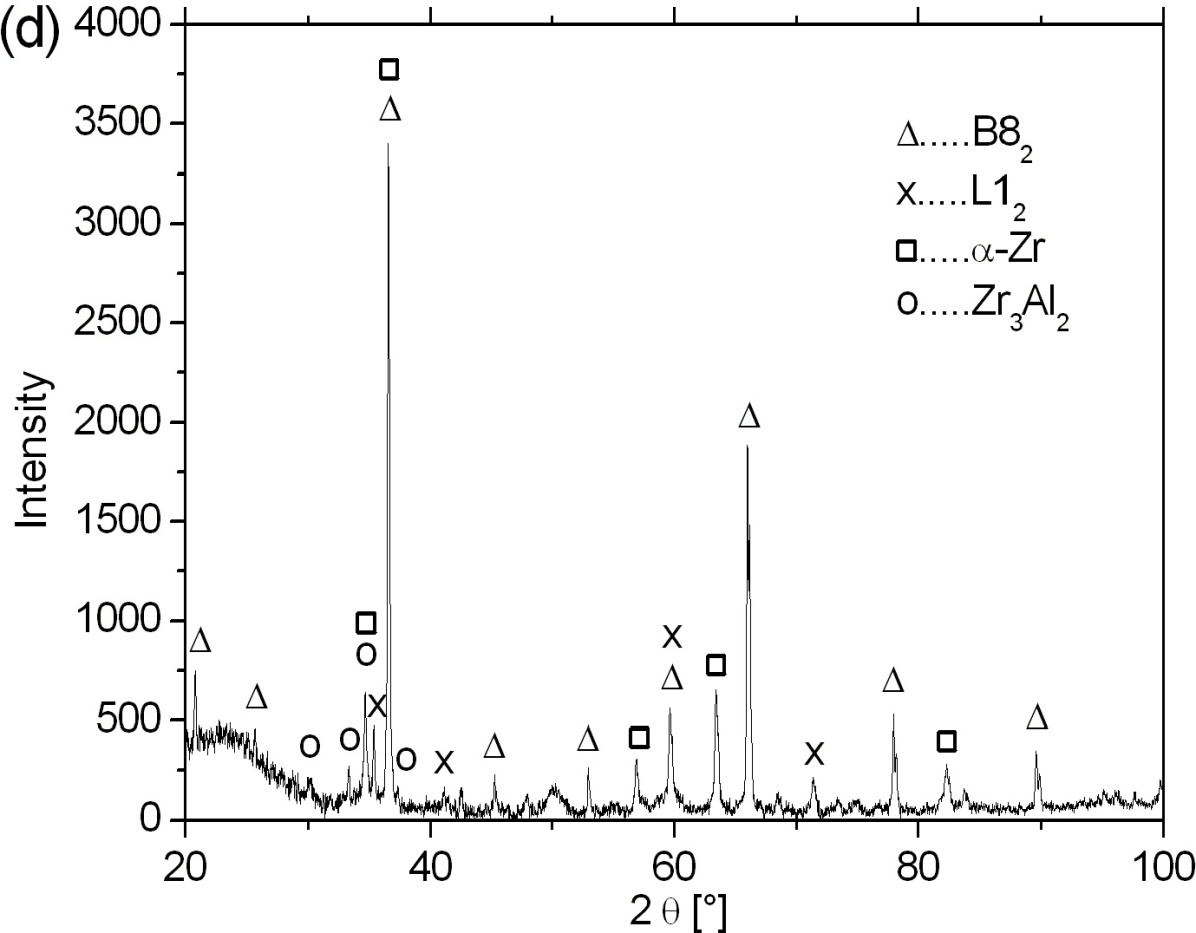
This grain size estimation is in reasonable agreement with a Williamson-Hall analysis of the CSD size as deduced from the corresponding XRD spectrum (cf. Fig. 4b) yielding a volume-weighted mean crystalline diameter of 40 nm. Apart from the CSD size, the XRD results show that the B82-structure is clearly predominant in the sample heated to 773 K. All the major peaks can be related to peaks of this structure, which is the equilibrium phase for Zr2Al [13]. This result was also confirmed by analyzing the corresponding electron diffraction ring patterns using the PASAD software [14]. After heating the sample to 973 K, defect-free grains grow to a size of 100 nm as observed in the TEM bright-field image (cf. Fig. 4c). The corresponding XRD curve (cf. Fig. 4d) shows that the L12 structure (i.e. the equilibrium structure for Zr3Al) starts to form. It should be mentioned that after heating to 973 K at 20 K min-1 and immediate subsequent cooling at the same rate, the B82 structure is still predominant.


4 Discussion
TEM analyses of samples deformed by RCR show that pronounced grain refinement takes place at much lower strain levels than it was reported for Zr3Al deformed by high pressure torsion [4]. After 80 foldings (), at least 90% of the volume is amorphous and the grain structure is finer than that in the HPT experiment. This is in agreement with the results showing that the grain sizes after RCR can be smaller than those achieved by other SPD techniques [9].
As depicted in Fig. 2b, a homogeneously distributed crystalline debris is retained in the amorphous material. Upon heating to 773 K, the crystallites that are only a few nm large can serve as pre-existing nuclei and lead to the formation of a fine nanocrystalline structure (10 - 20 nm, cf. Fig. 4a) because of their dense distribution. A similar behaviour was observed for NiTi, that was rendered amorphous by severe plastic deformation and afterwards heated in in-situ TEM experiments [3]. Peak A of the DSC curve (cf. Fig. 3) is therefore attributed to crystallization and grain growth until impingement. The peak temperature is about 70 K lower than that reported in [10] for ball-milled amorphous Zr3Al. This difference can be explained by the presence of the crystalline debris in our samples. A similar behaviour was observed in NiTi with a peak temperature reduction of 100 K [3]. Therefore, it is concluded that the higher peak temperature reported for Zr3Al in [10] indicates that the material did not contain a crystalline debris. Peak B of the DSC curve (cf. Fig. 3) is interpreted to be caused by grain growth and phase transformations between different intermetallic phases (cf. Fig. 4c and d).
By experimental and theoretical evaluation, Ma et al [15] deduced an enthalpy release caused by devitrification of Zr3Al of 85 J/g, which is about twice the amount that is determined here. Possible reasons for the higher crystallization enthalpy are an additional contribution of grain growth, which is part of DSC peak B (cf. Fig. 3) in this work or a principal difference in the structure of the amorphous samples caused by the different processing conditions (strains, strain rates, deformation temperatures,…)
X-ray results show that the equilibrium L12 structure does not form in the initial crystallization process since only B82 structured Zr2Al was detected after heating to 773 K (cf. Fig. 4b). It is well established that nanocrystalline material can have a different crystal structure than its coarse crystalline counterpart at the same composition and temperature [16, 17]. In the present case, antisites or vacancies on Al sites of the ordered B82 structure could in addition compensate for the difference between the nominal as-cast composition and that of stoichiometric Zr2Al. From the DSC curve, the formation enthalpy of the present B82 structure (containing a high number of point defects causing excess enthalpy) is determined to lie between the one of the amorphous phase and the one of the L12 structure as given in [15]. This makes the transformation path thermodynamically reasonable. A comparison with data of Zr5Al3 and Zr5Al4 favors the substitution with vacancies [18]. Assuming a vacancy density that compensates for the aluminium deficiency in the formation of the B82 structure and ignoring grain size effects causing excess enthalpy gives a reasonable upper limit of 2.7 eV for the formation enthalpy of a vacancy.
After heating to 973 K, the Zr2Al phase is still predominant, but some -Zr, L12 structured Zr3Al and a little Zr3Al2 of the space group P42/mnm starts to form (cf. Fig. 4d).
The heat treatments presented in this work resulted in a very fine nanocrystalline structure dominated by the B82 phase (10 - 20 nm). It is suggested that heat treatment of amorphous samples at low temperatures ( 770 K) for several hours or even days might give rise to the formation of the L12 structure without causing excessive grain growth. It is concluded that the crystalline debris resulting from the amorphization by RCR is important for reducing the grain size of the crystallized material by providing a dense network of homogeneously distributed pre-existing nuclei.
5 Conclusions
-
•
Zr3Al can be rendered amorphous by repeated cold rolling as concluded from the X-ray results. The TEM studies show that the deformed material contains a crystalline debris that is not resolved by X-ray diffraction.
-
•
Heating to 773 K leads to the crystallization of small (10 - 20 nm in diameter) B82-structured nanocrystals. In this nanocrystalline structure, the non-equilibrium Zr2Al phase is clearly predominant.
-
•
It is concluded that during heating, the crystalline debris (of the Zr3Al phase retained in the amorphous phase) acts as nuclei for the crystallization process of the non-equilibrium phase Zr2Al.
-
•
When heating to 973 K, the equilibrium L12 phase starts to form and the crystals grow to a size of about 100 nm.
Acknowledgments
The authors thank Prof. Erland M. Schulson (Dartmouth College, New Hampshire, USA) for the kind provision of Zr3Al. D.G., H.P.K. and C.R. acknowledge support by the research project ‘Bulk Nanostructured Materials’ within the research focus ‘Materials Science’ of the University of Vienna and by the Austrian Science Fund (FWF):[P22440]. D.G. acknowledges the support by the ‘NIMS internship program’ of the National Institute for Materials Science, Tsukuba, Japan and by the IG ‘Experimental Materials Science - Nanostructured Materials’, a college for PhD students at the University of Vienna.
References
- [1] E.M. Schulson. Structural Applications of Intermetallic Compounds, chapter Zr3Al: A Potential Nuclear Reactor Structural Material, pages 137–150. John Wiley & Sons Ltd, 1995.
- [2] A. R. Kilmametov, D. V. Gunderov, R. Z. Valiev, A. G. Balogh, and H. Hahn. Enhanced ion irradiation resistance of bulk nanocrystalline TiNi alloy. Scripta Materialia, 59(10):1027–1030, November 2008.
- [3] M. Peterlechner, T. Waitz, and H. P. Karnthaler. Nanocrystallization of NiTi shape memory alloys made amorphous by high-pressure torsion. Scripta Materialia, 59(5):566–569, September 2008.
- [4] D. Geist, C. Gammer, C. Mangler, C. Rentenberger, and H. P. Karnthaler. Electron microscopy of severely deformed L12 intermetallics. Philosophical Magazine, pages –, 2010.
- [5] C. Rentenberger and H. P. Karnthaler. On the evolution of a deformation induced nanostructure in a Ni3Al alloy. Acta Materialia, 53(10):3031–3040, June 2005.
- [6] O. Ciuca, K. Tsuchiya, Y. Yokoyama, Y. Todaka, and M. Umemoto. Effect of Nanocrystallization and Twinning on Hardness in Ni3Al Deformed by High-Pressure Torsion. Materials Transactions, 50(5):1123–1127, May 2009.
- [7] O. Ciuca, K. Tsuchiya, Y. Yokoyama, Y. Todaka, and M. Umemoto. Heterogeneous Process of Disordering and Structural Refinement in Ni3Al during Severe Plastic Deformation by High-Pressure Torsion. Materials Transactions, 51(1):14–22, January 2010.
- [8] G. Wilde. Synthesis of bulk nanocrystalline materials and bulk metallic glasses by repeated cold rolling and folding (RCR). Materials Science Forum, 579:109–33, 2008.
- [9] G.P. Dinda, H. Rosner, and G. Wilde. Synthesis of bulk nanostructured Ni, Ti and Zr by repeated cold-rolling. Scripta Materialia, 52(7):577 – 582, 2005.
- [10] E. Ma and M. Atzmon. Calorimetric Evidence For Polymorphous Constraints On Metastable Zr-Al Phase Formation By Mechanical Alloying. Physical Review Letters, 67(9):1126–1129, August 1991.
- [11] NIMS Atom Work database (http://crystdb.nims.go.jp/) [accessed 2010-07-01].
- [12] D. Geist, C. Rentenberger, and H. P. Karnthaler. High pressure torsion of intermetallic Zr3Al. Materials Science Forum, 584-586:553–558, 2008.
- [13] T.B. Massalski, editor. Binary alloy phase diagrams. ASM International, 1990.
- [14] C. Gammer, C. Mangler, C. Rentenberger, and H.P. Karnthaler. Quantitative local profile analysis of nanomaterials by electron diffraction. Scripta Materialia, 63(3):312 – 315, 2010.
- [15] E. Ma and M. Atzmon. Enthalpies of Formation and Crystallization of Amorphous Zr1-xAlx and Zr1-xNix Alloys - Calculations Compared With Measurements. Journal of Alloys and Compounds, 194(2):235–244, May 1993.
- [16] M. J. Mayo, A. Suresh, and W. D. Porter. Thermodynamics for nanosystems: grain and particle-size dependent phase diagrams. Reviews on Advanced Materials Science, 5(2):100–9, 2003.
- [17] Q. Jiang and C. C. Yang. Size effect on the phase stability of nanostructures. Current Nanoscience, 4(2):179–200, May 2008.
- [18] R. V. Nandedkar and P. Delavignette. On the formation of a new superstructure in the zirconium-aluminum system. Physica Status Solidi A-applied Research, 73(2):K157–&, 1982.