11email: oliver.butters@star.le.ac.uk 22institutetext: Astrophysics Group, School of Physical and Geographical Sciences, Lennard-Jones Laboratories, Keele University, Staffordshire, ST5 5BG, U.K. 33institutetext: School of Physics and Astronomy, University of St Andrews, North Haugh, St Andrews, Fife, KY16 9SS, U.K. 44institutetext: STScI, 3700 San Martin Drive, Baltimore, MD 21218, U.S.A. 55institutetext: Department of Physics and Astronomy, The Open University, Milton Keynes, MK7 6AA, U.K. 66institutetext: Astrophysics Research Centre, Main Physics Building, School of Mathematics & Physics, Queen’s University, University Road, Belfast, BT7 1NN, U.K. 77institutetext: NASA Exoplanet Science Institue, Caltech, Pasadena, CA 91125, U.S.A. 88institutetext: Las Cumbres Observatory, 6740 Cortona Drive Suite 102, Goleta, CA 93117, U.S.A. 99institutetext: Department of Physics, University of Warwick, Coventry, CV4 7AL, U.K.
The first WASP public data release
The WASP (Wide Angle Search for Planets) project is an exoplanet transit survey that has been automatically taking wide field images since 2004. Two instruments, one in La Palma and the other in South Africa, continually monitor the night sky, building up light curves of millions of unique objects. These light curves are used to search for the characteristics of exoplanetary transits. This first public data release (DR1) of the WASP archive makes available all the light curve data and images from 2004 up to 2008 in both the Northern and Southern hemispheres. A web interface (www.wasp.le.ac.uk/public/) to the data allows easy access over the Internet. The data set contains 3 631 972 raw images and 17 970 937 light curves. In total the light curves have 119 930 299 362 data points available between them.
Key Words.:
Catalogs - Planets and satellites: general - Stars: general1 Introduction
There have been over 450 exoplanets discovered to date, over 60 of these transit their host star111www.exoplanet.eu. The WASP (Wide Angle Search for Planets) project has played a pivotal role in the field by finding almost half of these transiting systems. This has been achieved by the construction of two robotic observatories (one in the Northern hemisphere and the other in the Southern hemisphere) that constantly monitor the night sky. Images are taken simultaneously from eight wide-angle cameras in each case throughout the night.
The first science frames were taken in 2004 and since then well over 200 billion data points have been taken. This forms the basis of the main data product offered here; that of light curves of individual stars. These light curves have been extensively searched for the characteristic signs of transiting exoplanets, and to date over 30 have been found.
The format of the data lends itself to non-exoplanet research also, for example variable star studies (Norton et al. 2007) and single star studies (Collier Cameron et al. 2009). This dataset will therefore be a valuable resource to the wider community of time domain astronomers.
This first public data release (DR1) represents over half of the current total WASP data holdings, and will be followed with further releases covering more of the sky and a longer temporal baseline.
2 The WASP observatories
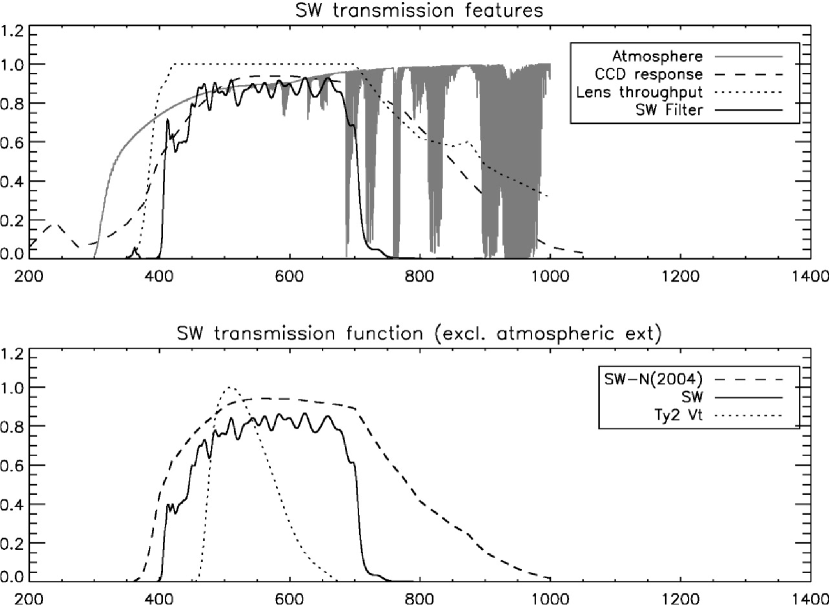
The WASP observatories consist of two identical robotic telescopes, one located at the Observatorio del Roque de los Muchachos on La Palma, the other at the South African Astronomical Observatory (Pollacco et al. 2006; Wilson et al. 2008). Each telescope has eight lenses (Canon 200mm f/1.8) feeding a 20482048 thinned CCD with a pixel size of 13.5m. This gives a field of view of 7.87.8 degrees (61 sq. degrees) per camera and an angular scale of 13.7′′ pixel-1. The cameras are fixed relative to one another on an equatorial mount. In 2004 the light was unfiltered - the spectral transmission essentially being defined by the optics, detectors and the atmosphere. From 2006 onwards a broadband filter was installed with a passband from 400 to 700 nm (see Fig. 1).
Each night calibration frames are taken at the beginning and end of the night, then the exoplanet survey runs throughout most of the rest of the night. The observing strategy is optimised to cycle through 6-8 fields at a similar declination and spaced apart by approximately one hour in right ascension each night. This strategy is altered somewhat to avoid crowded fields close to the Galactic plane. Two exposures are taken of each field (each 30 seconds) then the telescope slews to the next field (taking approximately 30 seconds), so each field is sampled every 9-12 minutes. Twice per night the exoplanet survey is interrupted to perform a full sky survey, a process that takes approximately 40 minutes.
The raw images are processed by Queen’s and Keele Universities (North and South data respectively) using a custom built pipeline (see Kane et al. (2004) and Pollacco et al. (2006)). The final result of this analysis is a photometric measurement of each object in each image. This data is then ingested into the main archive hosted at the University of Leicester, where it is subject to high-level analysis, such as de-trending, and searched for exoplanet signatures.
The data reduction pipeline is catalogue driven and backed by the USNO-B1.0 catalogue (Monet et al. 2003). Each object extracted from the images has its position matched against the catalogue, when a match is found it is ingested into the main archive, when it is not it is ingested into a separate part of the archive. The sources that were successfully matched against the USNO-B1.0 catalogue are the ones available here, so transient sources are therefore unlikely to be seen in this data release. More details about the pipeline can be found in Pollacco et al. (2006).
3 Data summary
This release has 3 631 972 raw science images available for download. From these images 17 970 937 unique objects have been catalogued with 119 930 299 362 data points between them.
Spatially, the data from the Northern hemisphere cover the sky north of +20 deg and south of +66 deg, in the Southern hemisphere it is south of 20 deg almost to the pole. Temporally the data begin in the North on the 2nd May 2004 and go through to the 9th August 2008, in the South the data range from 13th February 2006 to 27th May 2008 (see Table 1).
| Number of unique objects | 17 970 937 |
|---|---|
| Number of raw science images | 3 631 972 |
| Number of flat field frames | 257 267 |
| Number of bias frames | 119 175 |
| Number of thermal frames | 71 302 |
| Number of data points | 119 930 299 362 |
| Average number of data points per light curve | 6674 |
| Maximum number of data points | 74 013 |
| Light curve disk space | 5.0 TB |
| Raw science image disk space | 14.5 TB |
| Raw calibration image disk space | 1.6 TB |
| Start date (North) | 2/5/2004 |
| End date (North) | 9/8/2008 |
| Longitude (North) | 17:52:45 |
| Latitude (North) | 28:45:37 |
| Minimum declination (North) | +20 |
| Maximum declination (North) | +65.86 |
| Start date (South) | 13/2/2006 |
| End date (South) | 27/5/2008 |
| Longitude (South) | 20:48:38 |
| Latitude (South) | 32:22:51 |
| Minimum declination (South) | 20 |
| Maximum declination (South) | 89.07 |
4 Data products
4.1 Light curves
The main data product is that of light curves of individual objects. Each individual light curve is stored in binary FITS table format. Some of these have data spanning back to 2004 while others may have just one seasons data. The average number of data points in the light curves is 6600, while some have more than 70 000 (see Fig. 2 and Table 1).
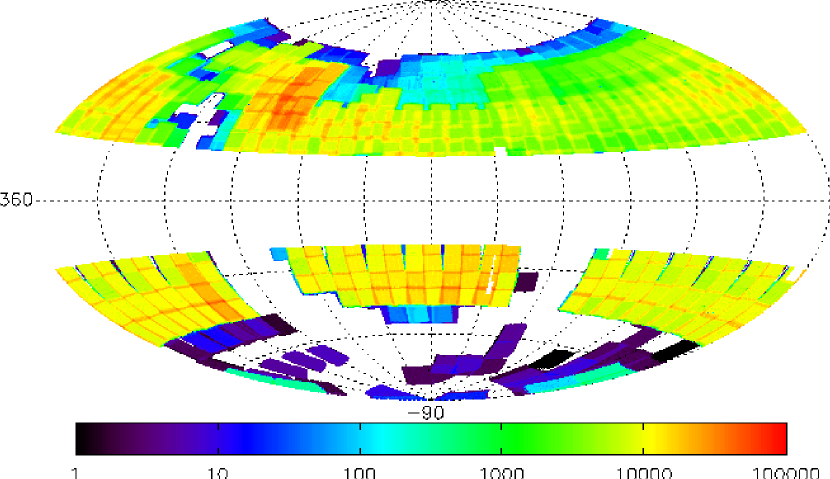
Table 2 lists the columns in the light curve FITS file. Each row corresponds to a data point in the light curve and is the result of aperture photometry of the images by the pipeline, as described in Kane et al. (2004). This results in a processed flux measurement (FLUX2) of each object from each image. Further to this flux, a TAMUZ corrected flux is given, which gives a more consistent measurement between different cameras and years (Collier Cameron et al. 2006, (Cameron refers to the TAMUZ correction as SYSREM)). Fig. 3 has an example of a TAMUZ corrected light curve of WASP 1 constructed from the data available here.

Also included in the light curve data are the position of the object on the CCD, the unique image ID that the data point was derived from, and a flag to indicate if a TAMUZ correction has been made or not. The TAMUZ flag is a bit-mask; if the correction has been made then this will be 32, if it is zero then the TAMUZ flux and error will be a copy of the FLUX2 values.
TMID is the heliocentrically corrected mid-point of the exposure in seconds after 2004-01-01T00:00:00, and can be converted to HJD using
| (1) |
Along with the basic photometry, additional meta-data can be requested, for each data point this is added to the light curves on the fly. These include the airmass and general weather conditions (see Table 2).
| Name | Unit | Description |
| Stored in the light curves on disk | ||
| TMID | sec | Mid-time of exposure |
| FLUX2 | micro Vega | Processed flux |
| FLUX2_ERR | micro Vega | Processed flux error |
| TAMFLUX2 | micro Vega | TAMUZ corrected processed flux |
| TAMFLUX2_ERR | micro Vega | TAMUZ flux error |
| CCDX | 1/16th of pixel | X position on the CCD |
| CCDY | 1/16th of pixel | Y position on the CCD |
| IMAGEID | – | Unique image ID |
| FLAG | – | Bitmask |
| Added to the light curves on the fly (if requested) | ||
| AIRMASS | – | Airmass |
| ZENDIST | degrees | Zenith distance |
| MOONALT | degrees | Degrees above horizon |
| MOONDIST | degrees | Degrees from image centre |
| MOONPHAS | % of full moon | Moon phase |
| WXTIME | YYYY-MM-DD HH:MM:SS | Time the weather data was taken |
| WXTEMP | degrees C | Ambient air temperature |
| WXPRES | milliBars | Atmospheric pressure |
| WXWNDSPD | kph | Wind speed |
| WXWNDDIR | degrees E of N | Wind direction |
| WXHUMID | % | Outdoor humidity |
In both the flux cases the units are given as micro Vegas, this gives a simple conversion to magnitude given by
| (2) |
where is in micro Vegas. This implies a flux of 1.0 micro Vega corresponds to 15th mag, and micro Vegas; 0th mag. An average magnitude is calculated for each object by cutting the flux at four sigma from the median then taking the mean.
The nomenclature used for the target names is 1SWASP Jhhmmss.ssSddhhmmss.s, every source follows this naming convention and is therefore the unique identifier used.
4.2 Images
4.2.1 Science frames
The raw science images are also offered as a data product, these are stored in FITS image format. Each image is 20482048 pixels with a field of view of 7.87.8 degrees and has an exposure time of 30 s. The naming convention of the images is three digits corresponding to the CCD number followed by the date and time.
WCS meta-data is stamped into the image headers by the astrometry part of the main reduction pipeline. There are however two main instances where this is not the case. Early in pipeline development this information was not logged, so some of the 2004 data are missing this information. The pipeline assesses the quality of each image before processing it, some images are therefore rejected by the pipeline at this stage due to e.g. satellite trails. Since this will not affect the whole image we have chosen to leave these images in the public archive.
4.2.2 Calibration frames
The calibration frames are also available for download to allow the reduction of the raw images. These are taken at dusk and dawn most nights. If the weather conditions are bad at dusk and dawn on a given night, it is possible that science frames will be available, but no calibration frames will be present.
The calibration frames follow the same naming convention as the science frames, but can be distinguished by the IMGTYPE keyword in the header.
4.3 Version control
As the archive evolves the software used to extract and serve the data will likely be developed further. Since some of the data undergoes on-the-fly processing as it is served, software development may alter the final data products. To keep track of this the headers of the FITS files keep a record of what piece of software has edited it and when. A version log of the software on the web pages can then be used to see if software upgrades have affected the science data.
5 The interface
All the data is available via a simple web based interface at www.wasp.le.ac.uk/public/.
5.1 Light curves
These can be found by querying a region of the sky with a specified R.A. and declination, along with a magnitude range and a minimum number of data points. This returns a list of all the objects close-by, along with their position, magnitude and the number of data points. Individual light curves can be downloaded, or multiple light curves selected and downloaded as a single operation.
The extra meta-data in Table 2 can be added to individual light curves on-the-fly at this stage, however, this is a complex process and slows the retrieval process significantly.
Individual light curves have unique URLs which are made up of concatenating the object name with www.wasp.le.ac.uk/public/, so e.g. 1SWASP J002040.07+315923.7 can be retrieved via www.wasp.le.ac.uk/public/1SWASP J002040.07+315923.7.fits.
5.2 Science and calibration images
The science images can be queried in a similar way to the light curves and a region of the sky searched. Since the image locations are indexed on the centre of the image, a search radius of 5.52 degrees (the diagonal length of the image) is used. The science images can also be queried with a light curve object ID, this allows all of the images that were used to generate a light curve to be found and downloaded.
In an analogous way to the light curves, the raw images have unique URLs, e.g. image 103200405270502090 can be retrieved via www.wasp.le.ac.uk/public/103200405270502090.fits.
The availability of the calibration images is summarised in table format, which allows nightly or monthly downloads on a per camera basis.
5.3 Virtual observatory
An index of the the light curve data is available in the virtual observatory with the title ‘1SWASP_LIGHTCURVES: SuperWASP lightcurves DR1’ published by LEDAS222www.ledas.ac.uk. This allows cross-correlation with other catalogues and the easy retrieval of data products which can then be analysed with the standard virtual observatory tools.
6 Conclusion
This first data release (DR1) of the WASP archive has over 3.5 million images and almost 18 million light curves covering a large fraction of the sky. All of this is readily available for download from the web interface (www.wasp.le.ac.uk/public/) or in the virtual observatory.
Over the coming years, as the data set grows, more data will be added to the public archive covering a larger part of the sky and with a longer temporal baseline.
Acknowledgements.
The WASP Consortium consists of astronomers primarily from the Queen’s University Belfast, Keele, Leicester, The Open University, St Andrews, the Isaac Newton Group (La Palma), the Instituto de Astrofisica de Canarias (Tenerife) and the South African Astronomical Observatory. The WASP-N and WASP-S Cameras were constructed and are operated with funds made available from Consortium Universities and the UK‘s Science and Technology Facilities Council.References
- Collier Cameron et al. (2009) Collier Cameron, A., Davidson, V. A., Hebb, L., et al. 2009, MNRAS, 400, 451
- Collier Cameron et al. (2006) Collier Cameron, A., Pollacco, D., Street, R. A., et al. 2006, MNRAS, 373, 799
- Kane et al. (2004) Kane, S. R., Collier Cameron, A., Horne, K., et al. 2004, MNRAS, 353, 689
- Monet et al. (2003) Monet, D. G., Levine, S. E., Canzian, B., et al. 2003, AJ, 125, 984
- Norton et al. (2007) Norton, A. J., Wheatley, P. J., West, R. G., et al. 2007, A&A, 467, 785
- Pollacco et al. (2006) Pollacco, D. L., Skillen, I., Cameron, A. C., et al. 2006, PASP, 118, 1407
- Wilson et al. (2008) Wilson, D. M., Gillon, M., Hellier, C., et al. 2008, ApJL, 675, L113