Solar physics Stellar activity Other topics in statistical physics, thermodynamics, and nonlinear dynamical systems
Nonextensivity in the solar magnetic activity during the increasing phase of solar Cycle 23
Abstract
In this paper we analyze the behavior of the daily Sunspot Number from the Sunspot Index Data Center (SIDC), the mean Magnetic Field strength from the National Solar Observatory/Kitt Peak (NSO/KP) and Total Solar Irradiance means from Virgo/SoHO, in the context of the –Triplet which emerges within nonextensive statistical mechanics. Distributions for the mean solar Magnetic Field show two different behaviors, with a –Gaussian for scales of 1 to 16 days and a Gaussian for scales longer than 32 days. The latter corresponds to an equilibrium state. Distributions for Total Solar Irradiance also show two different behaviors (approximately Gaussian) for scales of 128 days and longer, consistent with statistical equilibrium and –Gaussian for scales 128 days. Distributions for the Sunspot Number show a –Gaussian independent of timescales, consistent with a nonequilibrium state. The values obtained (“–Triplet”stat,sen,rel) demonstrate that the Gaussian or –Gaussian behavior of the aforementioned data depends significantly on timescales. These results point to strong multifractal behavior of the dataset analyzed, with the multifractal level decreasing from Sunspot Number to Total Solar Irradiance. In addition, we found a numerically satisfied dual relation between and .
pacs:
96.60.-jpacs:
97.10.Jbpacs:
05.90.+m1 Introduction
One of the most important characteristics of solar magnetic activity is its periodic and quasiperiodic variations at different timescales. These cyclic phenomena include the sunspot cycle with a mean period of 11 years and 152–158 day periodicity observed in the occurrence of high-energy solar flares. Explaining their root-cause has become a puzzling question in solar physics. However, studies on the cyclic behavior of the Sun’s large scale magnetic field have provided important information about different solar physical processes. Oliver et al. [1] established that 158–day periodicity in sunspots and high-energy solar flares are related to a periodic emergence of magnetic flux that appears near the maxima of some solar cycles. More recently, Knaack et al. [2] provided evidence for a variety of quasi-periodic oscillations in the solar photospheric magnetic field ranging from 24 days to 22 years.

The statistical properties of solar magnetic activity have been investigated by different authors in the context of chaos theory [3], multifractal analysis [4], and nonextensive statistical mechanics [5, 6]. The Tsallis’ nonextensive theory is a generalization of Boltzmann-Gibbs statistical mechanics (B-G statistics) for out of thermal equilibrium systems, described by the entropic index ( in the B–G statistics; for further details: [7, 8, 9]). It has been successfully applied to many complex physical systems as solar magnetic activity [5, 6], including different astrophysical data presenting nonlinear and nonstationary behavior and nonequilibrium states. Tsallis [10] recently proposed the existence of a three-index set (qstat,qsen,qrel), also known as -Triplet, characterized by metastable states in nonequilibrium, where 1, 1 and 1. When (qstat,qsen,qrel)=(1,1,1), the set denotes the B–G thermal equilibrium state. Burlaga and Viñas [5] used a generalized Tsallis probability distribution function to describe the multiscale structure of fluctuations in solar wind speed and the magnetic field during the declining phase of solar cycle 23. More recently, these authors presented the first physical corroboration of the –Triplet, from the analyses of the behavior of two sets of daily magnetic field strength observed by Voyager 1 in the solar wind in 1989 and 2002 [11].
, where =0,1,2,…,7.
The magnetic activity on the solar atmosphere is by far more complex than such a simplified description, and a variety of dynamical phenomena are expected, such as fluctuations of the magnetic field and variability of the solar indices [12]. This solar magnetic activity is a driven nonlinear non-equilibrium system. These properties can represent a hierarchical structure in phase space, in contrast to the expected behavior for B–G statistical mechanics (i.e., uniformly occupied phase space).
The main aim of this study is to perform an analysis of the behavior of physical parameters directly reflecting the solar magnetic activity in the context Tsallis –Triplet’s formalism, and to compare the properties of this –Triplet with those expected for a metastable or quasi-stationary dynamical system described by nonextensive statistics. The physical parameters analyzed are the solar indices: (i) Sunspot Number, (ii) Magnetic Field strength and (iii) Total Solar Irradiance, measured from observations carried out between 1996 and 2001. These three datasets offer a unique possibility to analyze the relationship between the number of solar indices (e.g., sunspots and magnetic flux) and the nonequilibrium level, the degree of complexity, as well as the relaxation process, in solar activity diagnostics. The present analysis offers also a possibility for a check of the validity of –Central Limit Theorem, the so-called –CLT, recently conjectured by Umarov, Tsallis and Gell–Mann [13], in the context of physical sub–systems as those associated to the solar magnetic activity.
2 Data and Methods
Three diagnostics of solar magnetic activity were selected for this study: (i) daily international Sunspot Number (SN) from the Sunspot Index Data Center (SIDC); (ii) daily full-disk measurements of mean line-of-sight component of unsigned Magnetic Field strength (MF) from the National Solar Observatory/Kitt Peak (NSO/KP). These data do not cover the overall period (20% are missing). These temporal gaps are reconstructed by linear interpolation of the daily values; and, (iii) daily means of Total Solar Irradiance (TSI) from Virgo/SoHO data. Observations cover the period January 1996 (cycle minimum) to September 2001 (cycle maximum). This time interval corresponds to the increasing phase of cycle 23, which reached its maximum around 2001, thereafter declining until December 2007. At present, the Sun is known to be in solar activity Cycle 24. According to De Toma et al. [14] cycle 23 is magnetically weaker and simpler than its immediate predecessors, 21 and 22. Figure 1 shows the variability in three solar activity indices in this phase of cycle 23, SN and MF (without interpolation) and TSI.
Virgo/SoHO data reveal the intrinsic variability of the Sun: from a few seconds up to the 11-year cycle. Lanza et al. [15] pointed out that different contributions affect variations of TSI: (i) shorter timescales (2 days), associated to active regions (solar micro-variability); (ii) longer timescales associated to active region evolution up to about 30 days (rotational modulation period), up to periodicities of 200 days; (iii) timescales longer than 200 days; and, (iv) very long timescales associated to an 11–year activity cycle. We are interested in scales between 1 and 200 days. NSO/KP data are average values over the full solar disk, where several solar indices can contribute to its variation, such as, sunspots, faculae or plages, whereas SIDC data are a measure of the general state of solar magnetic activity. According to De Toma et al. [14], TSI variability during the increasing phase of cycle 23 may be due to magnetic flux emergence in these indices.
2.1 Determination of the –Triplet
For time series , fluctuations of increments due to its variability over timescale is given as , where is the scale parameter defined as that determines the scale of fluctuations represented by and 0, 1, 2, … and so on. This method has been used to describe magnetic field fluctuations due to solar wind on a large scale range [11, 6].
Burlaga and Viñas [5] pointed out two factors to consider when analyzing a complex multiscale system such as the solar magnetic activity on from 1 hour to 1 year: (i) mechanical properties that differ at different scales and (ii) the statistical probability structures of fluctuation components in the series at the several scales. A natural method for analysis of these structures is statistical mechanics. Two main procedures are mentioned in the literature. One of these is the well-known B–G statistical mechanics and the other Tsallis statistics. For systems studied using nonextensive statistical mechanics according to Tsallis statistics, energy probability density function, sensitivity to the initial conditions and relaxation are described by three entropic indices , , and . These are referred to as the -Triplet [10, 11]. The present study applies the same procedure used by Burlaga and Viñas [11] to compute the –Triplet from Voyager 1 data.
The values of are derived from Probability Distribution Functions (PDFs), defined as
| (1) |
where the coefficients , denote the normalization constants and the functions of scale . This entropic index is related to the size of the tail in the distributions [6]. Our study uses the Levenberg–Marquardt method [16, 17] to compute the PDFs with symmetric Tsallis distribution from Equation (1).
The values of can be obtained from the multifractal (or singularity) spectrum , where is the singularity strength or Hölder exponent. Spectrum is derived via a modified Legendre transform, through the application of the MF-DFA5 method [18]. This method consists of a multifractal characterization of nonstationary time series, based on a generalization of the detrended fluctuation analysis (DFA). The –index denotes sensitivity at initial conditions. For the present purposes, we used the expression defined by Lyra and Tsallis [19] for the relation between and multifractality in dissipative systems:
| (2) |
where and denotes the roots of the best-fit.
The value of , which describes a relaxation process, can be computed from a scale-dependent correlation coefficient defined by
| (3) |
and for Tsallis statistics
| (4) |
where the slope is given by
| (5) |

3 Results
Our results are presented in three subsections, each one associated to the properties of one of the ’s.

3.1 On the behavior of Probability Distribution Functions as a function of scale: the –index
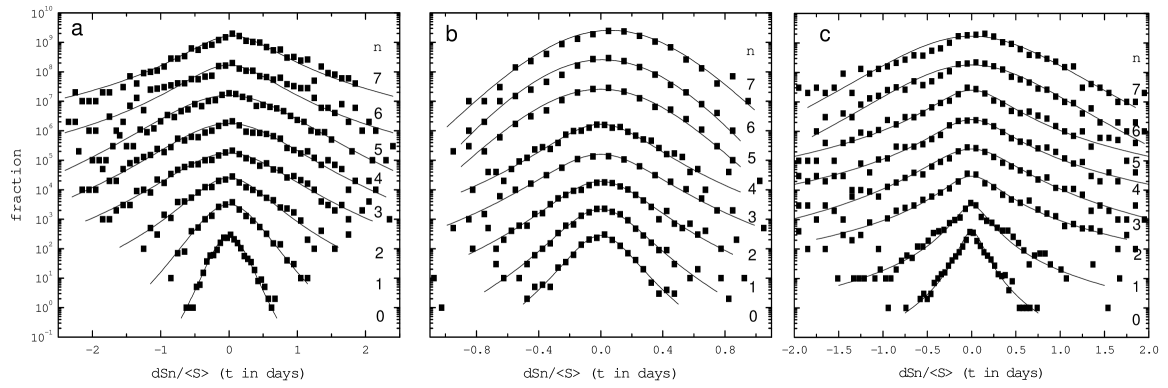
PDFs of the signal were calculated to quantitatively characterize the stochastic process observed. The signal represents the SN, MF and TSI data for a timescale ranging from 1 to 128 days.
PDFs for the three datasets are shown in Figure 2. The behavior of the PDFs entropic index changes as a function of scale is clear. Distributions for the SN shown in Figure 2(a) demonstrate –Gaussian behavior independent of timescales, which corresponds to a nonequlibrium state. However, for the MF the distributions in Figure 2(b) show two different behaviors. A –Gaussian is observed for scales of 1 to 16 days and a Gaussian for scales larger than 32 days. The latter corresponding to an equilibrium state. In relation to the TSI shown in Figure 2(c), distributions are approximately Gaussian at scales of 128 days and higher, consistent with statistical equilibrium, but are non-Gaussian with long tails and inflection points on scales 128 days.
Differences between the PDFs of the dataset analyzed can also be quantitatively expressed from the nonextensivity –index values. Figure 3 illustrates the behavior of the –index distribution as a timescale function, derived from fits of the PDFs in Figure 2. In the NSO/KP data, for timescales less than approximately 16 days the value for 1.3 is relatively constant. However, in scales larger than around 32 days, 1. This is consistent with Gaussian behavior and a lack of correlation. For the Virgo/SoHO data, 1.65, at the average, for scales shorter than about 32 days. This is consistent with the value of 1.75 expected for nonlinear systems, where the random variable is a sum of strongly correlated contributions [11, 6, 20]. In this context, nonextensivity is consistent in the following aspect: Virgo/SoHO data is an overlap of several solar indices, such as magnetic activity (flares, sunspots, faculae and plages) and rotational modulation [21, 23, 22, 15]. At the largest scales decreases and reaches a minimum value of 1, which is also consistent with Gaussian behavior and lack of correlation.
In contrast to the data from NSO/KP and Virgo/SoHO, the –index from SIDC data shows a relatively anomalous behavior, with 1.3 at scales shorter than about 32 days and increasing to maximum value of 1.6 at 128 days. In this case, we found that SN shows an out of equilibrium behavior at timescales larger than about 128 days. As mentioned by Kiyono et al. [24], due to the central limit theorem, Gaussian PDFs at sufficiently long scales are generally expected, owing to the accumulation of uncorrelated variations. Nonetheless, Tsallis [10] pointed out that during the metastable or quasi-stationary state, the timescales of an equilibrium stationary state can be reached, in many cases, infinitely later.
3.2 On the behavior of multifractal spectra : the –index
The multifractal spectra were obtained following a procedure based on the MF-DFA5 method, as mentioned in the Section Data and Methods. The multifractal characterization of these data is shown in Figure 4. These spectra calculated for datasets shows a wide Hölder exponent interval, with =0.810.08 and =1.540.04 for the SIDC data, = 0.710.04 and = 1.400.04 for the NSO/KP data and = 0.710.03 and = 1.330.07 for Virgo/SoHO data. For the broadness of the multifractal spectrum =, we obtained 0.73, 0.69 and 0.62 for the daily SN, MF and TSI, respectively. This behavior denotes the range of fractal exponent present in the time series and thus gives a measure of the degree of multifractality of complexity [25]. These results point to a strong multifractal behavior with the multifractal level decreasing from SIDC to Virgo/SoHO data.
Additional parameters can be derived from the multifractal spectrum, providing information about the fractal properties as, for exemple, an asymmetry in the shape of the . Different authors (e.g.: [26]) pointed out that a left or right-skewed spectrum implies high or low fractal exponents, respectively. In this context, the asymmetry reveals a relative abundance of large or small fluctuations in the data. Figures 4(a) and (b) show that the multifractal spectra are right-skewed and slightly right-skewed, respectively, indicating a dominance of low fractal exponents and a relative abundance of small fluctuations in SIDC and NSO/KP data. On the other hand, in Figure 4(c), the multifractal spectrum is slightly left-skewed, indicating a dominance of high fractal exponents and a relative abundance of large fluctuations in Virgo/SoHO data. Therefore, in this phase of solar cycle 23, the relative abundance of small fluctuations is more predominant in SIDC data than in NSO/KP and Virgo/SoHO data.
Values of –index are directly related to the instability of the system and to the growth of the entropy. This index was calculated using Equation (2) based on the values of in the first paragraph of the present subsection. The results are , and for the SN, MF and TSI, respectively. The values of 1 denote that its distribution exhibits weak chaos (i.e., zero Lyapunov exponents, but not integrable [10]) in the full dynamical space of the system [10, 11].
3.3 On the behavior of scale-dependent correlation: the –index
The value of –index can be determined from the scale-dependent correlation coefficient according to the expression given by Equation (3). In the nonextensive theory this coefficient should decay following a power law given by Equation (4), with increasing , where the slope is given by Equation (5). In general, one expects to evolve with the number of solar indices on the data and to be a function of the solar cycle. The values of obtained for SIDC, NSO/KP and Virgo/SoHO data are 6.94.81 (), 12.113.98 () and 7.72.63 (), respectively. The values obtained show that the present set of data is not consistent with a power law, owing to high values, particularly in the NSO/KP data. Moyano [27] suggests that the above procedure to calculate should only be used to describe stochastic processes with linear correlations. In other words, the correlation coefficient is not a good alternative to conveniently describe the non-linearity of a sample.
In B–G statistics, in contrast to the nonextensive theory, the coefficient should decrease exponentially with an increasing , following a exp relation, with corresponding to the correlation or relaxation time. Considering our data as consistent with this exponential behavior, we found, for the parameter , 3.390.05 days (), 5.050.38 days () and 3.180.37 days (), respectively for the three datasets. A correlation time between 3 and 5 days for these datasets corresponds approximately to the half timescale of the relaxation process obtained by Nandy et al. [28] for the Sun, in the magnetic fields of flare-productive solar active regions. So, if the equilibrium hypothesis of the Sun is considered valid, then it makes sense to assume for the three sets of data. But, is the Sun in thermal equilibrium? As mentioned by Shibahashi et al. [29], if the Sun is not in thermal equilibrium it takes about 107 years for it to recover its equilibrium state. Therefore, the condition of thermal equilibrium is a good approximation for .
4 Discussion and Conclusions
We have carried out a new approach on the nonextensivity properties of solar magnetic activity from 1996–2001. The study is based on daily measurements of Sunspot Numbers from the the Sunspot Index Data Center, daily full-disk measurements of mean line-of-sight component of unsigned Magnetic Field strength, from the National Solar Observatory/Kitt Peak, and daily means of Total Solar Irradiance from Virgo/SoHO.
The PDFs were calculated for the three datasets and the obtained results show that the entropic indices change as a function of scale. The distributions for the Magnetic Field strength show two different behaviors, with a –Gaussian for scales of 1 to 16 days and a Gaussian for scales larger than 32 days. The latter is in equilibrium state. The Total Solar Irradiance also show two different behaviors, namely, approximately Gaussian at scales of 128 days and larger, consistent with statistical equilibrium and –Gaussian for scales 128 days. In contrast, the distributions for the Sunspot Number show a –Gaussian independent of timescales and consistent with a nonequilibrium state for all the timescales. These results also confirm that the Gaussian or –Gaussian behavior of the data depends significantly on the solar activity indices.
Our results reveal that during the increasing phase of solar cycle 23, the multifractal spectra of the analyzed datasets differ significantly. In particular, we found that SIDC and NSO/KP data have higher complexity than Virgo/SoHO data. In contrast, Virgo/SoHO data present a dominance of higher fractal exponents and a relative abundance of larger fluctuations than for SIDC and NSO/KP data.
The results above suggest that SIDC data are out of equilibrium more than those from NSO/KP and Virgo/SoHO. Again, the multifractal spectra of SIDC are more asymmetric, more weakly chaotic (sensitivity to the initial conditions) and also of higher complexity than the NSO/KP and Virgo/SoHO data. In fact, according to De Toma et al. [14], the fluctuations in SIDC data strongly influence solar magnetism and TSI variability. In this context, we suggest that these properties of SN could be responsible for the dynamics that drive the properties of the –Triplet.
Since the deviation of the three-index set (qstat,qsen,qrel) from unity is a measure of the departure from thermodynamic equilibrium, we also calculated the ’s indices for the present dataset, in different timescales. For example, for =1 day we found that the three solar activity indices, SN, MF and TSI, may be essentially described by the –Triplet set (qstat,qsen,qrel) = (1.310.07,0.710.10,1), (1.210.06,0.440.07,1) and (1.540.03,0.520.10,1) respectively. Identical values of the –Triplet (within the uncertainties) are obtained when we take into consideration the same dataset across the whole solar cycle 23. In addition, the multifractal spectra of the three datasets observed across the whole solar cycle 23 are very similar to those observed during the increasing phase of solar cycle 23. This result suggests that solar magnetic activity tends to be in a quasi-stationary and metastable state for a same solar index. Nevertheless, when we take into account the three solar indices, measured simultaneously in the same period of the solar cycle, we find that solar magnetic activity is non-stationary. Such a comparison, between the whole cycle and its increasing phase, points in fact for a relation between the timescale and the multifractal spectrum asymmetry, in the sense that the larger the timescale required to reach the equilibrium state is, the more the multifractal spectrum is asymmetric (see Figures 2 and 4). In other words, there is a clear relation between indices and . In short, one sees that the dual relation [10, 30]
| (6) |
is approximately satisfied (within the uncertainties) in the scenario of solar magnetic activity. This is the first time, to our knowledge, that a possible relationship between the and is obtained in the study of solar phenomena. This duality reveals that the subsystems here analyzed (represented by the three solar indices Sunspot Number, Magnetic Field and Solar Total Irradiance) are not asymptotically scale-invariant, and that, consequently, they are strongly (or globally) correlated [31]. These facts strongly suggest that important correlations exist between the random variables involved in the relevant physical process controlling the solar activity, which still eludes us. Finally, it is important to underline that these results are in clear agreement with the –CLT [13, 32]. Indeed, according this theorem, the –Triplet seems to be related with duality relations.
Acknowledgements.
Research activities at the Stellar Board of the Federal University of Rio Grande do Norte are supported by continuous grants from CNPq and FAPERN brazilian agencies. D. B. de Freitas acknowledges a Ph.D. fellowship of the CNPq brazilian agency. The Sunspot data were made available by Sunspot Index Data Center (SIDC). NSO/Kitt Peak data used here are produced cooperatively by NSF/NOAO, NASA/GSFC, and NOAA/SEL. The VIRGO TSI data are available from the SOHO VIRGO web site.References
- [1] \NameOliver R., Ballester J.-L. Baudin F. \REVIEWNature3941998552.
- [2] \NameKnaack R., Stenflo J. O. Berdyugina S. V. \REVIEWA&A43820051067.
- [3] \NameVeronig A., Messerotti M. Hanslmeier A. \REVIEWA&A3572000337.
- [4] \NameAbramenko V. I. \REVIEWSol. Phys228200529.
- [5] \NameBurlaga L. F. Viñas A. F. \REVIEWJ. Geophys. Res.109200412107.
- [6] \NameBurlaga L. F., Ness N. F. Acuña M. H. \REVIEWApJ691200982.
- [7] \NameTsallis C. \REVIEWJ. Stat. Phys.521998479.
- [8] \EditorAbe, S. Okamoto, Y. \BookNonextensitive Statistical Mechanics and Its Applications \PublSpringer, Heidelberg \Year2000
- [9] \EditorGell-Mann M. Tsallis C. \BookNonextensive Entropy-Interdisciplinary Applications \PublOxford Univ. Press, New York \Year2004
- [10] \NameTsallis C. \REVIEWPhysica A34020041
- [11] \NameBurlaga L. F. Viñas A. F. \REVIEWPhysica A3562005375.
- [12] \NameOliviero M., Severino G., Straus Th., Jefferies S. M. Appourchaux T. \REVIEWApJ516199945.
- [13] \NameS. Umarov S., Tsallis C. Steinberg S. \REVIEWMilan J. Math.762008307.
- [14] \Namede Toma G., White O. R., Chapman G. A., Walton S. R., Preminger D. G. Cookson A. M.
- [15] \NameLanza A. F., Rodon M., Pagano I, Barge P. Llebaria A. \REVIEWA&A3942002701. \REVIEWApJ60920041140.
- [16] \NameLevenberg K. \REVIEWQ. Appl. Math.21944164.
- [17] \NameMarquardt D. \REVIEWSIAM J. Appl. Math.111963431.
- [18] \NameKantelhardt J. W., Zschiegner S. A., Koscielny-Bunde E., Havlin S., Bunde A. Stanley H. E. \REVIEWPhysica A316200287.
- [19] \NameLyra M. L. Tsallis C. \REVIEWPRL80199853.
- [20] \NameTirnakli U., Beck C. Tsallis C. \REVIEWPhys. Rev. E752007106.
- [21] \NameHarvey J. W., Duvall T. L., Jefferies S. M. Pomerantz M. A. \REVIEWASP Conf. Ser.421993111.
- [22] \NameRabello Soares M. C., Roca Cortes T., Jimenez A., Andersen B. N. Appourchaux T. \REVIEWA&A3181997970.
- [23] \NameAndersen B. N., Leifsen T. Toutain T. \REVIEWSol. Phys1521994247.
- [24] \NameKiyono K., Struzib Z. R., Aoyagi N. Yamamoto Y. \REVIEWIEEE Trans. Biomed. Eng.53200695.
- [25] \NameSen A. K. \REVIEWSolar Phys241200767.
- [26] \NameTelesca L., Lapenna V., Macchiato M. \REVIEWNew J. Phys.72005214.
- [27] \NameMoyano L. \REVIEWThesis, CBPF2006.
- [28] \NameNandy D., Hahn M., Canfield R. C. Longcope D. W. \REVIEWApJ597200373.
- [29] \NameShibahashi H., Takata M., Tanuma S. \Bookin Helioseismology \Vol376 \PublESA Special Publication \Year1995 \Page9.
- [30] \NameQueirós S. M. D., Moyano L. G., de Souza J. Tsallis C. \REVIEWEur. Phys. J. B552007161.
- [31] \NameTsallis C., Gell–Mann M. Y. Sato Y. \REVIEWProc. Natl. Acad. Sc. USA102200515377.
- [32] \EditorTsallis C. \BookIntroduction to Nonextensive Statistical Mechanics - Approaching a Complex World \PublSpringer, New York \Year2009.