The Ubiquity of the Rapid Neutron-Capture Process111 This paper includes data taken at The McDonald Observatory of The University of Texas at Austin.
Abstract
To better characterize the abundance patterns produced by the -process, we have derived new abundances or upper limits for the heavy elements zinc (Zn, 30), yttrium (Y, 39), lanthanum (La, 57), europium (Eu, 63), and lead (Pb, 82). Our sample of 161 metal-poor stars includes new measurements from 88 high resolution and high signal-to-noise spectra obtained with the Tull Spectrograph on the 2.7 m Smith Telescope at McDonald Observatory, and other abundances are adopted from the literature. We use models of the -process in AGB stars to characterize the high Pb/Eu ratios produced in the -process at low metallicity, and our new observations then allow us to identify a sample of stars with no detectable -process material. In these stars, we find no significant increase in the Pb/Eu ratios with increasing metallicity. This suggests that -process material was not widely dispersed until the overall Galactic metallicity grew considerably, perhaps even as high as [Fe/H] 1.4, in contrast with earlier studies that suggested a much lower mean metallicity. We identify a dispersion of at least 0.5 dex in [La/Eu] in metal-poor stars with [Eu/Fe] 0.6 attributable to the -process, suggesting that there is no unique “pure” -process elemental ratio among pairs of rare earth elements. We confirm earlier detections of an anti-correlation between Y/Eu and Eu/Fe bookended by stars strongly enriched in the -process (e.g., CS 22892–052) and those with deficiencies of the heavy elements (e.g., HD 122563). We can reproduce the range of Y/Eu ratios using simulations of high-entropy neutrino winds of core-collapse supernovae that include charged-particle and neutron-capture components of -process nucleosynthesis. The heavy element abundance patterns in most metal-poor stars do not resemble that of CS 22892–052, but the presence of heavy elements such as Ba in nearly all metal-poor stars without -process enrichment suggests that the -process is a common phenomenon.
Subject headings:
nuclear reactions, nucleosynthesis, abundances — stars: abundances — stars: Population II1. Introduction
How much diversity exists among the heavy element abundance patterns observed in stars? Two general cases of nucleosynthesis, neutron () capture on slow () or rapid () timescales relative to the average -decay rates, produce clearly distinct abundance patterns because these processes flow through different sets of nuclei (e.g., Burbidge et al. 1957, Cameron 1957). Yet the overwhelming majority of present-day stars have been enriched by the products of multiple nucleosynthetic events, complicating the process of disentangling the products of individual (classes of) events on observational grounds alone. Theoretical work that incorporates large amounts of experimental nuclear input data, when available, has proved illuminating, particularly with regard to the relative contributions of the - and -process to Solar system (S.S.) material (e.g., Cameron 1973, Käppeler et al. 1989, Arlandini et al. 1999). Yet neither process produces an identical set of nuclei in each event—variations in the physical conditions present at the time of nucleosynthesis, availability of seed nuclei, and the duration of the event surely conspire to affect the nucleosynthetic yields, whether in subtle or extreme fashion. From this perspective, the discovery of metal-poor stars with a wide variety of -capture abundance patterns in the last 20 years or so has created a rich setting to test and refine our understanding of the diverse and often exotic physical conditions of heavy element nucleosynthesis.
CS 22892–052, an extremely metal-poor K giant star from the HK Survey of Beers, Preston, & Shectman (1992), was identified by Sneden et al. (1994) as having a strong overabundance of the -capture elements relative to Fe. The enrichment pattern could not be fit by any published predictions for the -process process, and Cowan et al. (1995) showed that the abundance pattern from barium (Ba, 56) to erbium (Er, 68) was “strikingly similar” to the S.S. -process residuals predicted by Käppeler et al. (1989). Sneden et al. (1996) extended this sequence to thulium (Tm, 69), ytterbium (Yb, 70), hafnium (Hf, 72), osmium (Os, 76), and the radioactive element thorium (Th, 90), which can only be produced in the -process. Over the last decade, several other metal-poor stars have been identified—including several from the first study of -capture elements in a large sample of metal-poor stars by Gilroy et al. (1988)—as standard templates to characterize the -process nucleosynthesis pattern (HD 115444, Westin et al. 2000; CS 31082–001, Hill et al. 2002; BD17 3248, Cowan et al. 2002; HD 221170, Ivans et al. 2006).
The match between the stellar -process abundances and the scaled S.S. -process pattern does not always extend to the lighter heavy elements, including strontium (Sr, 38), yttrium (Y, 39), and zirconium (Zr, 40). Observational evidence demanding an additional nucleosynthesis site for the 130 nuclei was first presented by Wasserburg et al. (1996) in their analysis of radioactive isotopes in the S.S. This result has been expanded upon by observations of 38 elements in metal-poor stars by numerous investigators, including McWilliam (1998), Burris et al. (2000, 2009), Johnson & Bolte (2002), Aoki et al. (2005), Barklem et al. (2005), François et al. (2007), Cohen et al. (2008), Lai et al. (2008), and Mashonkina et al. (2008).
It is also apparent that some very low metallicity stars have heavy element abundance patterns that cannot be matched by either the scaled S.S. -process or -process components. Following similar reasoning employed by Sneden & Parthasarathy (1983) and Sneden & Pilachowski (1985) when comparing HD 122563 and HD 110184, this point was made emphatically by Honda et al. (2006, 2007) when comparing the heavy elements in HD 122563 and HD 88609 to CS 22892–052. When these stars’ heavy element abundances were subtracted from the S.S. -process abundance pattern, two distinct patterns emerged, and that of HD 122563 and HD 88609 was incompatible with any combination of scaled S.S. -process or -process components (Honda et al. 2007, their Figure 5).
We have noticed a possible anti-correlation between the ratio of two elements in the rare earth element (REE) domain, lanthanum (La, 57) and europium (Eu, 63), and the bulk enrichment of Eu relative to Fe. The three standards with the lowest [Eu/Fe] ratios (BD17 3248, HD 221170, and HD 115444; [Eu/Fe])222 We adopt the standard spectroscopic notations that [A/B] log10(NA/NB)⋆ – log10(NA/NB)⊙ and log (A) log10(NA/NH) 12.00 for elements A and B. have log (La/Eu) (Sneden et al., 2009), while the two standards with the highest [Eu/Fe] ratios (CS 22892–052 and CS 31082–001; [Eu/Fe]) have log (La/Eu) (Sneden et al., 2009). The star with the highest level of -process enrichment known (HE 1523–0901, [Eu/Fe] ; Frebel et al. 2007), has log (La/Eu) .
Here we systematically examine the relationship between the light (e.g., Y) and heavy (e.g., La, Eu, and Pb) abundances in these stars and others to better characterize the abundance patterns observed in metal-poor stars and illuminate the nature of the nucleosynthetic process(es) that might be responsible for producing them. Sections 2 and 3 describe our sample, new abundance derivations, and attempts to identify any trace of -process material in these stars. Section 4 describes the observed correlation between the light and heavy -capture elements for the -only stars, and Section 5 describes a plausible physical model to explain this correlation. Finally, in Sections 6 and 7, we discuss the implications of this result and summarize our findings.
2. Sample and Abundance Analysis
Simmerer et al. (2004) obtained high resolution ( 60,000) and high signal-to-noise (S/N 100 at 4100Å) spectra for 88 bright ( 11.0) metal-poor dwarf and giant stars from the halo and disc using the Tull Cross-dispersed Echelle Spectrograph (Tull et al., 1995) on the 2.7m Smith Telescope at McDonald Observatory. We adopt the atmospheric parameters from Simmerer et al. (2004) and derive new zinc (Zn, 30), Y, and Pb abundances for the stars in this sample.333 We exclude HD 232078, which has an effective temperature more than 200 K cooler than any other star in the sample ( 3875 K). Abundances are derived using the current version of the spectral analysis code MOOG (Sneden, 1973), assuming that all lines are formed under conditions of local thermodynamic equilibrium in a one dimensional, plane-parallel atmosphere.
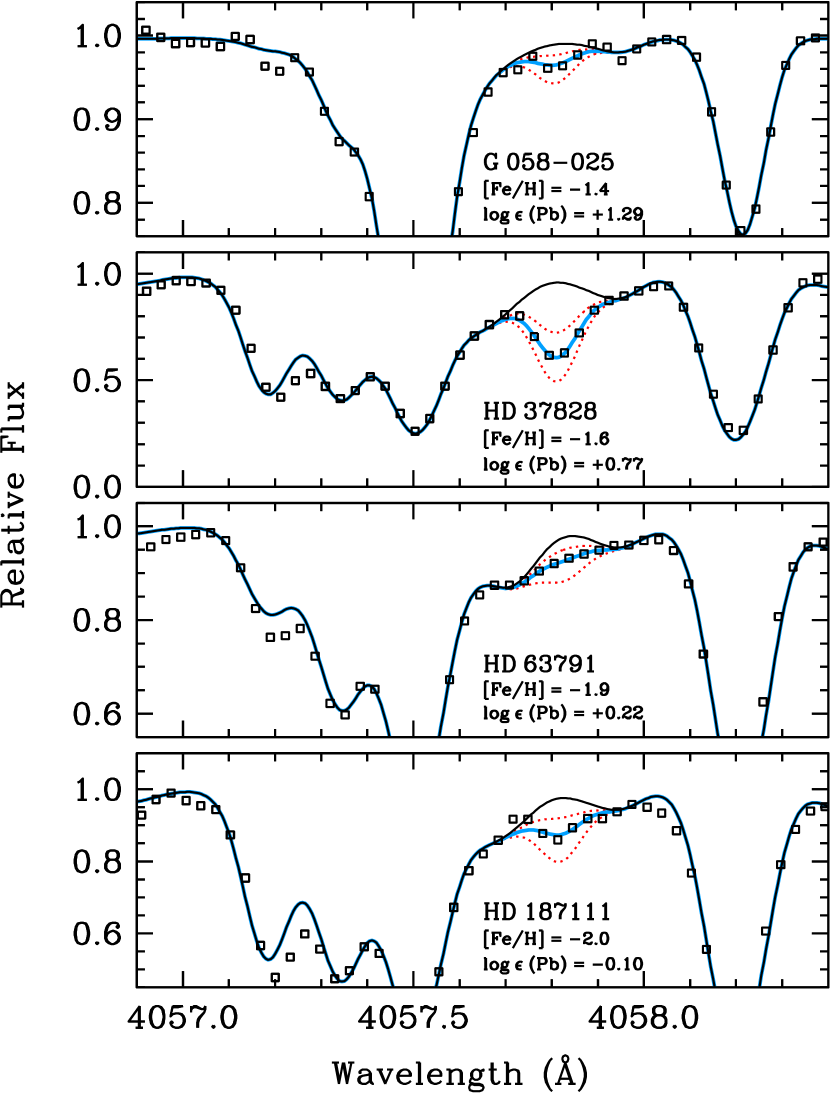
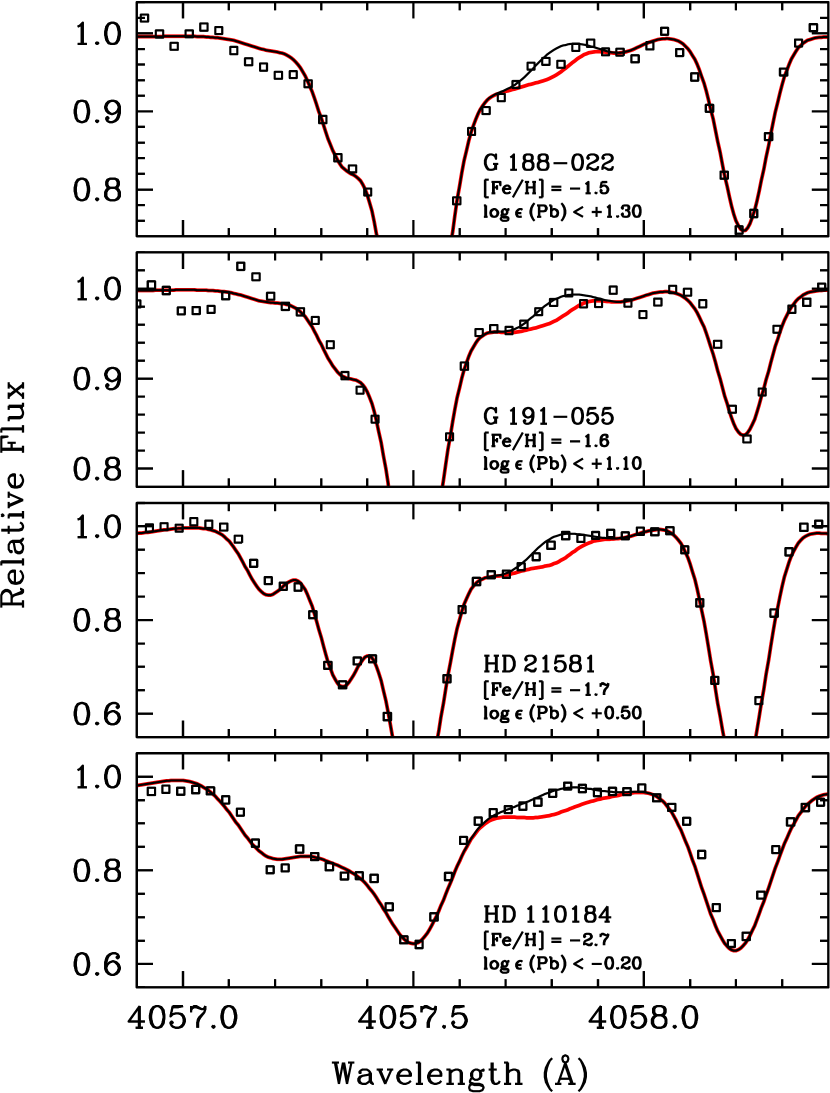
Zn is the heaviest element in the Fe-group that is readily accessible in the optical regime, and we use the Zn i 4722 and 4810Å lines as abundance indicators. The Sr ii resonance lines at 4077 and 4215Å are saturated or blended in most of these stars, so we instead derive abundances for the next heavier element, Y, using the Y ii lines at 4883, 5087, and 5200Å. Equivalent widths for these lines are measured within the IRAF environment,444 IRAF is distributed by the National Optical Astronomy Observatories, which are operated by the Association of Universities for Research in Astronomy, Inc., under cooperative agreement with the National Science Foundation. and these equivalent widths are reported in Table 1. Abundances of Zn i and Y ii are derived by requiring that the predicted line-by-line abundances fit the measured equivalent widths and then averaging the abundance over all lines. We adopt the log() values for Zn i and Y ii from Biémont & Godefroid (1980) and Hannaford et al. (1982), respectively, which are routinely employed in studies of metal-poor stars and were found by Biémont & Godefroid (1980) and Hannaford et al. (1982) to yield reliable abundances for lines in the Solar photosphere. The Pb i abundance was derived from the 4057Å line by fitting synthetic spectra to match the observed spectrum. This line is often weak and nearly always blended in our spectra. When the Pb i line cannot be detected, we derive an upper limit on its abundance. Several examples of our fits and upper limits are presented in Figure 1. We adopt the Pb i log() values of Biémont et al. (2000), which is also the most commonly-used source for these data. No additional broadening of the 4057Å line, caused by isotope shifts or hyperfine structure of the 207Pb isotope, could be detected.
Final abundances for Zn i, Y ii, and Pb i are reported in Table The Ubiquity of the Rapid Neutron-Capture Process111 This paper includes data taken at The McDonald Observatory of The University of Texas at Austin. along with the [Fe/H], La ii, and Eu ii abundances derived by Simmerer et al. (2004) (whose study was limited to C, Fe, La, and Eu). We have supplemented this sample with metal-poor stars from other recent studies. These abundances, along with the original source references, are summarized in Table The Ubiquity of the Rapid Neutron-Capture Process111 This paper includes data taken at The McDonald Observatory of The University of Texas at Austin. . We have not made any explicit corrections to the abundances to put them on a common log() scale, but the laboratory sources for the five species examined here are commonly used, and all predate the abundance measurements compiled here.
3. Identifying Stars with No -process Material
Nucleosynthesis products of the -process generally are visible in the lowest metallicity stars with detectable heavy elements, and products of the -process typically appear in higher metallicity stars that were formed later (e.g., Gratton & Sneden 1994, Burris et al. 2000, Simmerer et al. 2004). Cowan et al. (1996), for example, noted that the heavy element abundance pattern in HD 126238 ([Fe/H] 1.7) could be fit by assuming a majority contribution from the scaled S.S. -process and a small fraction of the total S.S. -process abundance. The -process contribution was necessary to account for the slight overabundances (relative to the scaled S.S. -process pattern normalized at Eu) of Ba–Nd ( 56–60) and Pb. To assess whether this abundance pattern may actually result from repeatable and quantifiable dispersion in the -process itself, we need to remove from our sample all stars with even the slightest hint of -process material. We outline here several approaches to identify these stars.
The -process occurs in the deep He-rich layer of stars on the asymptotic giant branch (AGB) and -process products are carried to the envelope via dredge-up episodes (the third dredge-up) and shed into the interstellar medium (ISM) via strong winds. The 22Ne(,n)25Mg and 13C(,n)16O reactions provide the neutrons for the -process. The former is activated in the convective regions that develop episodically in connection with partial He burning (thermal pulses), while the latter is activated during the interpulse periods (see Busso et al. 1999 for a review). When compared with an -process operating in a metal-rich environment, at low metallicity the -process produces large Pb/Fe (and, e.g., Pb/Eu, Pb/Ba, and Pb/Sr) ratios. (see, e.g., Gallino et al. 1998 and Section 3.1 below). Thus, enhanced Pb/Fe and Pb/Eu ratios should be clear indicators of low-metallicity -process nucleosynthesis. This phenomenon is gradually muted with increasing metallicity of the -process environment, reaching a maximum efficiency of Pb production around [Fe/H] 1.0 (Travaglio et al., 2001). For the present study, to minimize our dependence on any particular set of AGB -process models, we conservatively assume that high Pb/Fe and Pb/Eu ratios are only obtained in environments with [Fe/H] 1.4 (cf. Bisterzo et al. 2010).
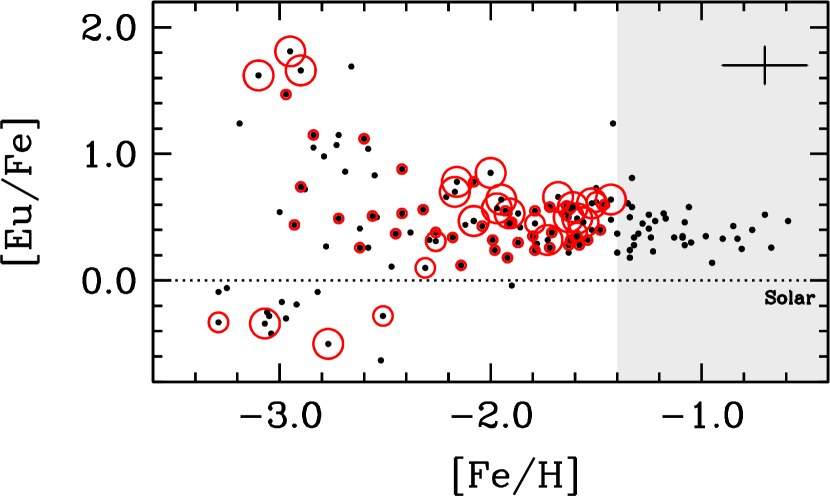
The handful of -process standard stars with [Fe/H] 3.0 show Pb abundances or upper limits consistent with the low levels expected if no -process material is present; these Pb measurements are also consistent with or slightly lower than (e.g., CS 31082–001 and HE 15230901; Plez et al. 2004, Frebel et al. 2007) -process model predictions (Kratz et al., 2004; Roederer et al., 2009). These stars all have [Pb/Eu] 0.8 or 0.7 (log (Pb/Eu) 0.7 or 0.8). From this evidence, we conclude that all stars with [Fe/H] 1.4 and [Pb/Eu] 0.6 (log (Pb/Eu) 0.9) contain no -process material. This low level of Pb is perhaps the best diagnostic for selecting metal-poor stars containing no material produced by the -process. This limit is illustrated in Figure 2. This figure indicates that a number of metal-poor stars can be diagnosed as -only using this criterion alone.
Honda et al. (2006, 2007) have performed extensive studies of the heavy elements in HD 88609 and HD 122563. They concluded that the enrichment patterns in these stars cannot be fit by the scaled S.S. -process pattern, abundances predicted by -process models, or any combination of these (see also Sneden & Parthasarathy 1983, Farouqi et al. 2008, and Kratz et al. 2008a). No elements heavier than the REE group have been detected in these stars (including Pb), and we likewise assume that they contain no -process material.
Finally, a variation of this principle was used by Roederer et al. (2010a) to deduce that no -process enrichment had occurred in a metal-poor stellar stream. These stars’ similar kinematics imply that they originated in a common (but unknown) progenitor system that may have been shredded by the Milky Way. The -capture elements exhibited a range of X/Fe ratios, but the -capture abundance pattern (e.g., X/Eu) was itself unchanged in all stream members and matched the scaled abundance pattern of the -process standard star CS 22892–052 for the heavy -capture elements. Pb could only be detected in the two most metal-rich stars in the stream ([Fe/H] 1.5 and 1.6), but in these two cases the Pb abundance was low and consistent with the Pb/Eu ratio expected for enrichment by the -process. If the -process had not enriched the most metal-rich stars in the stream, it is highly unlikely that it enriched the more metal-poor stars. Since all stream members show the same general -capture abundance pattern, we contend that all stars studied in this particular stream show no evidence of -process material.
3.1. Low Metallicity Models of AGB -process Nucleosynthesis
To further investigate the minimum [Pb/Eu] and [La/Eu] ratios that may be produced in the -process, we have computed AGB nucleosynthesis models for a range of stellar masses at metallicities of [Fe/H] 1.4 and 2.3. We use techniques described in Karakas et al. (2009) but with an extended network of 291 species from H to S and Fe to Bi, assuming a scaled-solar initial composition and using reaction rates taken from the JINA REACLIB database (Cyburt et al., 2010). We refer to Karakas & Lattanzio (2007) and Karakas (2010) for a full description of the stellar structure models and input parameters. The resulting [La/Eu] and [Pb/Eu] ratios, determined at the end of the AGB phase, are shown in Table 3. The low-mass AGB models () show surface compositions of [Pb/Eu] . In contrast, intermediate-mass AGB models () predict lower ratios, [Pb/Eu] . Hence, the minimum values produced by our models are [La/Eu] 0.61 (log (La/Eu) 1.2) and [Pb/Eu] 0.37 (log (Pb/Eu) 1.9).
The result of high Pb/Fe and Pb/Eu ratios is generally model-independent because the -process at metallicities below [Fe/H] favors production of Pb over lighter -capture elements. This follows from the fact that the 13C neutron source is primary, formed from the H and He initially present in the star. The Fe-group seed nuclei for the -process are not primary elements. Thus, the time-integrated neutron flux is proportional to 13C/, and at lower metallicity () the neutron exposure increases favoring the production of heavier elements in the -process (Clayton, 1988; Gallino et al., 1998). This enhanced Pb phenomenon is evident in the predictions of our models shown in Table 3.
The more massive AGB stars are relatively short lived ( Myr) and therefore could have contributed early -process enrichment of the halo. In a standard initial mass function they constitute only a few percent of all AGB stars. Because of their relatively quick evolution they may be more likely to have injected -process enriched material into the ISM from which our low-metallicity stellar sample formed, so we include their -process yields when considering the lowest [Pb/Eu] ratios that may be produced. Given sufficient time, however, their contributions will be diluted by those from the lower-mass stars that produce higher [Pb/Eu] ratios.
The main uncertainty in AGB -process predictions is the formation of the main neutron source nucleus 13C. In order to have enough 13C for the -process to occur, extra mixing is needed to carry protons from the convective envelope down into the 4He- and 12C-rich radiative layer of the star. This typically occurs when a sharp discontinuity between these two regions is left after the the third dredge-up. These protons can then react with 12C to produce a region rich in 13C and 14N (the 13C “pocket”). The physical mechanism leading to this mixing is not known, and thus its dependence on the stellar mass and metallicity is also unknown. In the stellar models with 3 we do not include a 13C pocket. It has been qualitatively shown that in this mass and metallicity range protons mixed down from the envelope into the deeper layers burn while being mixed. The detailed consequences of proton ingestion on the nucleosynthesis are not well known but could range from the inhibition of formation of the 13C pocket (Goriely & Siess, 2004) to termination of the AGB phase altogether (Woodward et al., 2008). The intermediate-mass models of low-metallicity of Herwig (2004) show the formation of a 13C pocket; however, this occurs deep in the star below the He shell, where there is very little 4He. In summary, the 13C neutron source is most likely not available or not efficient in these stars.
For the lower mass AGB stars we treat the formation of the 13C pocket in an artificial way as described in detail in Lugaro et al. (2004). At the end of each third dredge-up episode we add an exponentially decaying proton profile from the envelope value 0.7 to 10-4 at a point in mass 0.002 below the base of the envelope in the 12C-rich layer. This choice results in an -process rich region of 0.001 because the -process occurs only in the bottom half of the resulting 13C pocket where there are fewer 14N atoms to capture neutrons via the 14N(n,p)14C reaction (Goriely & Mowlavi, 2000; Lugaro et al., 2003). The 0.001 value has been shown in previous studies to reproduce observational constraints (Busso et al., 2001; Cristallo et al., 2009a). Since, in any case, it is a free parameter we also report in Table 3 several test cases where the size of this region is varied by a factor of 2. This has only a small effect on the predicted [La/Eu], [Pb/Eu], and [Pb/Fe] ratios.
Our method to include the formation of the 13C pocket is very similar to that employed by Goriely & Mowlavi (2000) and it is based on the simple assumption that the proton profile in the 13C-rich region must be continuous. All the mechanisms proposed to date for the mixing produce profiles that satisfy this assumption. Once this basic feature is assumed, the resulting neutron flux and thus the -process distribution are almost unequivocally determined (except for the two points discussed below). This was demonstrated by Goriely & Mowlavi (2000) who calculated very similar -process distributions when changing the shape of the continuous proton profile. As a consequence our results are the same as those of Van Eck et al. (2003), whose models are based on those of Goriely & Mowlavi (2000), and those of Cristallo et al. (2009a), who instead calculated the mixing of protons self-consistently via time-dependent overshoot.
Two effects can still change the resulting distribution: a higher 12C abundance, due to overshoot of the convective thermal pulses into the C-O core, and shear mixing due to rotation occurring after the formation of the 13C pocket. A higher 12C abundance would not affect the minimum -process ratios because it would result in a higher abundance of 13C, hence a higher neutron flux (Lugaro et al., 2003), a higher Pb/Eu ratio, and unchanged La/Eu ratios. Rotational mixing, on the other hand, would completely inhibit the -process by mixing 14N into the 13C-rich layers of the pocket. 14N would then capture most of the neutrons via the 14N(n,p)14C reaction (Herwig et al., 2003; Siess et al., 2004); however, rotational shear is likely to be damped by the inclusion of magnetic fields (Suijs et al., 2008). One could still imagine milder mixing leading to smaller neutron exposures. Bisterzo et al. (2010) explicitly investigated this possibility by artificially changing the amount of 13C in the pocket. The minimum La/Eu and Pb/Eu adopted here are still valid when considering these models. Finally, we mention the possibility of the -process occurring during episodes of proton-ingestion in the convective thermal pulses (Cristallo et al., 2009b), and the minimum values adopted here also hold in this case.
3.2. Comparison with Observations
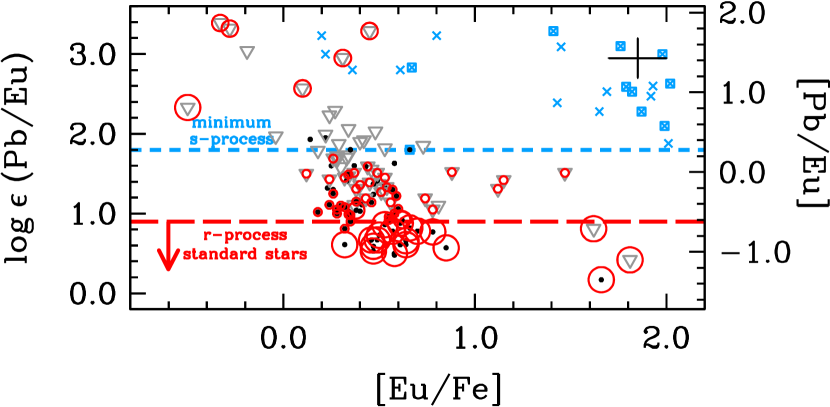
In addition to displaying stars with -process enrichment, Figure 2 also shows the Pb/Eu ratios for 28 metal-poor stars with reported -process or enrichments (Aoki et al. 2001, 2002, Barbuy et al. 2005, Barklem et al. 2005, Cohen et al. 2003, 2006, Goswami et al. 2006, Ivans et al. 2005, Johnson & Bolte 2004, Jonsell et al. 2006, Preston & Sneden 2001, Roederer et al. 2008b, 2010a, Simmerer et al. 2004, and Thompson et al. 2008). Members of this group that are in known binary (or multiple) star systems or have detected radial velocity (RV) variations are highlighted (see Aoki et al. 2003, Carney et al. 2003, and Preston 2009 in addition to the above references), though the lack of RV variations should not be taken as strong evidence against binarity (Preston, 2009).555 The confirmed RV variable stars are preferentially among those with the highest levels of [Eu/Fe], but this is to be expected due to observational bias if we assume that the Eu originated in the -process. Stars in close binary systems have shorter periods that increase the probability of detecting the RV variations on shorter timescales. Boffin & Začs (1994) found a perceptible anti-correlation between orbital period and -process enrichment in barium stars (i.e., Pop I G–K giants). In other words, a greater amount of material lost from the donor star is being captured when the companion is in close proximity, and this phenomenon is likely manifest here. All C-enriched metal-poor stars with overabundances of -process material are likely in binary star systems (e.g., McClure et al. 1980, McClure 1983, Lucatello et al. 2005). Most of these stars have [Pb/Eu] 0.3 (log (Pb/Eu) 1.8). This minimum Pb/Eu ratio is in very good agreement with our AGB model predictions.
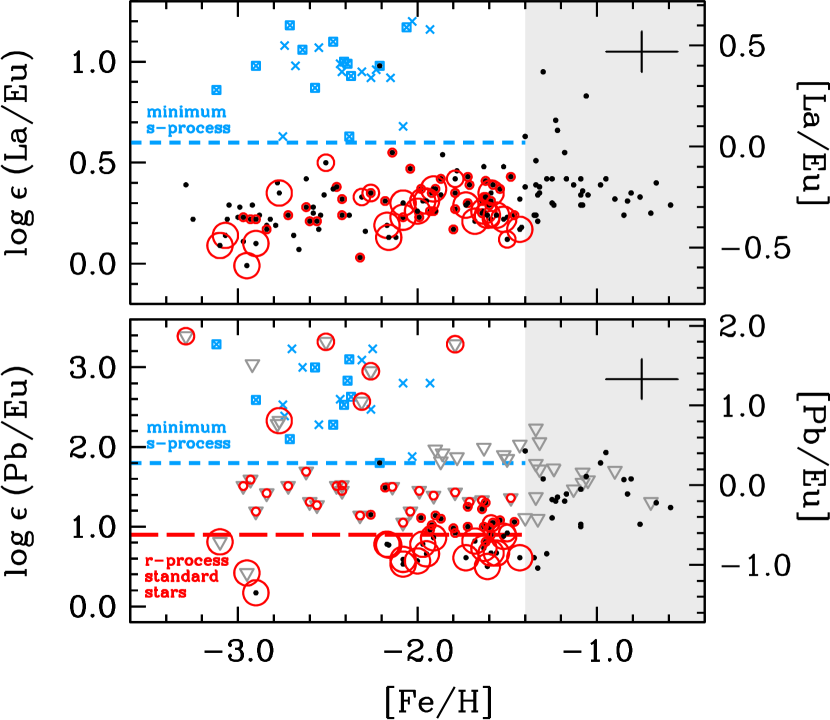
Figure 3 shows both the Pb/Eu and La/Eu ratios as a function of [Fe/H] for this same sample of 28 stars with or enrichment and for our sample of -enriched stars. The three stars with 0.0 [La/Eu] +0.1 (0.6 log (La/Eu) ) (CS 29513–032, CS 29526–110, and HE 00580244; Roederer et al. 2010a, Aoki et al. 2002, and Cohen et al. 2006, respectively) all have high Pb/Eu ratios ([Pb/Eu] 1.1), so they would not be otherwise mistaken as -enriched. Furthermore, one of these stars, CS 29513–032, is a member of a stellar stream with known -enhancement in other stars (by definition, then, it is an star), so it is not surprising that its La/Eu and Pb/Eu ratios have been lowered by the presence of -process material. On the basis of the RV variability and high La/Eu and Pb/Eu ratios, it is clear that these stars formed through a separate enrichment mechanism than the stars that we claim lack any detectable signature of -process enrichment. Based on our AGB -process model predictions and the observational data shown in Figure 3, we conservatively adopt [La/Eu] (log (La/Eu) 0.6) and [Pb/Eu] (log (Pb/Eu) 1.8) as the minimum -process ratios expected at low metallicity.
A more concerning scenario is that -process material produced by AGB stars has added a light “dusting” to the ISM. Our minimum -process Pb/Eu ratio would need to be diluted by a factor of 10 by the low Pb/Eu ratio found in the -process standard stars in order to be disguised as -process material and remain undetected by us. The overwhelming majority of the 28 stars in our and subset have strong C-enhancements ([C/Fe] 1.5), presumably produced together with the -process. Many of the stars that we claim to lack -process material (“no-”) have subsolar [C/Fe] ratios (see original source references for Table The Ubiquity of the Rapid Neutron-Capture Process111 This paper includes data taken at The McDonald Observatory of The University of Texas at Austin. , especially Simmerer et al. 2004). To dilute [C/Fe] 1.5 to a solar [C/Fe] ratio by mixing it with [C/Fe] 0.2 (the median value for the sample of stars analyzed by Simmerer et al. 2004) would require a dilution factor of more than 80. If such dilution is not seen in our sample of no- stars in [C/Fe], it is not likely present in [Pb/Eu] or [La/Eu].
Another possible source of an -process dusting could be the weak -process. This operates in massive stars but is not expected to produce significant amounts of nuclei heavier than 90 (i.e., the Zr isotopes) (Raiteri et al., 1993), so this process cannot be the origin of a dusting of heavy -capture material. (This does not exclude the possibility that the weak -process may produce some of the 90 nuclei ejected from a core-collapse SN.) Pignatari et al. (2008) present nucleosynthesis calculations for the weak -process in rotating, massive, low-metallicity stars, and their models predict the production of heavier -process nuclei; however, even here, the Pb overabundance is expected to be large. In summary, for all but the lightest nuclei, it seems unlikely that -process nucleosynthesis is contributing small (or large) amounts of material to our sample of -only stars.
4. Observed Correlations
For the remainder of this study, we accept (1) that the small number of well-studied, low-metallicity -process standard stars (such as CS 22892–052 and CS 31082–001) lack -process material; (2) that the two low-metallicity stars HD 88609 and HD 122563, which are deficient in the heavy -capture elements, lack -process material; and (3) the general presence of high Pb/Fe and Pb/Eu ratios produced in the -process at low metallicity. We now present the resulting observed heavy element abundance correlations for the -only stars and discuss their consequences.
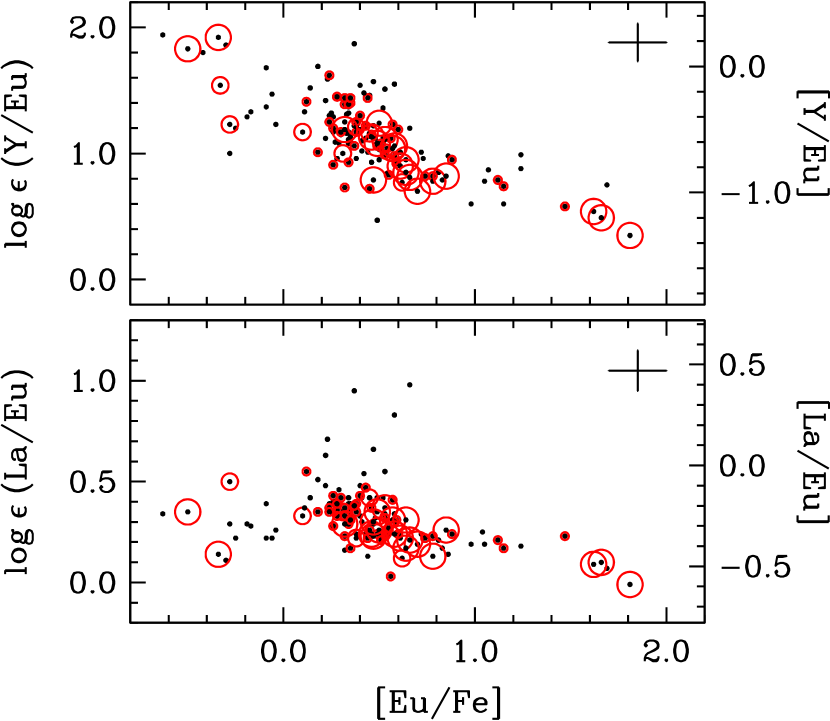
In Figure 3 we show the logarithmic La/Eu and Pb/Eu ratios as a function of [Fe/H] for all stars listed in Table The Ubiquity of the Rapid Neutron-Capture Process111 This paper includes data taken at The McDonald Observatory of The University of Texas at Austin. . Stars that we have identified as lacking any detectable -process material are highlighted by the red circles, which we focus on now. The top panel of Figure 3 is analogous to Figure 7 of Simmerer et al. (2004). A slight overall upward trend in La/Eu with increasing [Fe/H] is apparent, but this is driven by a small number of stars with low La/Eu near [Fe/H] 3.0. Simmerer et al. (2004) attributed this gradual increase in La/Eu to a rise in the amount of -process material present in the birth clouds, since the high mass stars presumably associated with the -process should have enriched the ISM faster than the lower mass stars associated with the -process. (Simmerer et al. 2004 adopted log (La/Eu)0.1 and log (La/Eu)2.1.) A similar effect is seen for Pb/Eu in the bottom panel of Figure 3. Any slope in Pb/Eu is only driven by two stars with low Pb/Eu at [Fe/H] 2.9, CS 31082–001 and HE 15230901; CS 31082–001 is the lone -only star with [Fe/H] 2.3 and detected Pb. In the metallicity range from 2.3 [Fe/H] 1.4, there does not appear to be any upward slope in Pb/Eu, and there is no upward slope in La/Eu in this metallicity range, either. (Recall that we have refrained from making any assumptions regarding the origin of the heavy elements in stars with [Fe/H] 1.4.)
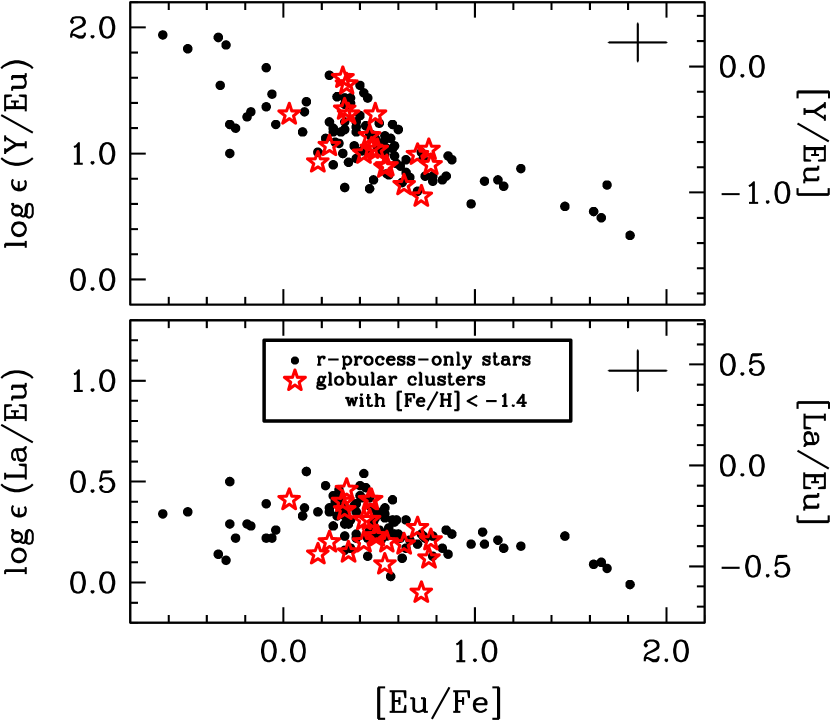
The logarithmic Y/Eu ratio is shown as a function of [Eu/Fe] in the top panel of Figure 4. In the stars lacking any -process material, there is a marked anti-correlation between [Y/Eu] and [Eu/Fe], in the sense that the stars with the highest [Eu/Fe] ratios have the lowest [Y/Eu] ratios. This anti-correlation is continuous and extends several orders of magnitude from 0.5 [Eu/Fe] 1.8 (a factor of 200 in Eu/Fe) and includes the stars most strongly enriched in the -process (e.g., CS 22892–052) and those with the most severe heavy element deficiencies (e.g., HD 122563). There is a fair amount of scatter in the relation (a factor of 2–8 in Y/Eu), increasing in Y/Eu with decreasing [Eu/Fe], but this scatter is much smaller than the extent over which the relationship extends (a factor of 30 in Y/Eu). The existence of this relationship reaffirms the findings of Barklem et al. (2005), Otsuki et al. (2006), and Montes et al. (2007) on the basis of a more extensive set of stellar abundances that has been explicitly purged of -process contamination.
The bottom panel of Figure 4 shows the logarithmic La/Eu ratio as a function of [Eu/Fe]. There is a hint of an anti-correlation between these variables—but it is not nearly as pronounced as the relationship between [Y/Eu] and [Eu/Fe]. This relationship helps to explain the slight upward trend of La/Eu with increasing [Fe/H] seen in the top panel of Figure 3. The stars with the lowest La/Eu ratio are generally those with the highest levels of [Eu/Fe], which preferentially occur in stars with [Fe/H] 2.5, as shown in Figure 5. At higher metallicities [Eu/Fe] is generally lower and thus La/Eu is slightly higher, so the upward trend of La/Eu with increasing [Fe/H] in Figure 3 is not explicitly a metallicity effect.666 Figure 4 also reveals several stars with super-Solar [La/Eu] ratios, including 3 stars with [La/Eu] : BD 01 2582, G126-036, and G140-046. All of these stars except BD 01 2582 have [Fe/H] 1.4, so they fall beyond the realm of concern for this study. BD 01 2582, with [Fe/H] 2.2, is a well-known CH giant (Bond, 1980), and Carney et al. (2003) demonstrated that this star exhibits RV variations. On the basis of its large C enhancement and RV variations BD 01 2582 would not be mistaken for an -only star, but our derived Pb/Eu ratio for this star, log (Pb/Eu) 1.80, places it squarely on our adopted lower limit for AGB pollution. This star serves as a cautionary reminder to consider all available evidence when examining the enrichment history of a star.
Figure 6 illustrates this fact explicitly. In each of three metallicity bins ([Fe/H] 3.0 0.1, [Fe/H] 2.8 0.1, and [Fe/H] 2.6 0.1) there are several stars whose [Eu/Fe] ratios span most or all of the observed range (0.4 [Eu/Fe] 1.8, 0.5 [Eu/Fe] 1.6, and 0.3 [Eu/Fe] 1.1, respectively). This firmly indicates that the relationship between [Eu/Fe] and [Y/Eu] is independent of metallicity, which also reaffirms the findings of Montes et al. (2007) (their Figure 2).
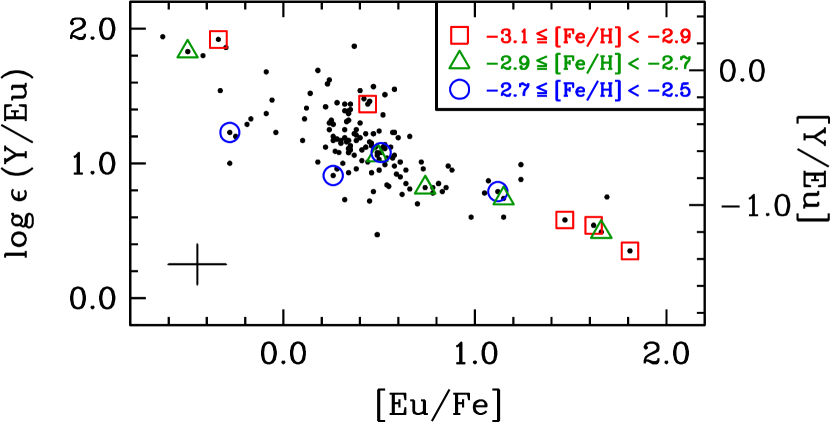
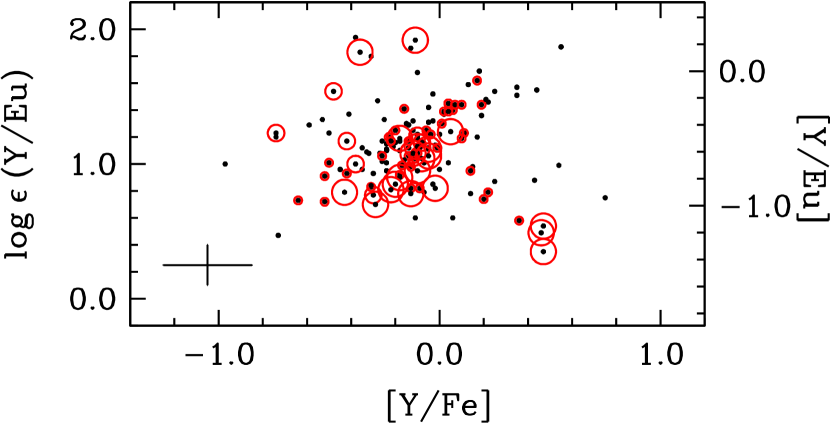
Figure 7 compares the [Y/Eu] ratio to [Y/Fe]. The [Y/Fe] ratio is super-Solar in the handful of stars with [Eu/Fe] 1.0, but in all other cases there appears to be no relationship between [Y/Eu] and [Y/Fe]. Unlike the top panel of Figure 4, where [Y/Eu] showed a clear anti-correlation with [Eu/Fe] spanning the entire range of [Eu/Fe], there is no relationship between [Y/Eu] and [Y/Fe] except for the most -rich stars. When Eu is produced in significant quantities ([Eu/Fe] 1.5), Y is also produced in slightly higher amounts as well ([Y/Fe] 0.4). On the other hand, when lower amounts of Y are produced ([Y/Fe] 0), the amount of Eu produced may vary by more than 1 dex for a given abundance of Y. Knowing [Y/Fe] for a star gives little predictive power for the [Y/Eu] ratio, whereas [Eu/Fe] does. Stars strongly enriched by the -process, such as CS 22892–052, are overabundant in the heavy elements relative to the light ones, and stars such as HD 122563 are deficient in the heavy elements, rather than overabundant in the light ones.
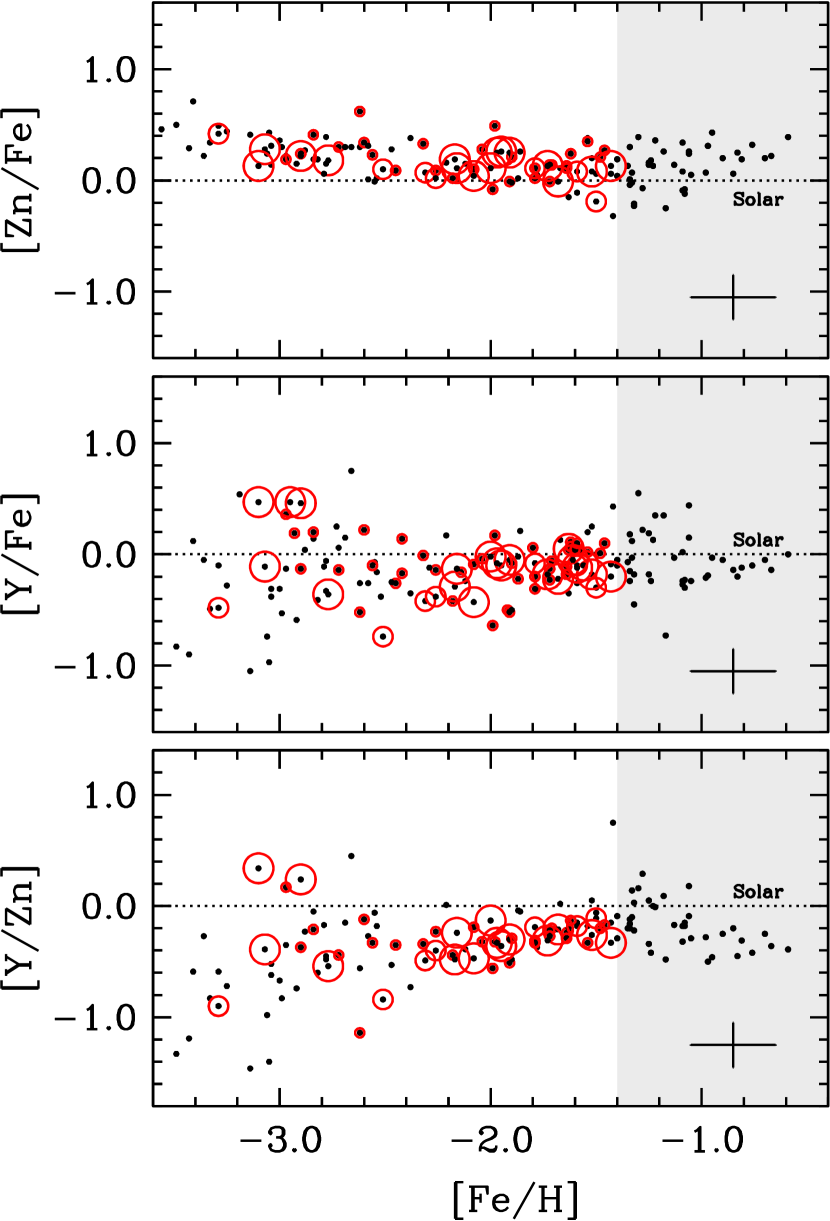
At low metallicity, elements at least as heavy as Ge ( 32) are produced along with the Fe-group and not in -capture reactions (Cowan et al. 2005; see also Fröhlich et al. 2006 and Farouqi et al. 2009). Figure 8 demonstrates that the Y in our sample is clearly decoupled from the Fe-group elements Fe and Zn. The [Zn/Fe] ratio shows almost no scatter at all metallicities in these stars and has a slight upturn at [Fe/H] 2.8. Zn, the heaviest element in the Fe-group that is easily measured in metal-poor stars, is clearly produced along with Fe. In contrast, the [Y/Fe] ratio shows an increasingly large degree of scatter at low metallicities. Knowing the Zn (or Fe) abundance of a star gives no indication of the Y abundance and vice-versa, indicating that the Y in our sample was not produced with the Fe-group elements.
Having shown that we can select a sample of stars with no -process enhancement and having identified a relationship between the abundance ratios in these stars, we now propose a mechanism to explain this relationship.
5. Heavy Element Nucleosynthesis in the High Entropy Wind of a Core-Collapse SN
Despite many years of effort, the specific astrophysical site for the -process is still unknown; core-collapse supernovae (SNe), however, have long been suspected as one promising source for this process, despite the difficulty in understanding (and replicating) the explosion mechanism and exotic SN physics. Model-independent approaches have been utilized to attempt to characterize the nature of the -process in explosive environments. These “waiting point” approximation models, based on the neutron capture and photodisintegration equilibrium under conditions of high neutron number densities, have provided insight into the nuclear and astrophysical conditions necessary for the -process (see Kratz et al. 1993, 2007). To synthesize neutron-rich nuclei in explosive environments requires some combination of values of neutron number densities or entropies (S). One promising SN model involves the so-called “neutrino wind,” a wind of particles caused by neutrinos shortly after the SN explosion (see, e.g., Woosley et al. 1994; Thompson 2003). This scenario posits a moderately neutron-rich, high entropy wind (HEW) from Type II (core-collapse) SNe (see also Wanajo et al. 2002). To explore the nucleosynthetic conditions in this HEW, Farouqi et al. (2009, 2010) have performed a number of nucleosynthesis network calculations to determine the ratio of free neutrons to “seed” nuclei (Yn/Yseed), which is correlated with entropy, the electron abundance Y (), and the expansion velocity. Hydrodynamical simulations cannot yet reproduce the detailed astrophysical and nuclear conditions in the SN explosion, but it is possible to explore the parameter space in our HEW simulations with different values of S and Ye to determine the ratio Yn/Yseed, which can be thought of as the strength of the -process (Kratz et al., 2008b; Farouqi et al., 2009, 2010).
The term “-process” may describe one particular nucleosynthetic mechanism for producing heavy nuclei (specifically, the addition of large numbers of neutrons to existing nuclei on timescales much shorter than the -decay rates), but the conditions that enable such a process may span a wide range of physical properties that together may be capable of producing a range of abundance patterns. This is revealed in the results of both the waiting point approximation and the HEW model calculations. Kratz et al. (2007), for example, find that different neutron number densities are required to produce different abundance regimes. They could reproduce the S.S. -process abundance curve and the -rich halo star elemental abundances with a superposition of neutron number densities ranging from 20 log n 28. The heavier -capture elements ( 130, roughly the Ba isotopes and heavier) required 23 log n 28, typical of the main -process, while the lighter elements could be reproduced with only 20 log n 22. In more sophisticated HEW dynamic network calculations, Farouqi et al. (2009) found that a superposition of weighted entropies for a fixed Y 0.45 was necessary to reproduce the S.S. -process abundance curve and -rich halo stars: the 130 nuclei could be produced with 150 S 300 (typical of the main -process), but the 130 nuclei required only 110 S 150 (typical of the weak component of the -process as defined by Pfeiffer et al. 2001; Truran et al. 2002, which does not produce the Ba isotopes).
Here we compare observations with recent dynamic -process simulations in the HEW, assuming the full entropy range (5 S 300, which depends on Ye; see Farouqi et al. 2010) and an expansion velocity of 7500 km s-1. These new calculations employ the Extended Thomas Fermi mass model with quenched shell effects (ETFSI-Q) far from stability to predict masses where no experimental data are available. Furthermore, the nuclear physics input parameters, including the half lives, -capture cross sections, -delayed neutron emission probability, and fission rates have all been obtained consistently based upon the same ETFSI-Q model (see Farouqi et al. 2010 for further discussion).
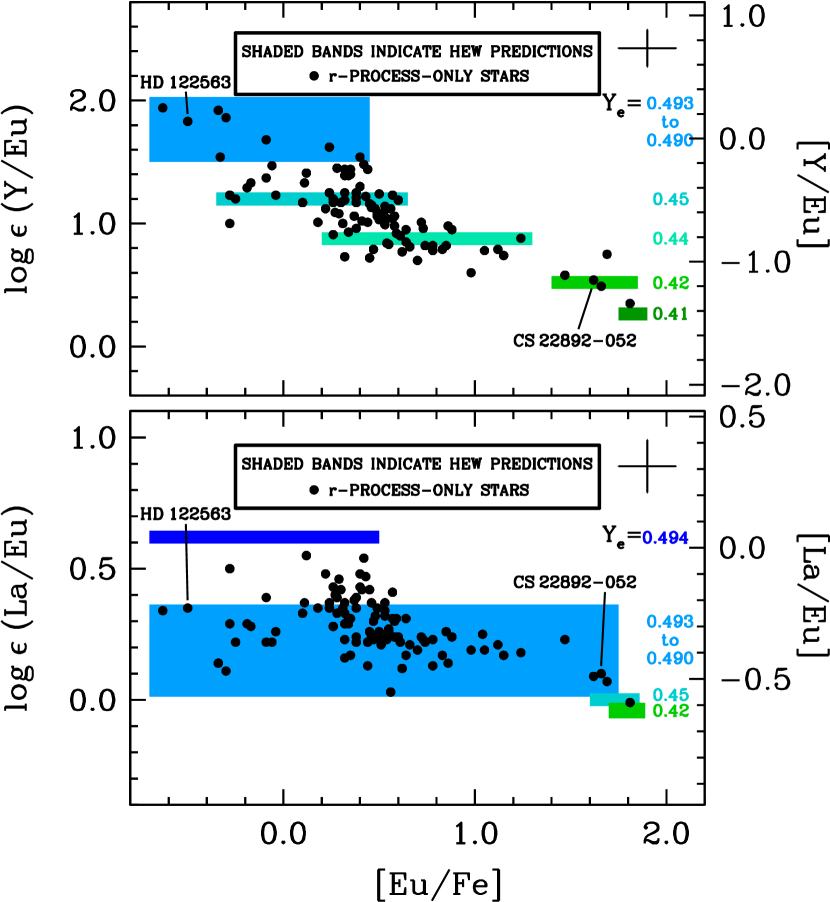
Figure 9 shows the logarithmic Y/Eu and La/Eu ratios as a function of [Eu/Fe] for all stars in our sample with [La/Eu] 0.0 (log (La/Eu) 0.6). As shown in the top panel, the Y/Eu ratio in the -process rich star CS 22892–052 is 25 times smaller than that in the -process deficient star HD 122563. These extreme ratios can be matched simply by varying Ye in our calculations from 0.49 for HD 122563 to 0.42 for CS 22892–052. The vertical placement of the Ye values (i.e., [Y/Eu] or log (Y/Eu)) in Figure 9 is explicitly predicted by our simulations. We caution that the horizontal placement (i.e., [Eu/Fe]) of the Ye bands is not an explicit prediction, and the horizontal extent of the bars has been scaled to approximately match the observational data.
In the lower panel of Figure 9, the logarithmic La/Eu ratio shows a relatively flat trend with a comparatively small change in Ye from the -deficient to the -rich stars, with Y 0.49 for HD 122563 to 0.49 for CS 22892–052. For 0.40 Y 0.49, the [La/Eu] predicted by our simulations changes only by 0.1 dex (in contrast to a change of [Y/Eu] of 1.8 dex). When using the ETFSI-Q mass model, our HEW predictions for the light REE are 0.2 dex too low compared with, e.g., the Arlandini et al. (1999) S.S. -residuals. This results from the well-understood nuclear structure deficiencies in the transitional region beyond the 82 shell closure, which affect the neutron separation energies and consequently the -process path. Most other mass models show even more significant deficiencies than the ETFSI-Q model. If we “repair” the ETFSI-Q model in this region (i.e., artificially add the 0.2 dex), we recover the same Ye fractions for both La/Eu and Y/Eu: the lowest stellar [La/Eu] ratios at 0.6 would be reproduced with Y 0.41, the highest stellar [La/Eu] ratios at 0.05 would be reproduced by Y 0.493, and all intermediate ratios would be shifted up accordingly. Alternatively, these observed ranges in [Y/Eu] and [La/Eu] may also be fit by fixing Y 0.45 and varying the entropy ranges (e.g., from 5 S 215 for the -deficient stars to 70 S 300 for the -rich stars).777 Increasing the entropy range from S 230 to S 300 changes La/Eu very little, and removing the low entropy components from the HEW calculations affects the abundances of each of La and Eu by 1% even when S 175 are removed. In other words, neither La nor Eu are being produced in significant quantities until the -process flow has passed the closed nuclear shells that produce the 130 abundance peak. The REE, including La and Eu, are produced under similar Yn/Yseed conditions within a small entropy interval.
Thus our HEW simulations can successfully reproduce both the Y/Eu and La/Eu ratios for both the -rich and -deficient stars (as well as the intermediate cases) with self-consistent ranges of Ye or entropy. A robust main -process produces abundance patterns like those seen in CS 22892–052 with low Y/Eu ratios. Stars like HD 122563, with a higher Y/Eu ratio matched by a higher Ye (e.g., Figure 2 of Kratz et al. 2008a), can be considered to be enriched by an incomplete main -process where the production of the heavier elements is falling off with increasing atomic number.
The simulations and abundance comparisons do provide some indications of the types of environments where this nucleosynthesis may have occurred. The neutrino-driven wind starts from the surface of the proto-neutron star with a flux of neutrons and protons. As the nucleons cool they combine to form particles and an excess of unbound neutrons, and further cooling produces a population of Fe-group seed nuclei (e.g., Woosley et al. 1994, Woosley & Janka 2005, Farouqi et al. 2010). For 110 (at fixed Y 0.45), where the ratio of free neutrons to seed nuclei is 1, the nucleosynthesis is consistent with a charged-particle (CP) or -rich freezeout and recapture of -delayed neutrons emitted from neutron-rich nuclei near the first -process peak. In this sense, these low entropy components that produce the Sr-Y-Zr group are of a primary nature and fit the requirements for the light element primary process (LEPP) proposed by Travaglio et al. (2004). (See Kratz et al. 2008b and Farouqi et al. 2009, who showed that the Sr/Y/Zr ratios—both observationally and in the HEW model—are independent of total Eu enrichment.) Identification of the mass range where the production mechanism changes from a CP and -delayed neutron recapture process to a true -process is beyond the scope of the present study.
We stress that the relationship between [Y/Eu] and [Eu/Fe] in metal-poor stars is an observed trend, and the HEW model is one plausible explanation for the existence of such a relationship. This does not, however, exclude the possibility that additional sites—and processes—may also produce conditions favorable to heavy element nucleosynthesis. Regardless of which site(s) is (are) responsible for producing the -process, nuclear physics and realistic astrophysical conditions will remain essential ingredients to interpreting observed stellar abundance patterns.
6. Discussion
In this study we adopt somewhat conservative limits that -process nucleosynthesis is characterized by [Pb/Eu] 0.3 (log (Pb/Eu) 1.8) and [La/Eu] 0.0 (log (La/Eu) 0.6), from which a correlation between [Y/Eu] and [Eu/Fe] has emerged. We are encouraged by the fact that even weak upper limits on the Pb abundance can sometimes be meaningful. In this section we consider several examples of how these definitions can be used in conjunction with other information to characterize the heavy element enrichment patterns in metal-poor stars. We also consider several implications of these results.
6.1. The Limits of Precision of -process Residuals
Several mechanisms are required to explain the lightest of the heavy elements in metal-poor stars, and it is now well-established that simple -process residuals () are inadequate descriptions of the -process contribution to the Sr-Y-Zr group (see Qian & Wasserburg 2007, 2008 for recent summaries). Similarly, simple linear combinations of the scaled S.S. -process and -process are inadequate descriptions of some of the heavy -capture elements, as well, when a precise deconvolution is desired. The observed dispersion in -process yields must be accounted for. The -process dispersion in [La/Eu] is at least 0.5 dex in stars with [Eu/Fe] 0.5, though the dispersion decreases with increasing [Eu/Fe]. For the -rich stars (such as our -process standards discussed in Section 1) the La/Eu ratio is remarkably constant (to a precision of about 0.1 dex; see Section 6.2 below), indicating that when the -process fully “flows” the heavy elements are produced in relatively constant ratios.888 Furthermore, a robust -process that replicates the third -process peak (either in the HEW model or in the waiting point approximation models) completely produces the actinides, such as Th and U, resulting in relatively constant Th/Eu production values. This reaffirms the reliability of using these element pairs as chronometers.
The standard method of computing -process residuals (or “pure” - or -process ratios between two elements) is of course still adequate for assessing the relative dominance of the - or -process in a general sense, but for precision analyses greater caution is warranted.
6.2. Recognizing -process Nucleosynthesis in Metal-Poor Stars
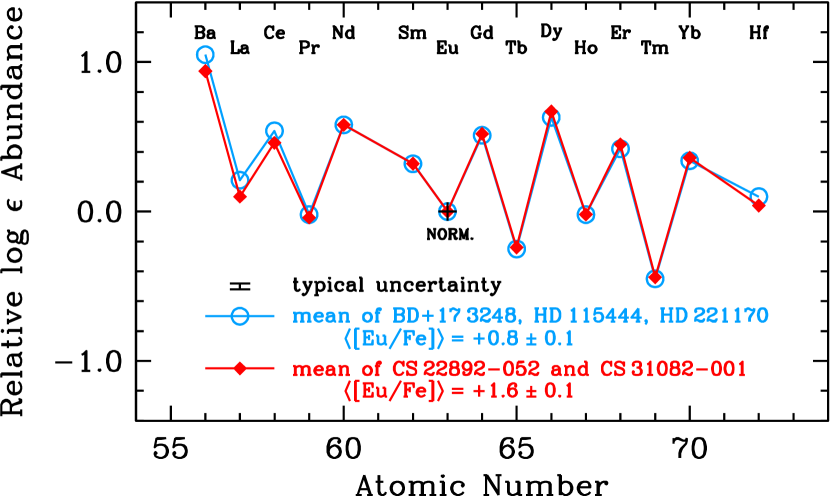
Small variations in the -process abundance pattern may be observed within the REE domain.999Here we expand the REE domain beyond the lanthanides to encompass Ba through Hf ( 56–72). For example, in Figure 10 the REE abundance distribution of 5 -process standard stars are intercompared. The lightest REE (Ba, La, and Ce) in BD 17 3248, HD 115444, and HD 221170 have higher mean abundances than the other two stars, CS 22892–052 and CS 31082–001. These are differences of 0.10 dex, while the standard deviation of the mean in each group is 0.02 dex. The first group of stars all have [Eu/Fe] 0.8 0.1 while the second group have [Eu/Fe] 1.6 0.1. The stars in the first group have metallicities [Fe/H] 2.1, 2.9, and 2.2, respectively, while the stars in the second group have metallicities [Fe/H] 2.9 and 3.1, indicating that this is not explicitly a metallicity effect. A similar effect can be observed in Figure 13 of Roederer et al. (2010a), where Ba–Nd all are slightly overabundant relative to the heavier REE. This demonstrates that even in cases where the -process produces a large overabundance of heavy material (relative to the Fe-group seeds), slight variations can be identified and characterized.
This result affirms that the heavy element abundance pattern in the star HD 126238 can be explained through enrichment by only the -process. This star, reviewed previously in Section 3, has a low Pb abundance (log (Pb/Eu) 1; Cowan et al. 1996), and thus there is no need to invoke an -process dusting of material.
One of the stars in the stellar stream analyzed by Roederer et al. (2010a), HD 175305, was included in the study of Roederer et al. (2008a) of the isotopic fractions of three REE (Nd, Sm, and Eu). The excess Ba and Ce relative to the scaled S.S. -process pattern was interpreted as evidence for an -process dusting upon a mostly -process enrichment pattern, but Roederer et al. (2010a) demonstrated that this interpretation is incorrect. An -process enrichment alone is sufficient. Consequently, the Sm and Eu isotopic fractions derived by Roederer et al. (2008a) in HD 175305 should be interpreted as the isotopic fractions produced by the -process in this case, rather than the combined yields of - and -process nucleosynthesis. Allowing for such variations could also inform the debate over the origin of the Ba isotopes in HD 140283 (Magain, 1995; Lambert & Allende Prieto, 2002; Collet et al., 2009; Gallagher et al., 2010).
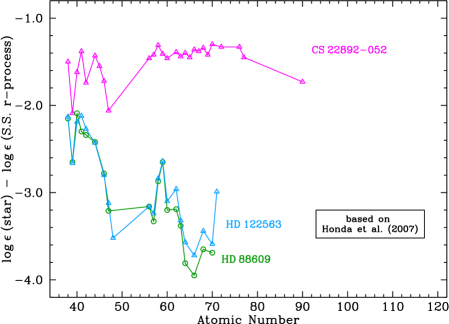
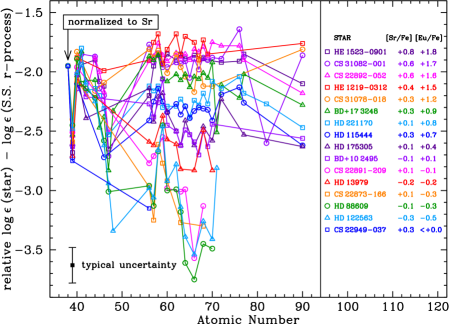
In the top panel of Figure 11, we show a plot of the distribution of the differences between the heavy element abundances and the S.S. -process residuals101010 A number of nucleosynthetic processes contribute to the production of the Sr-Y-Zr group, so the concept of -process residuals for Sr-Y-Zr is not appropriate. The -process residuals are only used for an overall normalization in Figure 11. See Section 5 for a fuller discussion of this point. for three stars (CS 22892–052, HD 88609, and HD 122563), based on Figure 5 of Honda et al. (2007). That study demonstrated clearly that the heavy element abundance pattern of the latter two stars could not be matched by any combination of scaled S.S. -process or -process patterns and was distinct from that of CS 22892–052. In the bottom panel of Figure 11 we show a similar plot for 16 stars with [Fe/H] (as well as CS 22949–037 with [Fe/H] , Depagne et al. 2002). In this panel, all abundance differences are normalized to Sr, the lightest heavy element that is easily detectable in metal-poor stars. To the best of our knowledge, these stars have not been enriched by the -process. The stars near the top of the diagram, with the smallest differences, are those strongly enriched by the -process (e.g., CS 22892–052, CS 31082–001, and HE 1523–0901), while the stars near the bottom of the diagram are those deficient in the heavy elements (e.g., HD 88609 and HD 122563). This reaffirms the conclusion of Honda et al. (2007) that the heavy element abundance pattern of CS 22892–052 is clearly distinct from that of either HD 88609 or HD 122563. The 13 other stars in Figure 11 appear to fill in the continuum between these two extremes.111111 The lack of heavy elements ( 70) in the stars in the bottom half of the bottom panel of Figure 11 is due to both the overall weakness of these species’ lines and the lack of ultra-violet (UV) spectra for all but one of these stars. The resonance lines of several heavy -capture species—including Lu ii ( 71), Os ii ( 76), Pt i ( 78), Au i ( 79), and Pb—are found in the near-UV. While there is a considerable degree of scatter about the mean difference from one element to the next in a single star, the gross effect highlighted by Figure 11 is far beyond any reasonable observational uncertainty. This illustrates again one point made in Section 5: CS 22892–052 and HD 122563 are not necessarily archetypes of two distinct -processes. Rather, they may represent the extremes of a continuous range of -process nucleosynthesis patterns—the full, main -process and an incomplete main -process—coupled with a CP nucleosynthesis component.
6.3. Heavy Element Enrichment in Metal-Poor Globular Clusters
In Figure 12 we compare the mean logarithmic Y/Eu and La/Eu ratios between field stars and 25 metal-poor globular clusters ([Fe/H] 1.4). Most abundances are adopted from the compilation of Pritzl et al. (2005), with original source references as follows:121212 Cavallo et al. (2004) have derived La and Eu abundances for 8 giants in globular cluster M80 ([Fe/H] 1.7), but Lawler et al. (2001) did not report a log() value for the one line of La examined by Cavallo et al. (2004), so we discard this cluster from our sample. Arp 2 (Mottini et al., 2008), M3 (Cohen & Meléndez, 2005a), M13 (Cohen & Meléndez, 2005a), M15 (Sobeck et al., 2010), M22 (Brown & Wallerstein, 1992; Marino et al., 2009), M30 (Shetrone et al., 2003), M54 (Brown et al., 1999), M55 (Shetrone et al., 2003), M68 (Shetrone et al., 2003), M92 (Shetrone et al., 2001), NGC 2298 (McWilliam et al., 1992), NGC 3201 (Gonzalez & Wallerstein, 1998), NGC 5694 (Lee et al., 2006), NGC 6287 (Lee & Carney, 2002), NGC 6293 (Lee & Carney, 2002), NGC 6397 (Norris & Da Costa, 1995), NGC 6541 (Lee & Carney, 2002), NGC 6752 (Yong et al., 2005), NGC 7492 (Cohen & Meléndez, 2005b), and Pal 3 (Koch et al., 2009). We also include 5 clusters associated with the Large Magellanic Cloud (LMC; 2 from Johnson et al. 2006 and 3 from Mucciarelli et al. 2010).
For all clusters except one with [Fe/H] 1.4 and detected Eu and either Y or La (or both), the relationships between the cluster means fall exactly within the range set by the field stars enriched by only -process material. Intra-cluster star-to-star variations in globular cluster M15 also follow this relation (Otsuki et al., 2006). Even in the one exception, NGC 2210 in the LMC, the [La/Eu] ratio is 0.2 dex lower than the rest of the globular clusters and field stars, indicating that the -process could not have produced these heavy elements. Pb has only been detected in 4 stars in M13 and 5 stars in NGC 6752 by Yong et al. (2006), but in these clusters it is clearly low, [Pb/Eu]0.73 and [Pb/Eu]0.48, respectively, indicating that there has been no enrichment by the -process. Two metal-poor globular clusters in this sample are associated with the Sagittarius dwarf galaxy (Arp 1 and M54, Ibata et al. 1995; Law & Majewski 2010). While the metal-rich stars in Sagittarius clearly have been enriched by the -process (e.g., Chou et al. 2010), the metal-poor stars and globular clusters appear to lack -process material. Pb, which has not been examined in any Sagittarius debris, would provide the strongest confirmation of this scenario.
While M54 likely formed elsewhere in Sagittarius and later migrated to its center (Bellazzini et al., 2008; Carretta et al., 2010), M22 may itself be the nucleated core (i.e., the central remnant after the outer layers have been stripped away) of a dwarf spheroidal galaxy (dSph) like Centauri ( Cen; Da Costa et al. 2009). If so, it should not be unreasonable to expect chemical evolution in this system. M22 shows an internal Fe spread, and the mean Y/Eu ratios are slightly different for the metal-rich and metal-poor stars in M22: [Y/Eu]0.4 for [Fe/H]1.85 0.07 and [Y/Eu]0.0 for [Fe/H]1.62 0.06 (estimated from eight stars in Figure 21 of Marino et al. 2009). Both [Y/Eu] ratios are well within the field star range in Figure 12. Unlike the other clusters shown in Figure 12, however, both groups of stars show an increase in [Y/Fe], [Ba/Fe], and [Nd/Fe] without a corresponding increase in [Eu/Fe], indicating that -process material is present in the metal-rich stars of M22.131313 Marino et al. (2009) have no M22 stars in common with Brown & Wallerstein (1992), and these studies used different Fe scales, so it is not obvious whether the stars with low [La/Eu] derived by Brown & Wallerstein (1992) belong to the metal-rich or metal-poor population. While this cautions against a blanket -process interpretation for the remaining clusters in Figure 12, to the best of our knowledge none of the other clusters (except M54) show an internal metallicity spread and thus would not be expected to show evolution in their heavy element ratios. Brown et al. (1999) examined the heavy elements in only 5 stars at the peak of the metallicity distribution of M54, so the possibility of heavy element evolution with metallicity is ripe for reexamination in this cluster. In both M22 and M54, the Pb abundance would provide an unambiguous discriminant to test this hypothesis.
6.4. The Appearance of -process Material in the ISM
Based on the observations displayed in Figure 3, we suggested that the increase in La/Eu with increasing [Fe/H] reflects the dispersion in -process nucleosynthesis rather than the onset of -process enrichment in the ISM. The Pb/Eu ratio, which should be a more robust indicator of -process enrichment, shows no upward trend in the metallicity range 2.3 [Fe/H] 1.4 (and no trend that exceeds the minimum Pb/Eu ratio expected from AGB -process production, even if this ratio has been diluted by a factor of a few). This result holds whether we consider only the stars marked by red circles or all detections in stars with [Fe/H] 1.4. The current observational data suggest that it is unlikely that the Pb in these stars originated in the -process, and -process material does not seem to have been dispersed throughout the ISM until the mean metallicity exceeds at least [Fe/H] 1.4. This is in agreement with previous investigations that used other tracers of AGB enrichment (e.g., Meléndez & Cohen 2007).
Other studies have demonstrated a clear onset of the -process in globular clusters with multiple stellar populations that may be nucleated cores of dSphs. These clusters include Cen and M22. In Cen, many stars with [Fe/H] 1.6 show [La/Eu] 0.0, our minimum AGB discriminant, indicating that this increase in [La/Eu] is not due to a dispersion in the -process ratios (Johnson & Pilachowski 2010 and references therein). Marino et al. (2009) and Da Costa et al. (2009) have demonstrated that M22 resembles Cen in that it shows an analogous increase in [Ba/Fe] and [Nd/Fe] as metallicity increases from [Fe/H] 1.8. According to the Pb/Eu ratios in our stellar sample, the onset of the -process occurs at a higher mean metallicity in the halo field stars of the Milky Way than in Cen or M22. If star formation proceeded at a higher rate in the Milky Way than in dwarf galaxies or their former nuclei, it would be very surprising if -process material produced by AGB stars should have been dispersed throughout the ISM of the Milky Way at a metallicity significantly lower than in the dSphs.
6.5. The Ubiquity of -process Material in Metal-Poor Stars
In many metal-poor stars the absorption lines of the heavy elements are so weak that only Sr and Ba may be detected. Figure 7 of Sneden et al. (2008) shows the range of [Ba/Sr] ratios observed in metal-poor stars as a function of [Ba/Fe]; these ratios are analogous to the [Y/Eu] and [Eu/Fe] ratios shown in our Figure 4. The low-C stars in their plot ([C/Fe] 0.25) likely do not contain significant amounts of -process material, and yet they span ranges of 1.5 [Ba/Sr] 0.6 and 2.0 [Ba/Fe] 1.0. The trends between Fe, Sr, and Ba are similar to those in Fe, Y, and Eu. At extremely low metallicities the Ba and Sr seem to indicate that in most cases the relationship between the light and heavy -capture elements holds. It is logical to assume (based on the arguments in Section 6.4 and the available observational data) that most of these stars are enriched by the -process. Thus it is plausible that the nucleosynthesis mechanisms described in Section 5 may operate at metallicities at least as low as [Fe/H] 4.0 (see McWilliam 1998, Honda et al. 2004, François et al. 2007, and Lai et al. 2008).
How frequently are heavy elements found in metal-poor stars? Can Sr and Ba always be detected if Mg can be detected? Barklem et al. (2005) performed an abundance analysis on a sample of 253 metal-poor field stars with a range of metallicities (3.8 [Fe/H] 1.5), effective temperatures (4300 6800 K, mostly giants and subgiants), and distances (most with 1 10 kpc). Stars with strong molecular C features or double-lined spectroscopic binaries were deliberately excluded from their sample, so the majority of the 253 stars should not be significantly enriched in -process material. Barklem et al. (2005) derived Mg abundances for 245 stars (97%), Sr abundances for 245 stars (97%), and Ba abundances for 220 stars in their sample (87%). The fraction of stars with detected Mg, Sr, and Ba increases to 100%, 99%, and 92% if only those stars with 5500 K are considered (159 stars total), and all increase to 100% if only stars with 4800 K are considered (34 stars). Thus it would seem that the occasional non-detection of Sr and Ba can be attributed to the strength of these elements’ lines relative to the continuous opacity that increases with increasing .
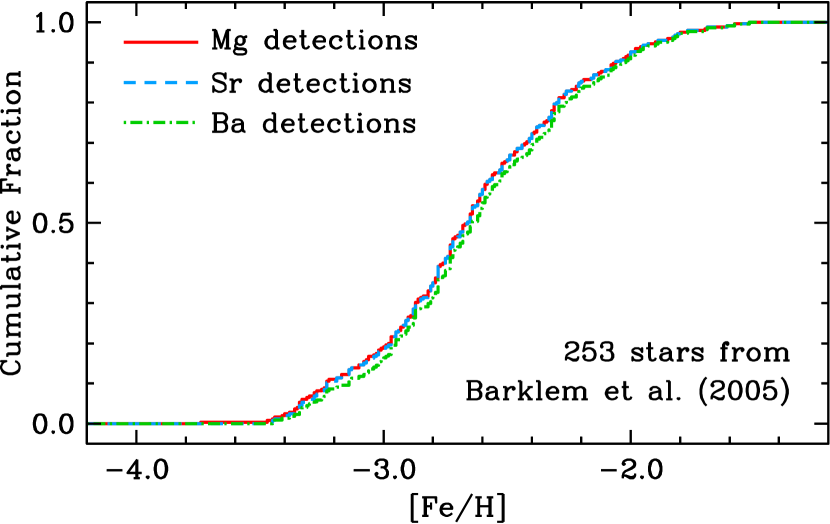
To investigate further, in Figure 13 we plot the cumulative distributions of these stars (at all values of ) as a function of [Fe/H]. These distributions are very similar. A Kolmogorov-Smirnov test confirms that each of the distributions of Mg and Sr or Mg and Ba are not significantly different at the 99.5% confidence level. This result is unchanged if the distributions are considered a function of and is insensitive to whether the and stars listed in Table 8 of Jonsell et al. (2006) are included. Thus we conclude that Sr and Ba are present in nearly all metal-poor field stars.141414 A few stars, such as Draco 119 ([Fe/H] 3.0; Fulbright et al. 2004), do not appear to have any significant accumulation of elements heavier than the Fe-group ([Sr/Fe] 2.5, [Ba/Fe] 2.6). This particular star also has /Fe ratios different from most other metal-poor stars in the halo ([Mg/Fe] 0.5, [Si/Fe] 0.2, [Ca/Fe] 0.1), and it is likely that the SN that enriched Draco 119 is different than those that enriched the majority of metal-poor field stars. If detectable quantities of -process material are not widespread in the ISM at [Fe/H] 1.4, then it seems that these stars have been enriched by the -process and associated CP nucleosynthesis (cf. Truran 1981).
6.6. Implications for Chemical Evolution:
Mixing or Variable Heavy Element Yields?
The chemical composition of our sample of -process-only stars can be summarized as follows. Numerous previous studies have shown that the elements correlate strongly with Fe in these stars, typically [/Fe] 0.2 to 0.5. Figure 4 demonstrates that there is also a correlation between [Y/Eu] and [Eu/Fe] in these stars (analogous to the correlation between [Sr/Ba] and [Ba/Fe] shown in Figure 7 of Sneden et al. 2008). Most metal-poor stars with [Fe/H] 1.4 whose atmospheres retain a fossil record of their birth composition follow this relationship, with an intrinsic scatter of a factor of 2–8 in Y/Eu that is much smaller than the factor of 30 over which the relationship extends. Nearly all of these stars contain detectable amounts of elements with 130.
The and Fe-group elements were likely produced in Type II SNe. It is unlikely that a relationship would exist among the heavy elements Y (or Sr) and Eu (or Ba) if these elements originated in separate or uncorrelated events (see also Johnson & Bolte 2002). This suggests that mixing between heavy element patterns (typified as the extreme cases CS 22892–052 and HD 122563) is not alone responsible for the range of Y/Eu or Sr/Ba ratios observed in the atmospheres of metal-poor stars. Furthermore, the relationship between [Y/Eu] and [Eu/Fe] suggests that most metal-poor stars have not been severely diluted with Fe from other events that did not produce elements heavier than the Fe-group.151515 One star, UMi COS82 ( UMi 199) with [Fe/H] 1.42 and [Eu/Fe] 1.24, appears to be an exception. A number of observational studies have shown that the metal-rich stars of the Ursa Minor dSph galaxy, including COS82, have been enriched by the products of both Type II and Type Ia SNe, as demonstrated by their reduced (relative to stars in the Milky Way halo at the same metallicities) [Si/Fe], [Ca/Fe], and [Ti/Fe] ratios (Shetrone et al., 2001; Sadakane et al., 2004; Cohen & Huang, 2010). This implies that the [Eu/Fe] ratio in the Type II contribution to the gas from which COS82 would eventually form may have been higher before additional Fe was added from the Type Ia contribution. This could explain the apparent enhancement of COS82 in the [Y/Fe] and [Eu/Fe] ratios in Figure 8 and Figure 5, respectively, relative to other stars at [Fe/H] 1.4. If we accept that the Y (or Sr) and Eu (or Ba) in these stars are produced by the -process and associated CP nucleosynthesis, the simplest explanation for the ubiquitous presence of Sr and Ba described in Section 6.5 is that the -process might also be associated with Type II SNe.
As a reminder, our use of the term “-process enriched star” in this context refers to those stars that contain at least a detectable trace of Ba and possibly heavier elements. If we assume that in the absence of -process enrichment only the -process is capable of producing detectable quantities of these heavy elements (i.e., they were not produced in a CP process), then the currently-available observational data suggest that the -process could be a common feature of nearly all Type II SN events. Of course not all -process events will produce yields that enrich the next generation of stars to resemble CS 22892–052 or CS 31082–001 (with [Eu/Fe] 1.6), but even stars with solar [Eu/Fe] ratios can have a near-perfect match between their REE abundances and the REE abundances in the strongly-enriched -process stars (see, e.g., Figure 12 of Roederer et al. 2010a). It is reasonable to suppose that the majority of -process events will enrich the next generation of stars with small amounts of -process material. We caution that the -process-only sample shown in Figure 4 is strongly biased towards -rich stars and should not be taken as an estimate of the -process yield distribution function.
Conditions within the SN wind may be variable, and therefore the -process yields will be also (perhaps due to progenitors of different mass ranges, e.g., Arnone et al. 2005), but it seems reasonable to conclude that some heavy elements are produced in nearly all Type II SN events. The variable ratio of -process to CP yields—the “strength” of the -process—provides a natural explanation for the large dispersion in [Eu/Fe] ratios around [Fe/H] 3.0 (see Figure 5). The decreased dispersion in [Eu/Fe] with increasing [Fe/H] may reflect the growing chemical homogeneity of the ISM. If so, significant mixing in the halo (progenitors’?) ISM had already occurred long before the mean metallicity at which Type Ia SNe or low-metallicity intermediate-mass AGB stars began contributing significant amounts of material to the ISM.
Type II SNe alone may be capable of producing the diversity of heavy element abundances observed in stars at [Fe/H] 3.0. Thus there is no reason to exclude the possibility that some stars at these metallicities may have been enriched by a very small number of SNe, perhaps even one. For example, Simon et al. (2010) have analyzed the abundance pattern of a star with [Fe/H] 3.2 in the low luminosity dwarf galaxy Leo IV; the abundance pattern in this star is consistent with other metal-poor field stars (i.e., -enhanced, etc.), and it does contain very low but detectable traces of Sr and Ba. This star is not strongly enriched in C ([C/Fe] 0.1), suggesting that the Ba was produced by an incomplete main -process. Given the overall low luminosity and metallicity of Leo IV, a very small total Fe abundance is present in the entire galaxy (consistent with that produced by a single SN event), and this led Simon et al. (2010) to hypothesize that a single SN may have enriched Leo IV if metals were not lost from the galaxy by winds. We encourage efforts to demonstrate that more metal-poor stars were—or were not—enriched by the yields of a single SN event, for this could place very strong constraints on the nature of the explosion and nucleosynthesis mechanisms. Furthermore, since the CP and -process yields seem to vary much more than the or Fe-group yields, these heavy elements may be a more sensitive probe of the nature of the SN progenitor than the lighter elements are.
7. Conclusions
We have compiled a sample of 161 metal-poor stars with 4.2 [Fe/H] 0.6. These stars include detections or upper limits for Zn, Y, La, Eu, or Pb, including abundances or upper limits for Pb in 120 stars. New Zn, Y, and Pb abundances are derived from the high-resolution, high-S/N spectra described in Simmerer et al. (2004) or are compiled from the literature. From this sample we identify a subset of stars that has not been enriched by the -process, and we characterize the heavy element enrichment patterns in this subset. Based on the observational data available at present, our main conclusions can be summarized as follows.
(1) The Pb/Eu ratio can be used to successfully identify metal-poor stars that lack any detectable trace of the -process. At low metallicity the -process produces large amounts of Pb relative to, e.g., Fe and Eu, and high Pb/Fe or Pb/Eu ratios are clear observational signatures of the -process in metal-poor stars. Based on models of -process nucleosynthesis in intermediate mass stars on the AGB, the minimum -process ratios predicted ([Pb/Eu] 0.3) can be used to identify stars that have not been enriched by the -process.
(2) The relationship between the light (e.g., Sr, Y, and Zr) and heavy (e.g., Ba, La, Eu, and heavier) -capture material produced by the -process can be characterized based on observations of metal-poor stars. Stars strongly enriched by the -process, such as CS 22892–052, are overabundant in the heavy elements relative to the light ones, and stars such as HD 122563 are deficient in the heavy elements (rather than overabundant in the light ones). We have culled our sample of stars that show evidence of -process enrichment, and the data for the remaining -only stars suggest that these two stars are not archetypes of two distinct -processes, but rather they may represent the extremes of a continuous range of -process nucleosynthesis patterns.
(3) We identify a dispersion of abundance ratios among the rare earth elements produced in the -process. This dispersion spans a range of at least 0.0 log (La/Eu) 0.5 (or 0.6 [La/Eu] 0.1) which cautions against using the La/Eu ratio (or similar ratios, e.g., Ba/Eu, or isotopic fractions, e.g., the Ba, Sm, or Eu isotopes) alone as a precision discriminant of - and -process nucleosynthesis contributions to a given star.
(4) The ranges in Y/Eu and La/Eu can be reproduced by nucleosynthesis predictions from simulations of the high-entropy neutrino wind (HEW) of a core-collapse SN. In these simulations the strength of the -process (the ratio Yn/Yseed) is determined by the entropy, the electron abundance, and the expansion velocity of matter in the SN. The -rich freeze-out and -delayed neutron recapture processes produce an abundance pattern for the Sr-Y-Zr group that fits the requirements for the light element primary process (LEPP). Conditions consistent with the traditional understanding of an -process (e.g., 10 n) are required to produce detectable amounts of material heavier than the 2nd -process peak, but these conditions themselves do not produce significant quantities of the lighter elements. This result reaffirms earlier suggestions that multiple processes (besides the -process) or a diversity of physical conditions in the -process must contribute to the nucleosynthesis of the Sr-Y-Zr group; thus, simple -process residuals () are inadequate descriptions of the origins of these nuclei.
(5) For the full sample of stars with [Fe/H] , the [Pb/Eu] ratios show no significant increase with increasing [Fe/H], and a number of stars with [Pb/Eu] 0.7 have metallicities as high as [Fe/H] 1.4. These observations might suggest that -process material produced in intermediate-mass stars on the AGB is not widespread in the ISM until the overall Galactic metallicity grew considerably, perhaps even to [Fe/H] 1.4. We cannot make any definitive statements about the -process at higher metallicities from this sample. The heavy elements in most stars with [Fe/H] 1.4 that have not received -process material directly from an AGB binary companion appear to have been produced by the -process (and the associated CP process).
(6) This -process enrichment pattern is common to both field stars and metal-poor globular clusters. Except for M22 and M54, the heavy -capture elements in the 23 other metal-poor ([Fe/H] 1.4) globular clusters examined here seem to have been produced by the -process (and the associated CP process), and the globular clusters follow the same -process trends observed in metal-poor field stars. Based on the currently-available observational evidence, these 23 metal-poor ([Fe/H] 1.4) Milky Way and LMC globular clusters have -capture abundance ratios that suggest significant amounts of -process material were not present in the ISM from which these cluster stars formed.
(7) At least small amounts of material heavier than the Fe-group have been detected in nearly all metal-poor stars. The light element abundance patterns (i.e., among the and Fe-group elements, 8 32) in these stars are associated with Type II core-collapse SNe. The simplest explanation for the ubiquitous presence of Sr and Ba in these stars is that the nucleosynthesis mechanisms described by our HEW model (-rich freeze-out, -delayed neutron emission and recapture, and the -process) are also present in core-collapse SNe, and at least one of these mechanisms is in operation in nearly all core-collapse SN events. In this scenario, the scatter in -capture-to-Fe ratios at [Fe/H] 3.0 may be attributed to differing strengths of -process events rather than infrequent occurrences of -process events. The -process is not a rare phenomenon: nearly all normal metal-poor stars have been enriched by the -process.
References
- Aoki et al. (2001) Aoki, W., et al. 2001, ApJ, 561, 346
- Aoki et al. (2002) Aoki, W., Ryan, S. G., Norris, J. E., Beers, T. C., Ando, H., & Tsangarides, S. 2002, ApJ, 580, 1149
- Aoki et al. (2003) Aoki, W., et al. 2003, ApJ, 592, L67
- Aoki et al. (2005) Aoki, W., et al. 2005, ApJ, 632, 611
- Aoki et al. (2007) Aoki, W., Honda, S., Sadakane, K., & Arimoto, N. 2007, PASJ, 59, L15
- Aoki & Honda (2008) Aoki, W., & Honda, S. 2008, PASJ, 60, L7
- Arlandini et al. (1999) Arlandini, C., Käppeler, F., Wisshak, K., Gallino, R., Lugaro, M., Busso, M., & Straniero, O. 1999, ApJ, 525, 886
- Arnone et al. (2005) Arnone, E., Ryan, S. G., Argast, D., Norris, J. E., & Beers, T. C. 2005, A&A, 430, 507
- Asplund et al. (2009) Asplund, M., Grevesse, N., Sauval, A. J., & Scott, P. 2009, ARA&A, 47, 481
- Barbuy et al. (2005) Barbuy, B., Spite, M., Spite, F., Hill, V., Cayrel, R., Plez, B., & Petitjean, P. 2005, A&A, 429, 1031
- Barklem et al. (2005) Barklem, P. S., et al. 2005, A&A, 439, 129
- Beers, Preston, & Shectman (1992) Beers, T. C., Preston, G. W., & Shectman, S. A. 1992, AJ, 103, 1987
- Bellazzini et al. (2008) Bellazzini, M., et al. 2008, AJ, 136, 1147
- Biémont & Godefroid (1980) Biémont, E., & Godefroid, M. 1980, A&A, 84, 361
- Biémont et al. (2000) Biémont, E., Garnir, H. P., Palmeri, P., Li, Z. S., & Svanberg, S. 2000, MNRAS, 312, 116
- Bisterzo et al. (2010) Bisterzo, S., Gallino, R., Straniero, O., Cristallo, S., Fäppeler, F. 2010, MNRAS, 404, 1529
- Boffin & Začs (1994) Boffin, H. M. J., & Začs, L. 1994, A&A, 291, 811
- Bond (1980) Bond, H. E. 1980, ApJS, 44, 517
- Brown & Wallerstein (1992) Brown, J. A., & Wallerstein, G. 1992, AJ, 104, 1818
- Brown et al. (1999) Brown, J. A., Wallerstein, G., & Gonzalez, G. 1999, AJ, 118, 1245
- Burbidge et al. (1957) Burbidge, E. M., Burbidge, G. R., Fowler, W. A., & Hoyle, F. 1957, Reviews of Modern Physics, 29, 547
- Burris et al. (2000) Burris, D. L., Pilachowski, C. A., Armandroff, T. E., Sneden, C., Cowan, J. J., & Roe, H. 2000, ApJ, 544, 302
- Burris et al. (2009) Burris, D., Lusk, J., & Jones, E. M. 2009, PASP, 121, 111
- Busso et al. (1999) Busso, M., Gallino, R., & Wasserburg, G. J. 1999, ARA&A, 37, 239
- Busso et al. (2001) Busso, M., Gallino, R., Lambert, D. L., Travaglio, C., & Smith, V. V. 2001, ApJ, 557, 802
- Cameron (1957) Cameron, A. G. W. 1957, PASP, 69, 201
- Cameron (1973) Cameron, A. G. W. 1973, Space Sci. Rev., 15, 121
- Carney et al. (2003) Carney, B. W., Latham, D. W., Stefanik, R. P., Laird, J. B., & Morse, J. A. 2003, AJ, 125, 293
- Carretta et al. (2010) Carretta, E., et al. 2010, ApJ, 714, L7
- Cavallo et al. (2004) Cavallo, R. M., Suntzeff, N. B., & Pilachowski, C. A. 2004, AJ, 127, 3411
- Cayrel et al. (2004) Cayrel, R., et al. 2004, A&A, 416, 1117
- Chou et al. (2010) Chou, M.-Y., Cunha, K., Majewski, S. R., Smith, V. V., Patterson, R. J., Martínez-Delgado, D., & Geisler, D. 2010, ApJ, 708, 1290
- Christlieb et al. (2004) Christlieb, N., et al. 2004, A&A, 428, 1027
- Clayton (1988) Clayton, D. D. 1988, MNRAS, 234, 1
- Cohen et al. (2003) Cohen, J. G., Christlieb, N., Qian, Y.-Z., & Wasserburg, G. J. 2003, ApJ, 588, 1082
- Cohen & Meléndez (2005a) Cohen, J. G., & Meléndez, J. 2005a, AJ, 129, 303
- Cohen & Meléndez (2005b) Cohen, J. G., & Meléndez, J. 2005b, AJ, 129, 1607
- Cohen et al. (2006) Cohen, J. G., et al. 2006, AJ, 132, 137
- Cohen et al. (2008) Cohen, J. G., Christlieb, N., McWilliam, A., Shectman, S., Thompson, I., Melendez, J., Wisotzki, L., & Reimers, D. 2008, ApJ, 672, 320
- Cohen & Huang (2010) Cohen, J. G., & Huang, W. 2010, ApJ, 719, 931
- Collet et al. (2009) Collet, R., Asplund, M., & Nissen, P. E. 2009, Publications of the Astronomical Society of Australia, 26, 330
- Cowan et al. (1995) Cowan, J. J., Burris, D. L., Sneden, C., McWilliam, A., & Preston, G. W. 1995, ApJ, 439, L51
- Cowan et al. (1996) Cowan, J. J., Sneden, C., Truran, J. W., & Burris, D. L. 1996, ApJ, 460, L115
- Cowan et al. (2002) Cowan, J. J., et al. 2002, ApJ, 572, 861
- Cowan et al. (2005) Cowan, J. J., et al. 2005, ApJ, 627, 238
- Cristallo et al. (2009a) Cristallo, S., Straniero, O., Gallino, R., Piersanti, L., Domínguez, I., & Lederer, M. T. 2009, ApJ, 696, 797
- Cristallo et al. (2009b) Cristallo, S., Piersanti, L., Straniero, O., Gallino, R., Domínguez, I., Käppeler, F. 2009, Publications of the Astronomical Society of Australia, 26, 139
- Cyburt et al. (2010) Cyburt, R. H., et al. 2010, ApJS, 189, 240
- Da Costa et al. (2009) Da Costa, G. S., Held, E. V., Saviane, I., & Gullieuszik, M. 2009, ApJ, 705, 1481
- Depagne et al. (2002) Depagne, E., et al. 2002, A&A, 390, 187
- Farouqi et al. (2008) Farouqi, K., Kratz, K.-L., Cowan, J. J., Mashonkina, L. I., Pfeiffer, B., Sneden, C., Thielemann, F.-K., & Truran, J. W. 2008, First Stars III, AIP, 990, 309
- Farouqi et al. (2009) Farouqi, K., Kratz, K.-L., Mashonkina, L. I., Pfeiffer, B., Cowan, J. J., Thielemann, F.-K., & Truran, J. W. 2009, ApJ, 694, L49
- Farouqi et al. (2010) Farouqi, K., Kratz, K.-L., Pfeiffer, B., Rauscher, T., Thielemann, F.-K., & Truran, J. W. 2010, ApJ, 712, 1359
- François et al. (2007) François, P., et al. 2007, A&A, 476, 935
- Frebel et al. (2007) Frebel, A., Christlieb, N., Norris, J. E., Thom, C., Beers, T. C., & Rhee, J. 2007, ApJ, 660, L117
- Fröhlich et al. (2006) Fröhlich, C., Martínez-Pinedo, G., Liebendörfer, M., Thielemann, F.-K., Bravo, E., Hix, W. R., Langanke, K., & Zinner, N. T. 2006, Physical Review Letters, 96, 142502
- Fulbright (2000) Fulbright, J. P. 2000, AJ, 120, 1841
- Fulbright et al. (2004) Fulbright, J. P., Rich, R. M., & Castro, S. 2004, ApJ, 612, 447
- Gallagher et al. (2010) Gallagher, A. J., Ryan, S. G., García Pérez, A. E., & Aoki, W. 2010, A&A, in press (arXiv:1008.3541)
- Gallino et al. (1998) Gallino, R., Arlandini, C., Busso, M., Lugaro, M., Travaglio, C., Straniero, O., Chieffi, A., & Limongi, M. 1998, ApJ, 497, 388
- Gilroy et al. (1988) Gilroy, K. K., Sneden, C., Pilachowski, C. A., & Cowan, J. J. 1988, ApJ, 327, 298
- Gonzalez & Wallerstein (1998) Gonzalez, G., & Wallerstein, G. 1998, AJ, 116, 765
- Goriely & Mowlavi (2000) Goriely, S., & Mowlavi, N. 2000, A&A, 362, 599
- Goriely & Siess (2004) Goriely, S., & Siess, L. 2004, A&A, 421, L25
- Goswami et al. (2006) Goswami, A., Aoki, W., Beers, T. C., Christlieb, N., Norris, J. E., Ryan, S. G., & Tsangarides, S. 2006, MNRAS, 372, 343
- Gratton & Sneden (1994) Gratton, R. G., & Sneden, C. 1994, A&A, 287, 927
- Hannaford et al. (1982) Hannaford, P., Lowe, R. M., Grevesse, N., Biémont, E., & Whaling, W. 1982, ApJ, 261, 736
- Hayek et al. (2009) Hayek, W., et al. 2009, A&A, 504, 511
- Herwig et al. (2003) Herwig, F., Langer, N., & Lugaro, M. 2003, ApJ, 593, 1056
- Herwig (2004) Herwig, F. 2004, ApJ, 605, 425
- Hill et al. (2002) Hill, V., et al. 2002, A&A, 387, 560
- Honda et al. (2004) Honda, S., Aoki, W., Kajino, T., Ando, H., Beers, T. C., Izumiura, H., Sadakane, K., & Takada-Hidai, M. 2004, ApJ, 607, 474
- Honda et al. (2006) Honda, S., Aoki, W., Ishimaru, Y., Wanajo, S., & Ryan, S. G. 2006, ApJ, 643, 1180
- Honda et al. (2007) Honda, S., Aoki, W., Ishimaru, Y., & Wanajo, S. 2007, ApJ, 666, 1189
- Ibata et al. (1995) Ibata, R. A., Gilmore, G., & Irwin, M. J. 1995, MNRAS, 277, 781
- Ivans et al. (2005) Ivans, I. I., Sneden, C., Gallino, R., Cowan, J. J., & Preston, G. W. 2005, ApJ, 627, L145
- Ivans et al. (2006) Ivans, I. I., Simmerer, J., Sneden, C., Lawler, J. E., Cowan, J. J., Gallino, R., & Bisterzo, S. 2006, ApJ, 645, 613
- Johnson (2002) Johnson, J. A. 2002, ApJS, 139, 219
- Johnson & Bolte (2002) Johnson, J. A., & Bolte, M. 2002, ApJ, 579, 616
- Johnson & Bolte (2004) Johnson, J. A., & Bolte, M. 2004, ApJ, 605, 462
- Johnson et al. (2006) Johnson, J. A., Ivans, I. I., & Stetson, P. B. 2006, ApJ, 640, 801
- Johnson & Pilachowski (2010) Johnson, C. I., & Pilachowski, C. A. 2010, ApJ, in press (arXiv:1008.2232)
- Jonsell et al. (2006) Jonsell, K., Barklem, P. S., Gustafsson, B., Christlieb, N., Hill, V., Beers, T. C., & Holmberg, J. 2006, A&A, 451, 651
- Käppeler et al. (1989) Käppeler, F., Beer, H., & Wisshak, K. 1989, Rep. Prog. Phys., 52, 945
- Karakas & Lattanzio (2007) Karakas, A., & Lattanzio, J. C. 2007, Publications of the Astronomical Society of Australia, 24, 103
- Karakas et al. (2009) Karakas, A. I., van Raai, M. A., Lugaro, M., Sterling, N. C., & Dinerstein, H. L. 2009, ApJ, 690, 1130
- Karakas (2010) Karakas, A. I. 2010, MNRAS, 403, 1413
- Koch et al. (2009) Koch, A., Côté, P., & McWilliam, A. 2009, A&A, 506, 729
- Kratz et al. (1993) Kratz, K.-L., Bitouzet, J.-P., Thielemann, F.-K., Möller, P., & Pfeiffer, B. 1993, ApJ, 403, 216
- Kratz et al. (2004) Kratz, K.-L., Pfeiffer, B., Cowan, J. J., & Sneden, C. 2004, New Astronomy Reviews, 48, 105
- Kratz et al. (2007) Kratz, K.-L., Farouqi, K., Pfeiffer, B., Truran, J. W., Sneden, C., & Cowan, J. J. 2007, ApJ, 662, 39
- Kratz et al. (2008a) Kratz, K.-L., Farouqi, K., Mashonkina, L. I., & Pfeiffer, B. 2008, Exotic Nuclei and Nuclear/Particle Astrophysics (II), AIP, 972, 298
- Kratz et al. (2008b) Kratz, K.-L., Farouqi, K., Mashonkina, L. I., & Pfeiffer, B. 2008, New Astronomy Review, 52, 390
- Lai et al. (2008) Lai, D. K., Bolte, M., Johnson, J. A., Lucatello, S., Heger, A., & Woosley, S. E. 2008, ApJ, 681, 1524
- Lambert & Allende Prieto (2002) Lambert, D. L., & Allende Prieto, C. 2002, MNRAS, 335, 325
- Law & Majewski (2010) Law, D. R., & Majewski, S. R. 2010, ApJ, 718, 1128
- Lawler et al. (2001) Lawler, J. E., Bonvallet, G., & Sneden, C. 2001, ApJ, 556, 452
- Lee & Carney (2002) Lee, J.-W., & Carney, B. W. 2002, AJ, 124, 1511
- Lee et al. (2006) Lee, J.-W., López-Morales, M., & Carney, B. W. 2006, ApJ, 646, L119
- Lucatello et al. (2005) Lucatello, S., Tsangarides, S., Beers, T. C., Carretta, E., Gratton, R. G., & Ryan, S. G. 2005, ApJ, 625, 825
- Lugaro et al. (2003) Lugaro, M., Herwig, F., Lattanzio, J. C., Gallino, R., & Straniero, O. 2003, ApJ, 586, 1305
- Lugaro et al. (2004) Lugaro, M., Ugalde, C., Karakas, A. I., Görres, J., Wiescher, M., Lattanzio, J. C., & Cannon, R. C. 2004, ApJ, 615, 934
- Magain (1995) Magain, P. 1995, A&A, 297, 686
- Marino et al. (2009) Marino, A. F., Milone, A. P., Piotto, G., Villanova, S., Bedin, L. R., Bellini, A., & Renzini, A. 2009, A&A, 505, 1099
- Mashonkina et al. (2008) Mashonkina, L., et al. 2008, A&A, 478, 529
- Mashonkina et al. (2010) Mashonkina, L., Christlieb, N., Barklem, P. S., Hill, V., Beers, T. C., & Velichko, A. 2010, A&A, 516, A46
- McClure et al. (1980) McClure, R. D., Fletcher, J. M., & Nemec, J. M. 1980, ApJ, 238, L35
- McClure (1983) McClure, R. D. 1983, ApJ, 268, 264
- McWilliam et al. (1992) McWilliam, A., Geisler, D., & Rich, R. M. 1992, PASP, 104, 1193
- McWilliam (1998) McWilliam, A. 1998, AJ, 115, 1640
- Meléndez & Cohen (2007) Meléndez, J., & Cohen, J. G. 2007, ApJ, 659, L25
- Montes et al. (2007) Montes, F., et al. 2007, ApJ, 671, 1685
- Mottini et al. (2008) Mottini, M., Wallerstein, G., & McWilliam, A. 2008, AJ, 136, 614
- Mucciarelli et al. (2010) Mucciarelli, A., Origlia, L., & Ferraro, F. R. 2010, ApJ, 717, 277
- Norris & Da Costa (1995) Norris, J. E., & Da Costa, G. S. 1995, ApJ, 447, 680
- Otsuki et al. (2006) Otsuki, K., Honda, S., Aoki, W., Kajino, T., & Mathews, G. J. 2006, ApJ, 641, L117
- Pfeiffer et al. (2001) Pfeiffer, B., Kratz, K.-L., Thielemann, F.-K., & Walters, W. B. 2001, Nuclear Physics A, 693, 282
- Pignatari et al. (2008) Pignatari, M., Gallino, R., Meynet, G., Hirschi, R., Herwig, F., & Wiescher, M. 2008, ApJ, 687, L95
- Plez et al. (2004) Plez, B., et al. 2004, A&A, 428, L9
- Preston & Sneden (2001) Preston, G. W., & Sneden, C. 2001, AJ, 122, 1545
- Preston (2009) Preston, G. W. 2009, Publications of the Astronomical Society of Australia, 26, 372
- Pritzl et al. (2005) Pritzl, B. J., Venn, K. A., & Irwin, M. 2005, AJ, 130, 2140
- Qian & Wasserburg (2007) Qian, Y.-Z., & Wasserburg, G. J. 2007, Phys. Rep., 442, 237
- Qian & Wasserburg (2008) Qian, Y.-Z., & Wasserburg, G. J. 2008, ApJ, 687, 272
- Raiteri et al. (1993) Raiteri, C. M., Gallino, R., Busso, M., Neuberger, D., & Kaeppeler, F. 1993, ApJ, 419, 207
- Roederer et al. (2008a) Roederer, I. U., Lawler, J. E., Sneden, C., Cowan, J. J., Sobeck, J. S., & Pilachowski, C. A. 2008a, ApJ, 675, 723
- Roederer et al. (2008b) Roederer, I. U., et al. 2008b, ApJ, 679, 1549
- Roederer et al. (2009) Roederer, I. U., Kratz, K.-L., Frebel, A., Christlieb, N., Pfeiffer, B., Cowan, J. J., & Sneden, C. 2009, ApJ, 698, 1963
- Roederer et al. (2010a) Roederer, I. U., Sneden, C., Thompson, I. B., Preston, G. W., & Shectman, S. A. 2010a, ApJ, 711, 573
- Roederer et al. (2010b) Roederer, I. U., Sneden, C., Lawler, J. E., & Cowan, J. J. 2010b, ApJ, 714, L123
- Sadakane et al. (2004) Sadakane, K., Arimoto, N., Ikuta, C., Aoki, W., Jablonka, P., & Tajitsu, A. 2004, PASJ, 56, 1041
- Shetrone et al. (2001) Shetrone, M. D., Côté, P., & Sargent, W. L. W. 2001, ApJ, 548, 592
- Shetrone et al. (2003) Shetrone, M., Venn, K. A., Tolstoy, E., Primas, F., Hill, V., & Kaufer, A. 2003, AJ, 125, 684
- Siess et al. (2004) Siess, L., Goriely, S., & Langer, N. 2004, A&A, 415, 1089
- Simmerer et al. (2004) Simmerer, J., Sneden, C., Cowan, J. J., Collier, J., Woolf, V. M., & Lawler, J. E. 2004, ApJ, 617, 1091
- Simon et al. (2010) Simon, J. D., Frebel, A., McWilliam, A., Kirby, E. N., & Thompson, I. B. 2010, ApJ, 716, 446
- Sneden (1973) Sneden, C. A. 1973, Ph.D. Thesis, Univ. of Texas at Austin
- Sneden & Parthasarathy (1983) Sneden, C., & Parthasarathy, M. 1983, ApJ, 267, 757
- Sneden & Pilachowski (1985) Sneden, C., & Pilachowski, C. A. 1985, ApJ, 288, L55
- Sneden et al. (1994) Sneden, C., Preston, G. W., McWilliam, A., & Searle, L. 1994, ApJ, 431, L27
- Sneden et al. (1996) Sneden, C., McWilliam, A., Preston, G. W., Cowan, J. J., Burris, D. L., & Armosky, B. J. 1996, ApJ, 467, 819
- Sneden et al. (2003) Sneden, C., et al. 2003, ApJ, 591, 936
- Sneden et al. (2008) Sneden, C., Cowan, J. J., & Gallino, R. 2008, ARA&A, 46, 241
- Sneden et al. (2009) Sneden, C., Lawler, J. E., Cowan, J. J., Ivans, I. I., & Den Hartog, E. A. 2009, ApJS, 182, 80
- Sobeck et al. (2010) Sobeck, J. S., et al. 2010, in prep.
- Suijs et al. (2008) Suijs, M. P. L., Langer, N., Poelarends, A.-J., Yoon, S.-C., Heger, A., & Herwig, F. 2008, A&A, 481, L87
- Thompson (2003) Thompson, T. A. 2003, ApJ, 585, L33
- Thompson et al. (2008) Thompson, I. B., et al. 2008, ApJ, 677, 556
- Travaglio et al. (2001) Travaglio, C., Gallino, R., Busso, M., & Gratton, R. 2001, ApJ, 549, 346
- Travaglio et al. (2004) Travaglio, C., Gallino, R., Arnone, E., Cowan, J., Jordan, F., & Sneden, C. 2004, ApJ, 601, 864
- Truran (1981) Truran, J. W. 1981, A&A, 97, 391
- Truran et al. (2002) Truran, J. W., Cowan, J. J., Pilachowski, C. A., & Sneden, C. 2002, PASP, 114, 1293
- Tull et al. (1995) Tull, R. G., MacQueen, P. J., Sneden, C., & Lambert, D. L. 1995, PASP, 107, 251
- Van Eck et al. (2003) Van Eck, S., Goriely, S., Jorissen, A., & Plez, B. 2003, A&A, 404, 291
- Wanajo et al. (2002) Wanajo, S., Itoh, N., Ishimaru, Y., Nozawa, S., & Beers, T. C. 2002, ApJ, 577, 853
- Wasserburg et al. (1996) Wasserburg, G. J., Busso, M., & Gallino, R. 1996, ApJ, 466, L109
- Westin et al. (2000) Westin, J., Sneden, C., Gustafsson, B., & Cowan, J. J. 2000, ApJ, 530, 783
- Woodward et al. (2008) Woodward, P., Herwig, F., Porter, D., Fuchs, T., Nowatzki, A., & Pignatari, M. 2008, First Stars III, 990, 300
- Woosley et al. (1994) Woosley, S. E., Wilson, J. R., Mathews, G. J., Hoffman, R. D., & Meyer, B. S. 1994, ApJ, 433, 229
- Woosley & Janka (2005) Woosley, S., & Janka, T. 2005, Nature Physics, 1, 147
- Yong et al. (2005) Yong, D., Grundahl, F., Nissen, P. E., Jensen, H. R., & Lambert, D. L. 2005, A&A, 438, 875
- Yong et al. (2006) Yong, D., Aoki, W., Lambert, D. L., & Paulson, D. B. 2006, ApJ, 639, 918
- Yong et al. (2008a) Yong, D., Lambert, D. L., Paulson, D. B., & Carney, B. W. 2008, ApJ, 673, 854
- Yong et al. (2008b) Yong, D., Karakas, A. I., Lambert, D. L., Chieffi, A., & Limongi, M. 2008, 689, 1031
| Star | Zn i | Zn i | Y ii | Y ii | Y ii | Star | Zn i | Zn i | Y ii | Y ii | Y ii | |
|---|---|---|---|---|---|---|---|---|---|---|---|---|
| 4722Å | 4810Å | 4833Å | 5087Å | 5200Å | 4722Å | 4810Å | 4833Å | 5087Å | 5200Å | |||
| (mÅ) | (mÅ) | (mÅ) | (mÅ) | (mÅ) | (mÅ) | (mÅ) | (mÅ) | (mÅ) | (mÅ) | |||
| BD01 0306 | 38.7 | 45.9 | 34.4 | 24.0 | 14.7 | HD 25532 | 49.4 | 57.9 | 74.6 | 54.7 | 40.8 | |
| BD01 2582 | 15.5 | 17.6 | 31.0 | 20.4 | 11.6 | HD 26297 | 46.6 | 52.7 | 70.8 | 55.9 | 47.2 | |
| BD19 1185 | 28.7 | 33.7 | 25.1 | 13.7 | 11.8 | HD 29574 | 49.9 | 51.2 | 97.0 | 76.1 | 68.2 | |
| BD52 1601 | 65.4 | 69.4 | 78.5 | 62.1 | 50.9 | HD 37828 | 57.6 | 62.6 | 94.3 | 74.4 | 71.7 | |
| G005-001 | 31.0 | 38.0 | 20.9 | 11.7 | 7.2 | HD 44007 | 39.6 | 46.0 | 58.0 | 43.0 | 34.3 | |
| G009-036 | 27.7 | 28.6 | 25.0 | 25.0 | 9.2 | HD 63791 | 43.0 | 50.6 | 61.1 | 46.8 | 36.3 | |
| G017-025 | 29.3 | 34.7 | 34.6 | 19.4 | HD 74462 | 54.2 | 58.2 | 70.8 | 55.5 | 46.0 | ||
| G023-014 | 32.5 | 38.8 | 29.7 | 26.4 | 19.1 | HD 82590 | 19.5 | 25.3 | 48.0 | 28.3 | 17.4 | |
| G028-043 | 13.7 | 19.7 | 16.5 | 5.8 | HD 85773 | 46.1 | 52.4 | 40.5 | 25.3 | |||
| G029-025 | 45.0 | 47.6 | 35.9 | 22.3 | 18.1 | HD 88609 | 9.3 | 14.9 | 23.0 | 8.2 | ||
| G040-008 | 44.7 | 50.5 | 31.6 | 19.2 | 16.6 | HD 101063 | 41.9 | 47.7 | 51.7 | 36.5 | 29.6 | |
| G058-025 | 17.4 | 19.4 | 10.5 | 6.2 | HD 103036 | 68.0 | 74.0 | 123.4 | 97.1 | 87.0 | ||
| G059-001 | 43.8 | 48.9 | 34.5 | 18.9 | 17.6 | HD 103545 | 17.4 | 23.2 | 32.6 | 22.3 | 12.4 | |
| G063-046 | 48.0 | 54.4 | 38.0 | 27.9 | 18.7 | HD 105546 | 46.6 | 57.4 | 61.3 | 47.8 | 37.1 | |
| G068-003 | 61.6 | 64.4 | 53.8 | 40.1 | 36.4 | HD 105755 | 54.8 | 59.7 | 42.0 | 29.4 | 19.8 | |
| G074-005 | 36.0 | 43.5 | 25.4 | 15.5 | 11.1 | HD 106516 | 42.2 | 47.9 | 32.5 | 23.7 | 13.1 | |
| G090-025 | 11.1 | 14.9 | 9.1 | 3.7 | HD 107752 | 13.0 | 11.6 | 16.2 | 10.7 | |||
| G095-057A | 36.9 | 43.4 | 47.9 | 31.1 | HD 108317 | 12.8 | 16.2 | 17.8 | 8.9 | 4.2 | ||
| G095-057B | 33.7 | 38.4 | 29.0 | HD 110184 | 29.4 | 33.4 | 59.5 | 42.4 | 32.7 | |||
| G102-020 | 29.7 | 34.6 | 22.3 | 12.6 | HD 115444 | 6.7 | 10.2 | 13.9 | 8.5 | 4.3 | ||
| G102-027 | 66.7 | 70.2 | 56.1 | 42.3 | 35.0 | HD 121135 | 60.9 | 66.9 | 78.5 | 57.7 | 44.5 | |
| G113-022 | 40.1 | 44.8 | 47.0 | 33.9 | 25.3 | HD 122563 | 13.5 | 19.6 | 24.2 | 14.0 | 6.9 | |
| G122-051 | 19.7 | 25.1 | 21.6 | 9.4 | HD 122956 | 46.0 | 51.3 | 66.5 | 48.2 | 42.3 | ||
| G123-009 | 28.5 | 32.6 | 31.4 | 18.3 | 14.0 | HD 124358 | 37.0 | 43.5 | 48.9 | 30.9 | 21.2 | |
| G126-036 | 37.9 | 44.8 | 45.2 | 34.5 | 26.3 | HD 132475 | 23.0 | 29.7 | 32.7 | 20.8 | 13.9 | |
| G126-062 | 10.5 | 16.1 | 12.4 | 5.4 | 3.7 | HD 135148 | 55.7 | 55.5 | 96.1 | 67.9 | 59.8 | |
| G140-046 | 35.6 | 41.7 | 54.2 | 33.3 | HD 141531 | 48.7 | 55.5 | 80.0 | 61.4 | 53.1 | ||
| G153-021 | 57.6 | 62.1 | 43.3 | 38.4 | 19.0 | HD 166161 | 61.4 | 67.9 | 87.3 | 69.6 | 56.0 | |
| G176-053 | 19.5 | 22.9 | 14.4 | 8.6 | 5.3 | HD 171496 | 78.9 | 80.5 | 81.0 | 68.0 | 60.4 | |
| G179-022 | 38.4 | 47.5 | 47.0 | 32.9 | 25.3 | HD 184266 | 26.2 | 35.0 | 52.6 | 29.6 | 13.8 | |
| G180-024 | 15.9 | 23.2 | 16.1 | 9.8 | 5.8 | HD 186478 | 19.6 | 24.8 | 40.4 | 27.5 | 16.8 | |
| G188-022 | 19.7 | 28.2 | 28.2 | 16.2 | 10.3 | HD 187111 | 50.5 | 55.2 | 80.4 | 64.9 | 59.1 | |
| G191-055 | 8.0 | 11.9 | 6.2 | HD 188510 | 13.2 | 18.4 | 9.7 | 6.3 | ||||
| G192-043 | 14.6 | 17.2 | 13.8 | 7.9 | HD 193901 | 25.0 | 31.3 | 21.0 | 11.6 | 7.1 | ||
| G221-007 | 44.3 | 49.3 | 42.8 | 32.5 | 29.2 | HD 194598 | 23.7 | 28.2 | 21.4 | 14.2 | 7.2 | |
| HD 2665 | 19.3 | 25.4 | 19.8 | 10.8 | 5.8 | HD 201891 | 30.5 | 36.4 | 23.5 | 13.5 | 7.7 | |
| HD 3008 | 51.4 | 53.3 | 83.0 | 66.0 | 54.5 | HD 206739 | 49.1 | 55.2 | 69.8 | 52.6 | 45.7 | |
| HD 6755 | 28.7 | 36.7 | 36.1 | 25.5 | 17.0 | HD 210295 | 56.0 | 60.3 | 73.2 | 56.8 | 48.8 | |
| HD 6833 | 63.6 | 64.8 | 85.9 | 67.8 | HD 214362 | 14.2 | 18.6 | 37.0 | 20.6 | 8.2 | ||
| HD 21581 | 38.9 | 45.2 | 54.3 | 41.5 | 32.3 | HD 218857 | 21.2 | 30.6 | 22.5 | 14.2 | 8.5 | |
| HD 23798 | 35.2 | 39.9 | 70.4 | 52.3 | 45.6 | HD 233666 | 33.9 | 42.1 | 48.4 | 36.2 | 21.9 | |
| HD 25329 | 12.4 | 14.0 | 23.5 | 10.9 |
| Star | [Fe/H] | Ref. | log (Zn i) | log (Y ii) | log (La ii) | log (Eu ii) | log (Pb i) | Ref. | ClassaaClassifications: (1) log (Pb/Eu) 1.8; (2) member of the stellar stream analyzed by Roederer et al. (2010a); (3) log (Pb/Eu) , as well as HD 88609 and HD 122563; (0) none of 1–3 or [Fe/H] 1.4. |
|---|---|---|---|---|---|---|---|---|---|
| BD01 0306 | 1.13 | 29 | 3.57 | 1.05 | 0.12 | 0.27 | 1.20 | 29, 36 | 0 |
| BD01 2582 | 2.21 | 29 | 2.51 | 0.17 | 0.05 | 1.03 | 0.77 | 29, 36 | 0 |
| BD18 5550 | 3.05 | 20 | 1.94 | 1.81 | 2.52 | 2.81 | 20 | 0 | |
| BD01 2916 | 1.92 | 2 | 0.21 | 0.87 | 1.22 | 0.20 | 2, 4 | 1 | |
| BD04 2621 | 2.52 | 20 | 0.69 | 2.29 | 2.63 | 20 | 0 | ||
| BD06 0648 | 2.14 | 2 | 0.09 | 0.95 | 1.50 | 0.00 | 2, 4 | 1 | |
| BD08 2856 | 2.12 | 20 | 2.59 | 0.15 | 1.03 | 1.16 | 20 | 0 | |
| BD10 2495 | 2.31 | 26 | 2.32. | 0.52 | 1.36 | 1.69 | 0.88 | 26 | 2 |
| BD17 3248 | 2.08 | 8 | 2.58 | 0.04 | 0.55 | 0.78 | 0.27 | 8, 25 | 1 |
| BD19 1185 | 1.09 | 29 | 3.38 | 0.85 | 0.06 | 0.23 | 0.77 | 29, 36 | 0 |
| BD29 2356 | 1.59 | 26 | 3.05 | 0.52 | 0.47 | 0.69 | 0.35 | 26 | 2 |
| BD30 2611 | 1.50 | 26 | 2.87 | 0.41 | 0.24 | 0.36 | 0.56 | 26 | 2 |
| BD52 1601 | 1.40 | 29 | 3.35 | 0.71 | 0.13 | 0.51 | 0.60 | 29, 36 | 0 |
| BS 16477–003 | 3.36 | 6 | 1.42 | 1.20 | 6, 10 | 0 | |||
| BS 17569–049 | 2.88 | 6 | 1.95 | 0.63 | 1.40 | 1.64 | 6, 10 | 0 | |
| CD36 1052 | 1.79 | 26 | 2.88 | 0.34 | 0.40 | 0.82 | 2.47 | 26 | 2 |
| CD38 0245 | 4.19 | 6 | 1.10 | 2.43 | 6, 10 | 0 | |||
| CS 22169–035 | 3.04 | 6 | 1.66 | 1.21 | 6, 10 | 0 | |||
| CS 22172–002 | 3.86 | 6 | 1.23 | 2.63 | 6, 10 | 0 | |||
| CS 22186–025 | 3.00 | 6 | 1.92 | 1.10 | 1.71 | 1.94 | 6, 10 | 0 | |
| CS 22189–009 | 3.49 | 6 | 1.57 | 2.11 | 6, 10 | 0 | |||
| CS 22873–055 | 2.99 | 6 | 1.87 | 1.31 | 2.36 | 2.64 | 6, 10 | 0 | |
| CS 22873–166 | 2.97 | 6 | 1.81 | 0.89 | 2.64 | 2.75 | 6, 10 | 0 | |
| CS 22878–101 | 3.25 | 6 | 1.75 | 1.32 | 2.57 | 2.79 | 6, 10 | 0 | |
| CS 22891–209 | 3.29 | 6 | 1.76 | 1.18 | 2.47 | 2.86 | 6, 10 | 0 | |
| CS 22892–052 | 3.10 | 30 | 1.59 | 0.42 | 0.87 | 0.96 | 0.15 | 25, 30 | 3 |
| CS 22896–154 | 2.69 | 6 | 2.17 | 0.33 | 1.17 | 1.31 | 6, 10 | 0 | |
| CS 22897–008 | 3.41 | 6 | 1.86 | 1.08 | 6, 10 | 0 | |||
| CS 22948–066 | 3.14 | 6 | 1.83 | 1.98 | 6, 10 | 0 | |||
| CS 22952–015 | 3.43 | 6 | 1.42 | 2.12 | 6, 10 | 0 | |||
| CS 22953–003 | 2.84 | 6 | 1.91 | 0.49 | 1.08 | 1.27 | 6, 10 | 0 | |
| CS 22956–050 | 3.33 | 6 | 1.57 | 1.61 | 6, 10 | 0 | |||
| CS 22966–057 | 2.62 | 6 | 2.24 | 0.67 | 1.27 | 1.69 | 6, 10 | 0 | |
| CS 22968–014 | 3.56 | 6 | 1.46 | 2.57 | 6, 10 | 0 | |||
| CS 29491–053 | 3.04 | 6 | 1.83 | 1.14 | 2.94 | 6, 10 | 0 | ||
| CS 29491–069 | 2.60 | 14 | 2.30 | 0.17 | 0.75 | 0.96 | 0.35 | 14, 25 | 1 |
| CS 29495–041 | 2.82 | 6 | 1.93 | 1.02 | 2.17 | 2.39 | 6, 10 | 0 | |
| CS 29497–004 | 2.66 | 7 | 2.20 | 0.30 | 0.38 | 0.45 | 7, 21 | 0 | |
| CS 29516–024 | 3.06 | 6 | 1.74 | 1.59 | 2.57 | 2.79 | 6, 10 | 0 | |
| CS 29518–051 | 2.78 | 6 | 2.17 | 0.63 | 2.17 | 6, 10 | 0 | ||
| CS 30306–132 | 2.42 | 16 | 0.07 | 0.78 | 1.02 | 0.50 | 16 | 1 | |
| CS 31078–018 | 2.84 | 22 | 2.13 | 0.43 | 1.00 | 1.17 | 0.25 | 22 | 1 |
| CS 31082–001 | 2.90 | 15 | 1.88 | 0.23 | 0.62 | 0.72 | 0.55 | 15, 24, 31 | 3 |
| G005-001 | 1.24 | 29 | 3.50 | 0.73 | 0.09 | 0.38 | 1.35 | 29, 36 | 0 |
| G009-036 | 1.17 | 29 | 3.14 | 0.31 | 0.26 | 0.16 | 1.25 | 29, 36 | 0 |
| G017-025 | 1.54 | 29 | 3.40 | 0.87 | 0.64 | 29, 36 | 0 | ||
| G023-014 | 1.64 | 29 | 3.05 | 0.46 | 0.33 | 0.58 | 0.75 | 29, 36 | 1 |
| G028-043 | 1.64 | 29 | 3.03 | 0.39 | 0.22 | 0.53 | 0.69 | 29, 36 | 1 |
| G029-025 | 1.09 | 29 | 3.81 | 1.14 | 0.19 | 0.23 | 0.80 | 29, 36 | 0 |
| G040-008 | 0.97 | 29 | 3.90 | 1.05 | 1.13 | 29, 36 | 0 | ||
| G058-025 | 1.40 | 29 | 3.20 | 0.76 | 0.03 | 0.66 | 1.29 | 29, 36 | 0 |
| G059-001 | 0.95 | 29 | 4.04 | 1.23 | 0.13 | 0.29 | 1.64 | 29, 36 | 0 |
| G063-046 | 0.90 | 29 | 3.86 | 1.26 | 0.27 | 0.05 | 1.65 | 29, 36 | 0 |
| G068-003 | 0.76 | 29 | 4.12 | 1.35 | 0.49 | 0.16 | 1.19 | 29, 36 | 0 |
| G074-005 | 1.05 | 29 | 3.56 | 0.92 | 0.11 | 0.23 | 1.35 | 29, 36 | 0 |
| G090-025 | 1.78 | 29 | 2.83 | 0.11 | 0.51 | 0.97 | 0.90 | 29, 36 | 0 |
| G095-057A | 1.22 | 29 | 3.70 | 1.34 | 0.43 | 0.23 | 1.14 | 29, 36 | 0 |
| G095-057B | 1.06 | 29 | 3.74 | 1.30 | 1.39 | 29, 36 | 0 | ||
| G102-020 | 1.25 | 29 | 3.47 | 0.78 | 0.02 | 0.32 | 0.79 | 29, 36 | 0 |
| G102-027 | 0.59 | 29 | 4.36 | 1.62 | 0.69 | 0.40 | 1.64 | 29, 36 | 0 |
| G113-022 | 1.18 | 29 | 3.64 | 1.38 | 0.42 | 0.13 | 1.19 | 29, 36 | 0 |
| G122-051 | 1.43 | 29 | 3.26 | 0.58 | 0.10 | 0.27 | 0.34 | 29, 36 | 3 |
| G123-009 | 1.25 | 29 | 3.45 | 1.15 | 0.21 | 0.21 | 1.13 | 29, 36 | 0 |
| G126-036 | 1.06 | 29 | 3.76 | 1.59 | 0.87 | 0.04 | 1.67 | 29, 36 | 0 |
| G126-062 | 1.59 | 29 | 2.86 | 0.36 | 1.55 | 29, 36 | 0 | ||
| G140-046 | 1.30 | 29 | 3.65 | 1.46 | 0.54 | 0.41 | 1.19 | 29, 36 | 0 |
| G153-021 | 0.70 | 29 | 4.06 | 1.46 | 0.59 | 0.34 | 1.65 | 29, 36 | 0 |
| G176-053 | 1.34 | 29 | 3.18 | 0.63 | 0.08 | 0.32 | 1.05 | 29, 36 | 0 |
| G179-022 | 1.35 | 29 | 3.34 | 0.79 | 0.02 | 0.22 | 0.39 | 29, 36 | 0 |
| G180-024 | 1.34 | 29 | 3.23 | 0.72 | 0.19 | 0.58 | 1.65 | 29, 36 | 0 |
| G188-022 | 1.52 | 29 | 3.24 | 0.94 | 0.12 | 0.60 | 1.30 | 29, 36 | 0 |
| G191-055 | 1.63 | 29 | 2.78 | 0.23 | 0.41 | 0.89 | 1.10 | 29, 36 | 0 |
| G192-043 | 1.50 | 29 | 3.12 | 0.71 | 0.02 | 0.25 | 1.60 | 29, 36 | 0 |
| G221-007 | 0.98 | 29 | 3.65 | 1.02 | 0.28 | 0.11 | 1.69 | 29, 36 | 0 |
| HD 2665 | 1.99 | 29 | 2.49 | 0.42 | 0.92 | 1.15 | 0.30 | 29, 36 | 1 |
| HD 2796 | 2.47 | 6 | 2.37 | 0.51 | 1.47 | 1.84 | 6, 10 | 0 | |
| HD 8724 | 1.91 | 29 | 2.90 | 0.25 | 0.49 | 0.86 | 0.00 | 29, 36 | 3 |
| HD 3008 | 2.08 | 29 | 2.52 | 0.30 | 0.79 | 1.09 | 0.56 | 29, 36 | 3 |
| HD 6268 | 2.42 | 9 | 0.38 | 1.05 | 1.37 | 0.08 | 16, 25 | 1 | |
| HD 6755 | 1.68 | 29 | 2.87 | 0.31 | 0.29 | 0.50 | 0.32 | 29, 36 | 3 |
| HD 6833 | 0.85 | 29 | 3.77 | 1.22 | 0.34 | 0.10 | 1.69 | 29, 36 | 0 |
| HD 13979 | 2.92 | 27 | 1.79 | 1.30 | 2.30 | 2.59 | 0.45 | 27 | 0 |
| HD 21581 | 1.71 | 29 | 2.99 | 0.44 | 0.42 | 0.81 | 0.50 | 29, 36 | 1 |
| HD 23798 | 2.26 | 29 | 2.39 | 0.19 | 1.01 | 1.36 | 0.21 | 29, 36 | 1 |
| HD 25329 | 1.67 | 29 | 3.00 | 0.67 | 0.05 | 29, 36 | 0 | ||
| HD 25532 | 1.34 | 29 | 3.52 | 1.05 | 0.13 | 0.64 | 1.15 | 29, 36 | 0 |
| HD 26297 | 1.98 | 29 | 3.07 | 0.40 | 0.85 | 1.22 | 0.11 | 29, 36 | 1 |
| HD 29574 | 2.00 | 29 | 2.67 | 0.19 | 0.37 | 0.63 | 0.06 | 29, 36 | 3 |
| HD 37828 | 1.62 | 29 | 3.18 | 0.70 | 0.12 | 0.53 | 0.77 | 29, 36 | 1 |
| HD 44007 | 1.72 | 29 | 2.83 | 0.26 | 0.51 | 0.94 | 0.31 | 29, 36 | 1 |
| HD 63791 | 1.90 | 29 | 2.87 | 0.23 | 0.55 | 0.92 | 0.22 | 29, 36 | 1 |
| HD 74462 | 1.52 | 29 | 3.12 | 0.51 | 0.17 | 0.39 | 0.49 | 29, 36 | 3 |
| HD 82590 | 1.32 | 29 | 3.03 | 0.71 | 0.11 | 0.46 | 1.60 | 29, 36 | 0 |
| HD 85773 | 2.62 | 29 | 2.56 | 0.93 | 1.56 | 1.84 | 0.15 | 29, 36 | 1 |
| HD 88609 | 3.07 | 18 | 1.77 | 0.97 | 2.75 | 2.89 | 25, 36 | 3 | |
| HD 101063 | 1.33 | 29 | 3.30 | 0.85 | 0.21 | 0.00 | 1.10 | 29, 36 | 0 |
| HD 103036 | 2.04 | 29 | 2.80 | 0.13 | 0.62 | 1.09 | 0.10 | 29, 36 | 1 |
| HD 103545 | 2.45 | 29 | 2.20 | 0.50 | 1.18 | 1.56 | 0.05 | 29, 36 | 1 |
| HD 105546 | 1.48 | 29 | 3.29 | 0.74 | 0.13 | 0.56 | 0.80 | 29, 36 | 1 |
| HD 105755 | 0.83 | 29 | 3.98 | 1.18 | 0.33 | 0.02 | 1.43 | 29, 36 | 0 |
| HD 106516 | 0.81 | 29 | 3.94 | 1.28 | 0.31 | 0.04 | 1.56 | 29, 36 | 0 |
| HD 107752 | 2.78 | 29 | 1.93 | 0.90 | 1.59 | 1.99 | 0.30 | 29, 36 | 0 |
| HD 108317 | 2.18 | 29 | 2.40 | 0.39 | 1.01 | 1.32 | 0.17 | 25, 36 | 1 |
| HD 108577 | 2.38 | 20 | 2.56 | 0.52 | 1.24 | 1.48 | 20 | 0 | |
| HD 110184 | 2.72 | 29 | 2.14 | 0.65 | 1.47 | 1.71 | 0.20 | 29, 36 | 1 |
| HD 115444 | 2.90 | 29 | 1.90 | 0.82 | 1.42 | 1.64 | 0.45 | 25, 36 | 1 |
| HD 119516 | 2.26 | 26 | 2.32 | 0.43 | 1.08 | 1.43 | 1.52 | 26 | 2 |
| HD 121135 | 1.54 | 29 | 3.37 | 0.69 | 0.33 | 0.70 | 0.38 | 29, 36 | 1 |
| HD 122563 | 2.77 | 17 | 1.97 | 0.92 | 2.40 | 2.75 | 0.42 | 25, 36 | 3 |
| HD 122956 | 1.95 | 29 | 2.87 | 0.16 | 0.48 | 0.79 | 0.13 | 29, 36 | 3 |
| HD 124358 | 1.91 | 29 | 2.64 | 0.22 | 0.68 | 0.94 | 0.45 | 29, 36 | 1 |
| HD 126587 | 2.93 | 9 | 0.53 | 1.75 | 1.97 | 0.38 | 16, 25 | 1 | |
| HD 128279 | 2.51 | 26 | 2.15 | 1.04 | 1.77 | 2.27 | 1.05 | 26 | 2 |
| HD 132475 | 1.86 | 29 | 2.96 | 0.56 | 0.38 | 0.92 | 1.00 | 29, 36 | 0 |
| HD 135148 | 2.17 | 29 | 2.58 | 0.25 | 0.76 | 0.95 | 0.17 | 29, 36 | 3 |
| HD 141531 | 1.79 | 29 | 2.79 | 0.11 | 0.45 | 0.72 | 0.20 | 29, 36 | 1 |
| HD 166161 | 1.23 | 29 | 3.46 | 1.11 | 0.23 | 0.48 | 0.84 | 29, 36 | 0 |
| HD 171496 | 0.67 | 29 | 4.11 | 1.40 | 0.51 | 0.11 | 1.41 | 29, 36 | 0 |
| HD 175305 | 1.73 | 26 | 2.96 | 0.30 | 0.60 | 0.89 | 0.28 | 25, 26 | 3 |
| HD 184266 | 1.43 | 29 | 3.19 | 0.69 | 0.11 | 0.43 | 1.60 | 29, 36 | 0 |
| HD 186478 | 2.56 | 29 | 2.23 | 0.45 | 1.32 | 1.53 | 0.26 | 25, 36 | 1 |
| HD 187111 | 1.97 | 29 | 2.84 | 0.16 | 0.57 | 0.88 | 0.10 | 29, 36 | 3 |
| HD 188510 | 1.32 | 29 | 3.01 | 0.44 | 0.14 | 0.52 | 1.20 | 29, 36 | 0 |
| HD 193901 | 1.08 | 29 | 3.36 | 0.83 | 0.19 | 0.10 | 1.45 | 29, 36 | 0 |
| HD 194598 | 1.08 | 29 | 3.40 | 0.90 | 0.08 | 0.28 | 1.40 | 29, 36 | 0 |
| HD 201891 | 1.09 | 29 | 3.55 | 0.88 | 0.12 | 0.22 | 1.25 | 29, 36 | 0 |
| HD 204543 | 1.87 | 29 | 0.12 | 0.63 | 1.05 | 0.05 | 5, 25 | 1 | |
| HD 206739 | 1.72 | 29 | 2.98 | 0.36 | 0.32 | 0.62 | 0.38 | 29, 36 | 1 |
| HD 210295 | 1.46 | 29 | 3.37 | 0.85 | 0.10 | 0.34 | 0.72 | 29, 36 | 1 |
| HD 214362 | 1.87 | 29 | 2.71 | 0.32 | 0.48 | 0.82 | 1.00 | 29, 36 | 0 |
| HD 214925 | 2.08 | 2 | 0.86 | 1.09 | 0.50 | 2 | 3 | ||
| HD 216143 | 2.32 | 2 | 2.57 | 0.12 | 1.21 | 1.24 | 0.10 | 2, 13 | 1 |
| HD 218857 | 1.90 | 29 | 2.64 | 0.19 | 1.16 | 1.42 | 0.55 | 29, 36 | 0 |
| HD 220838 | 1.80 | 2 | 999. | 0.47 | 0.76 | 0.93 | 0.05 | 2, 4 | 1 |
| HD 221170 | 2.16 | 19 | 2.51 | 0.08 | 0.73 | 0.86 | 0.09 | 19 | 3 |
| HD 233666 | 1.79 | 29 | 2.88 | 0.22 | 0.68 | 1.03 | 0.40 | 29, 36 | 1 |
| HD 235766 | 1.93 | 2 | 0.60 | 0.86 | 0.10 | 2 | 1 | ||
| HD 237846 | 3.29 | 26 | 1.69 | 1.56 | 3.10 | 0.29 | 26 | 2 | |
| HE 04304901 | 2.72 | 3 | 0.45 | 1.05 | 3 | 0 | |||
| HE 04320923 | 3.19 | 3 | 0.44 | 1.43 | 3 | 0 | |||
| HE 11271143 | 2.73 | 3 | 0.27 | 1.14 | 3 | 0 | |||
| HE 12190312 | 2.97 | 14 | 1.78 | 0.40 | 0.75 | 0.98 | 0.53 | 14, 25 | 1 |
| HE 15230901 | 2.95 | 11 | 0.27 | 0.63 | 0.62 | 0.20 | 11, 12 | 3 | |
| HE 22240143 | 2.58 | 3 | 2.29 | 2.22 | 0.77 | 1.02 | 3 | 0 | |
| HE 23275642 | 2.79 | 3 | 1.83 | 0.69 | 1.10 | 1.29 | 23 | 0 | |
| M5 IV–81 | 1.28 | 34 | 3.21 | 1.15 | 0.11 | 0.31 | 0.35 | 34, 35 | 0 |
| M5 IV–82 | 1.33 | 34 | 3.21 | 1.00 | 0.11 | 0.23 | 0.25 | 34, 35 | 0 |
| M13 L598 | 1.56 | 33 | 0.55 | 0.34 | 0.58 | 0.09 | 33 | 3 | |
| M13 L629 | 1.63 | 33 | 0.63 | 0.35 | 0.61 | 0.12 | 33 | 3 | |
| M13 L70 | 1.59 | 33 | 0.50 | 0.23 | 0.58 | 0.09 | 33 | 3 | |
| M13 L973 | 1.61 | 33 | 0.55 | 0.27 | 0.51 | 0.01 | 33 | 3 | |
| M15 K341 | 2.54 | 32 | 2.04 | 0.49 | 1.28 | 1.52 | 32 | 0 | |
| M15 K462 | 2.55 | 32 | 2.00 | 0.41 | 1.03 | 1.20 | 32 | 0 | |
| M15 K583 | 2.58 | 32 | 1.99 | 0.63 | 1.52 | 1.80 | 32 | 0 | |
| M92 VII-18 | 2.29 | 20 | 0.20 | 1.29 | 1.45 | 20 | 0 | ||
| NGC 6752 B702 | 1.58 | 33 | 0.67 | 0.39 | 0.78 | 0.27 | 33 | 1 | |
| NGC 6752 B708 | 1.63 | 33 | 0.62 | 0.50 | 0.83 | 0.17 | 33 | 1 | |
| NGC 6752 PD1 | 1.62 | 33 | 0.66 | 0.45 | 0.78 | 0.03 | 33 | 1 | |
| NGC 6752 B1630 | 1.60 | 33 | 0.65 | 0.45 | 0.74 | 0.25 | 33 | 1 | |
| NGC 6752 B3589 | 1.59 | 33 | 0.72 | 0.41 | 0.72 | 0.18 | 33 | 1 | |
| UMi COS82 | 1.42 | 1 | 2.82 | 1.22 | 0.52 | 0.34 | 1, 28 | 0 |
References. — (1) Aoki et al. (2007); (2) Aoki & Honda (2008); (3) Barklem et al. (2005); (4) Burris et al. (2000); (5) Burris et al. (2009); (6) Cayrel et al. (2004); (7) Christlieb et al. (2004); (8) Cowan et al. (2002); (9) Cowan et al. (2005); (10) François et al. (2007); (11) Frebel et al. (2007); (12) A. Frebel (2009, private communication); (13) Fulbright (2000); (14) Hayek et al. (2009); (15) Hill et al. (2002); (16) Honda et al. (2004); (17) Honda et al. (2006); (18) Honda et al. (2007); (19) Ivans et al. (2006); (20) Johnson (2002); (21) Jonsell et al. (2006); (22) Lai et al. (2008); (23) Mashonkina et al. (2010); (24) Plez et al. (2004); (25) Roederer et al. (2009); (26) Roederer et al. (2010a); (27) I. Roederer et al. (in preparation); (28) Sadakane et al. (2004); (29) Simmerer et al. (2004); (30) Sneden et al. (2003); (31) Sneden et al. (2009); (32) Sobeck et al. (2010); (33) Yong et al. (2006); (34) Yong et al. (2008a); (35) Yong et al. (2008b); (36) this study.
| () | [La/Eu] | [Pb/Eu] | [Pb/Fe] | [Eu/Fe] | 13C Pocket Extent in Mass |
|---|---|---|---|---|---|
| [Fe/H] 1.4 | |||||
| 1.25 | 0.61 | 1.66 | 1.81 | 0.14 | 2 |
| 2.5 | 0.90 | 1.87 | 2.85 | 0.98 | 2 |
| 3.5 | 0.84 | 1.82 | 2.54 | 0.72 | 1 |
| [Fe/H] 2.3 | |||||
| 1.0 | 1.00 | 1.61 | 2.66 | 1.04 | 2 |
| 1.5 | 0.99 | 1.65 | 3.10 | 1.45 | 2 |
| 0.98 | 1.72 | 3.17 | 1.46 | 4 | |
| 2.0 | 0.95 | 1.70 | 3.18 | 1.48 | 2 |
| 1.06 | 1.93 | 3.56 | 1.62 | 4 | |
| 4.5 | 0.89 | 0.37 | 0.57 | 0.20 | no pocket |
| 5.0 | 0.92 | 0.47 | 0.73 | 0.26 | no pocket |
| 6.0 | 1.04 | 0.58 | 0.99 | 0.42 | no pocket |
Note. — All models assume a scaled-solar initial composition (Asplund et al., 2009).