GRB 090313 and the Origin of Optical Peaks in GRB Light Curves: Implications for Lorentz Factors and Radio Flares
Abstract
We use a sample of 19 Gamma Ray Bursts (GRBs) that exhibit single-peaked optical light curves to test the standard fireball model by investigating the relationship between the time of the onset of the afterglow and the temporal rising index. Our sample includes GRBs and X-ray flashes for which we derive a wide range of initial Lorentz factors (). Using plausible model parameters the typical frequency of the forward shock is expected to lie close to the optical band; within this low typical frequency framework, we use the optical data to constrain and show that values derived from the early time light curve properties are consistent with published typical values derived from other afterglow studies. We produce expected radio light curves by predicting the temporal evolution of the expected radio emission from forward and reverse shock components, including synchrotron self-absorption effects at early time. Although a number of the GRBs in this sample do not have published radio measurements, we demonstrate the effectiveness of this method in the case of Swift GRB 090313, for which millimetric and centrimetric observations were available, and conclude that future detections of reverse-shock radio flares with new radio facilities such as the EVLA and ALMA will test the low frequency model and provide constraints on magnetic models.
1 Introduction
With the advent of rapid optical follow-up observations of Gamma Ray Bursts (GRBs) (e.g. Mundell et al. 2010, Rykoff et al. 2009), the confirmed lack of bright optical flashes from most GRBs challenges a key prediction of the standard fireball model in which a reverse shock should produce bright, short-lived optical emission at early time (Mészáros & Rees 1999; Sari & Piran 1999; Kobayashi 2000). Although the lack of optical flash could be partially due to late observations which are not prompt enough to catch early flashes, it is not trivial how to explain events like GRB 090313 which exhibits the onset of afterglow without signatures of optical flash.
At early time, reverse shock emission should dominate optical band and a bright optical peak is expected to be observed when a fireball starts to be decelerated. However, a distinctive reverse shock component is detected only in a small fraction of GRBs (Melandri et al. 2008). Several afterglows show a fattening in the light curves, interpreted as the signature of the rapid fading of reverse shock combined with the gradual dominance of forward shock emission (Akerlof et al. 1999; Sari & Piran 1999). Afterglow modeling of such flattening cases implies that the magnetic energy density in a fireball, expressed as a fraction of the equipartition value of shock energy, is much larger than in the forward shock (but it still suggests a baryonic jet rather than a Poynting-flux dominated jet: Fan et al. 2002; Zhang et al. 2003; Kumar & Panaitescu 2003; Gomboc et al. 2008). Polarization measurements in a rapid decay phase of GRB 090102 afterglow shows the existence of large-scale magnetic fields in the revere shock region (Steele et al. 2009111Mundell et al. 2007b found no ordered magnetic fields or a very high magnetic energy density in the ejecta of GRB 060418. More observations are needed to give a strong conclusion on the nature of the ejecta (baryonic versus Poynting flux dominated) and the distribution of magnetization degree.). The lack of optical flashes in most GRBs may be due to extreme magnetic field properties, either high magnetic energy densities that suppress the reverse shock (Gomboc et al. 2008; Mimica et al. 2009) or very low magnetic energy densities that cause shock energy to be radiated at higher frequencies than the optical band due to synchrotron self-Compton processes (Beloborodov 2005; Kobayashi et al 2007; Zou et al 2009). Alternatively the light curve flattening could be the result of refreshed shocks and episodes of energy injection (Rees Mészáros 1998, Melandri et al. 2009).
A more conventional model would imply that the reverse shock emits photons at frequencies much lower than the optical band. Synchrotron emission is known to be sensitive to the properties of emitter. Within this framework, which we term the low-frequency model, a single peak in the early time optical light curve is produced when both of the typical synchrotron frequencies of forward and reverse shock lie below the optical band (Mundell et al. 2007a); the single peak actually consists of photons equally contributed from forward and reverse shock, the peak time represents the the deceleration of a fireball and hence it provides a direct estimate of the initial Lorentz factor.
In this paper, we discuss the lack of optical flashes in the context of the low-frequency model. GRB 090313 is a typical case of a burst that displays a rising and falling light curve, little temporal structure, no strong spectral evolution and well-monitored multi-wavelength behavior from early times. Here, we analyse its multi-wavelength properties, place it into the wider context of GRBs with single optically peaked light curves and use the characteristics of the full sample to test the low-frequency model and its predations for radio light curve evolution. Throughout the paper we use the following conventions: the power-law flux density is given as , where is the temporal decay index and is the spectral slope; a positive value of corresponds then to a decrease in flux, while a negative value indicates an increasing in time of the observed flux. We assume a standard cosmology with km s-1 Mpc-1, , and ; and all uncertainties are quoted at the confidence level (cl), unless stated otherwise.
2 Observations
On 2009 March 13 at 09:06:27 UT (=T0) the Burst Alert Telescope (BAT; Barthelmy et al. 2005) onboard Swift triggered on GRB 090313 (Mao et al. 2009a). The BAT light curves showed a series of multiple peaks with the emission starting before T0-100 s and a T90 in the 15-350 keV band starting at T0-3.9 s for a total duration of s (Mao et al. 2009b).
Spectroscopic observations performed with the Gemini South telescope provided a redshift of z=3.375 for GRB 090313 (Chornock et al. 2009b), later confirmed by from VLT with FORS (Thöene et al. 2009) and X-shooter (de Ugarte Postigo et al. 2010; who derive a refined redshift value of 3.3736 +/- 0.0004) observations. The estimated redshift for this afterglow confirmed again that the near object reported by Berger (2009) is indeed too bright to be the host galaxy of GRB 090313. Most likely this extended object is one of the two absorbing systems spectroscopically detected (at redshift z=1.96 or z=1.80) along the line of sight of GRB 090313 (de Ugarte Postigo et al. 2010). Radio observations performed with the AMI Large Array (Pooley 2009abc), the VLA (Frail Chandra 2009) and the WSRT (van der Horst Kamble 2009ab) confirmed the detection and fading nature of the afterglow.
This event displayed an average -ray fluence of 1.4 10-6 erg cm-2 (Mao et al. 2009b). The redshift of the burst (correspondent to a luminosity distance of Mpc) resulted in an isotropic energy estimate of ergs in the 15–150 keV observed bandpass.
2.1 Swift/XRT and Swift/UVOT data
Due to Moon distance observing constraints there were no prompt XRT (Burrows et al. 2005) and UVOT (Roming et al. 2005) observations. Follow-up observations of the BAT error circle were possible only after 27 ks, showing a power-law decay in the X-ray (Mao Margutti 2009) and a possible marginal detection in the UVOT-v and UVOT-b filters (Schady et al. 2009, Mao et al. 2009b).
2.2 Optical and Infrared data
The optical afterglow was discovered by the KAIT telescope (Chornock et al. 2009a) and later confirmed by the GROND telescope at equatorial coordinates (J2000) R.A. = 13h13m36.21s; Dec = +08∘0549.2 (Updike et al. 2009). The 2-m Faulkes Telescope North (FTN) observed the optical afterglow of GRB 090313 starting from 168 s after the burst (corresponding to 38 s in the rest frame). Observations continued up to several weeks after the burst with FTN, the 2-m Liverpool Telescope (LT) and the 2-m Faulkes Telescope South (FTS) (see Table 1). Late time observations were also performed in order to better correct the entire data set from the contribution of the nearby object, close to the position of the afterglow. This object was found to have a constant flux equal to of the peak flux of the optical afterglow, not affecting the shape of the light curve at early time.
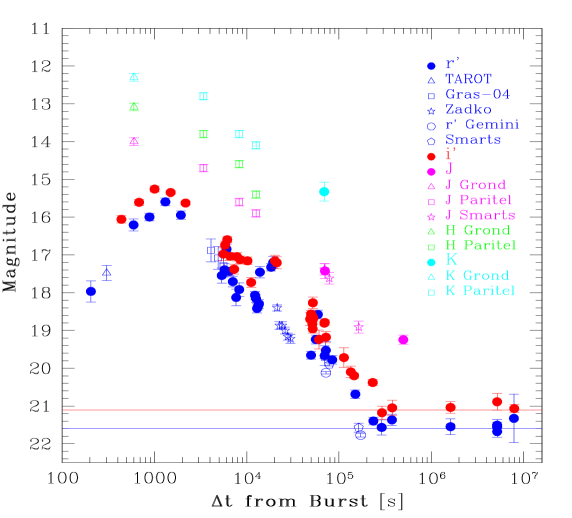
The optical afterglow was observed also with the 1.5m telescope at the Observatorio de Sierra Nevada (OSN), the 0.8m IAC telescope, the 1.23m telescope at the Calar Alto Astronomical Observatory (CAHA) and the 0.5m Mitsume telescope in the optical bands (R and I), plus the 2.5m Nordic Optical Telescope (NOT) and the 3.5m CAHA telescope in the near infrared bands (J and K). It was then possible to build the light curve for all the filters as shown in Fig.1. A log of the observations is given in Table 1, where we report the mid time, integration time, magnitude and fluxes for all our detections at different wavelengths. Afterglow detections reported in GCNs are also shown in Fig.1.
The optical data were calibrated using a common set of selected catalogued stars present in the field of view. SDSS catalogued stars were used for and filters, while USNO-B1 and magnitudes have been used for the and filters respectively. and observations were calibrated with respect to the 2MASS catalog. Next, the calibrated magnitudes were corrected for the Galactic absorption along the line of sight ( mag; Schlegel et al. 1998); the estimated extinctions in the different filters are = 0.074 mag, = 0.054 mag, = 0.025 mag, = 0.016 mag and = 0.010 mag. Corrected magnitudes were then converted into flux densities, (mJy), following Fukugita et al. (1996). Results are summarized in Table 1.
2.3 Radio, mm and sub-mm data
Continuum observations at 870 m were carried out using LABOCA bolometer array, installed on the Atacama Pathfinder EXperiment (APEX222This work is partially based on observations with the APEX telescope. APEX is a collaboration between the Max-Plank-Institut für Radioastronomie, the European Southern Observatory and the Onsala Space Observatory.) telescope. Data were acquired on 2009 March 17 and 24 during the ESO program 082.F-9850A, under good weather conditions (zenith opacity values ranged from 0.24 to 0.33 at 870m). Observations were performed using a spiral raster mapping, providing a fully sampled and homogeneously covered map in an area of diameter 12′, centered at the coordinates of the optical afterglow of GRB 090313. The total on source integration time of the two combined epochs was 4.6 hours. Calibration was performed using observations of Saturn as well as CW-Leo, B13134, G10.62, and G5.89 as secondary calibrators. The absolute flux calibration uncertainty is estimated to be 11%. The telescope pointing was checked every hour, finding an rms pointing accuracy of 1.8′′. Data were reduced using the BoA and MiniCRUSH softwares. Finally, the individual maps were co-added and smoothed to a final angular resolution of 27.6′′. We obtained a 3 detection upper limit of 14 mJy for each of the two epochs.
The radio afterglow of GRB 090313 was successfully detected by the AMI Large Array 2.8 days after the burst (Pooley 2009a) and then monitored up to 47 days (Pooley 2009bc) as reported in Table 2. After an initial upper limit at 1.7 days (van der Horst Kamble 2009a) a detection was reported also by the Westerbork Synthesis Radio Telescope at 7.6 days (WSRT, van der Horst Kamble 2009b) and by the Very Large Array at 5.9 days (VLT, Frail Chandra 2009). In the mm band the afterglow was detected with CARMA about one day (Bock et al. 2009) and then monitored with the Plateau de Bure Interferometer (PdBI) up to 20 days after the burst event. The radio observations are reported in Table 2 where the original frequency range of the observation has been specified.
3 Results
3.1 BAT spectral and temporal analysis
We re-binned the BAT light curve of GRB 090313 with dt bins of 16.384 s in order to better appreciate the long faint tail visible up to 500 s after the burst onset. As reported also by Mao et al. (2009b), the mask-weighted light curve (shown in Fig. 2) displays a series of multiple peaks extending long after t=T90 at a much fainter level. The time-averaged spectrum is best fitted by a simple power-law model with a photon index of 1.91 0.29 (Mao et al. 2009b).
3.2 Optical/X-ray light curve
Observations performed with the Faulkes North Telescope, beginning 170 s after the burst, showed the optical afterglow rising to a maximum at 1 ks (Guidorzi et al. 2009). The peak was followed by a decay with windings and flares (possibly due to the interaction with the circum-burst material or late time central engine activities). Around s, the magnitude became constant in each filter, revealing the presence of an underlying object at the position of the optical afterglow. This faint ( = and = ) and apparently extended object is only 2.3” away from the optical afterglow as reported by Berger (2009). It was not possible to separate the contributions from the two objects in the late-time co-added observations.
We model the optical light curve with a broken power-law (to fit the peak up to s) plus an additional component to model the bumps visible after s and a constant flux to model the behavior at late times. The fit to the component representing the optical peak at early time gives: , and t s. For completeness the parameters of the component modeling the sharp bump around s are: , and t s, (t/dt) (/dof = 769.4/77 9.9). The high for the optical fit is clearly driven by the uncertainty of the bump fit and the variability of the data around s. However this does not affect the goodness of the fit for the smooth early time behavior, where the peak (rise and fall) is well constrained with negligible variability as shown in Fig. 3.
Our independent analysis shows that the X-ray light curve of GRB 090313 is well fitted by a simple broken power-law with , and s (/dof = 43.17/43 ). The estimated values for and could be the result of flares activity, and the subsequent cessation, in the early XRT data. The X-ray light curve and its fit are shown in Fig. 3 together with the composite optical/infrared light curve. As we will explain in Section 3.4, the latter has been built by re-scaling all the filters with respect to the SDSS band. On the bottom panel of this figure we show the no-evolution of the optical spectral index as derived from the fit of the spectral energy distribution.
3.3 X-ray spectral analysis
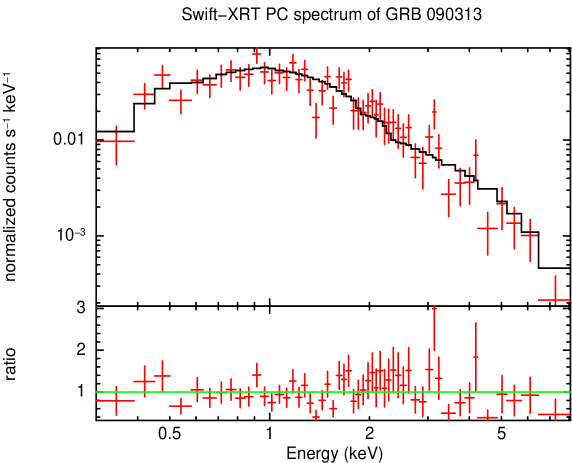
The X-ray spectrum (Fig. 4; from the Swift-XRT repository, Evans et al. 2007) can be fitted by an absorbed simple power law with a photon index and an absorbing column density cm-2, in excess of the Galactic value of cm-2.
3.4 Spectral energy distribution
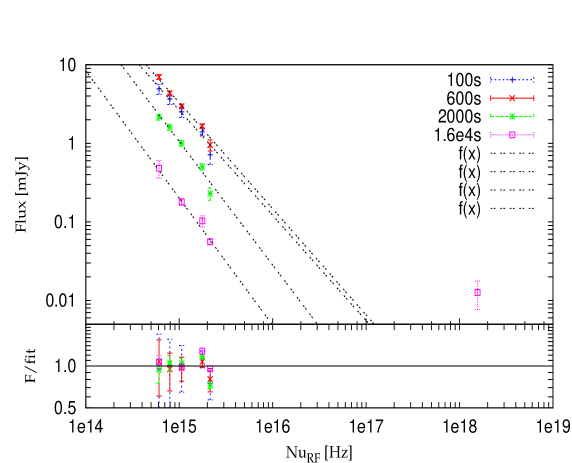
From our data and others published in GCNs we estimate the flux for the infrared () and optical () filters at four different epochs (corresponding to T0+100 s, T0+600 s, T0+2 s and T0+1.6 s in the rest frame of the burst). At the redshift of the burst (z=3.374) the wavelength of the Lyman-alpha break (121.6 nm) is redshifted to 532 nm, that corresponds roughly to the central peak wavelength of the filter. However also the tail of the filter could be affected by the absorption and for that reason we decided to perform the fit of the optical spectral energy distribution only up to 2 Hz. The results of the fit are shown in Fig. 5 and reported in Table 3. The afterglow of GRB 090313 did not display any spectral evolution before and after the peak in the light curve. Only a slight and insignificant change of the spectral parameter is recorded around 3ks (observed frame) after the break. For this reason we built a composite optical/infrared light curve (fixing the value of ) using rigid shifts for each filter to report all the fluxes relative to the SDSS- band.
4 Discussion
Here we examine the properties of 19 GRBs including GRB 090313 that exhibit a single-peaked optical light curve. Those are all the GRBs with published data that show a clear rise and fall of their optical light curves. The observed and derived properties of the sample are given in Table 4. In this table we report the parameters of the optical peak (, , tpeak and ), together with the X-ray decay index () in the post optical peak phase 333 the value of is taken from the literature or from the XRT light curve repository (Evans et al. 2007)., the duration (T90), redshift (z), initial Lorentz factor and isotropic energy (Eiso) for each burst. We have assumed that the optical peak time represents the fireball deceleration time. Following equation 1 in Molinari et al. 2007, the initial Lorentz factor of GRB 090313 is give by
| (1) |
where is the ambient density in protons/cm3. For all the bursts in Table 4 the ISM environment is favored in literature (i.e. Klotz et al 2008, Rykoff et al. 2009, Oates et al. 2009, Melandri et al. 2009, Greiner et al. 2009); only GRB 080330 is better explained by a wind-like medium (Guidorzi et al. 2009). For the wind medium , the equation 1 is replaced by .
It is well accepted that the X-ray temporal decay of the majority of GRB afterglow can be described by a canonical light curve, where the initial X-ray emission (steep decay) is consistent with the tail of the gamma-ray emission, followed by a shallow phase that leads into a power-law decay phase (Nousek et al. 2006, Zhang et al. 2006, Tagliaferri et al. 2005, O’Brien et al. 2006). In our sample also, no peaks are detected in the X-ray light curves, all the X-ray light curves monotonically decay from the beginning of the X-ray observations except X-ray flares. It is known that about 50 of GRBs show flaring activities on top of the canonical light curve. The narrow structure indicates that it originates from a physically distinct emitting region (e.g. late internal shocks). X-ray observations started before an optical peak for GRB 990123, GRB 050730, GRB 050820A, GRB 060418, GRB 060605, GRB 060607A, GRB 060904B, GRB 070419A, GRB 074020, GRB 071031, XRF 080330 and GRB 080810, while it started after an optical peak for GRB 061007, GRB 080603A, GRB 080129, GRB 080710 and GRB 090313. We have no X-ray observations for XRF 020903 and XRF 030418. If an optical peak is due to the deceleration of a fireball, X-ray emission from external shocks also should peak simultaneously. The tail of the prompt emission or a different emission component might mask the X-ray peak.
Four events: GRB 060418, GRB 060605, GRB 060607A and GRB 060904B show X-ray flares around an optical peak, we tested whether the observed optical peaks could be explained by the flare emission alone by extrapolating the peak flux of the X-ray flare to the optical band assuming a spectral index between the two bands of . In all cases, the contribution of the X-ray flare to the optical light curve was significantly lower than that observed, ruling out a flare origin for the optical peaks.
4.1 The origin of the optical peak
Recent results on the naked eye optical flash from GRB 080319B (Racusin et al. 2008; Bloom et al. 2009), where the observed optical peak coincided in time with the prompt gamma-ray emission, provided motivation to consider that the prompt gamma-ray emission is Inverse Compton (IC) of the optical flash. The dominance of IC cooling could lead to the lack of prompt optical flashes.444The full discussion on IC cooling effects (e.g. Nakar, Ando Sari 2009) is beyond the scope of this paper. We here give a rough estimate on how much would be necessary to suppress an optical flash. We assume that the typical frequency of the reverse shock is in the optical band, and that the shock emissions are in the fast cooling regime. If the IC cooling is not important, the luminosities would peak at the typical synchrotron frequencies, and the luminosities would be comparable at the onset of afterglow. The flux ratio is about in the optical band (Kobayashi Zhang 2003). If the IC cooling is the dominant cooling mechanism of the electrons in the shock regions, the bulk of the shock energy is radiated in high energy radiation (possibly the 1st scattering component for the forward shock and the 2nd scattering component for the reverse shock). The optical flux ratio could be reduced roughly by a factor of (Kobayashi et al. 2007). A very small is required to explain the lack of optical flashes. In the slow cooling regime, the Compton parameter is smaller for a given ratio , the required could be even smaller. However, the basic problem of such IC model is that if the low-energy seed emission is in the optical, while the observed soft gamma-ray spectrum is the first IC component, then second IC scattering would create a TeV component. The second IC component in the TeV range should carry much more energy than the soft gamma-ray components. This could cause an energy crisis problem, possibly violating upper limits from EGRET and Fermi (Piran et al. 2009).
Rykoff et al. (2004) suggested a model in which single-peaked light curves are caused by GRB radiation emerging from a wind medium surrounding a massive progenitor. This model suggests that the rise of the afterglow observed in the optical band can be ascribed to extinction and the emission can be modeled with an attenuated power-law. A consequence of this model is that at very early times some afterglows will rise very steeply and the extinction observed in the optical band should be much greater that in the infrared band. As shown in Fig.6 we see a very steep rise only for GRB 061007, however for this burst as for the other bursts on that figure, we do not have data to model the peak in the infrared band. If we fit the afterglow peak of GRB 090313 with an attenuated power-law function (equation 1 in Rykoff et al. 2004) we find values of the decay index and the attenuation time scale ( = 1.15 0.03 and = 1097 117 s) consistent with the decay index obtained in section 3.2. With this we derive a mass loss rate ( M⊙ yr-1) which is slightly higher than what is usually suggested for GRB progenitors. The Lorentz factor that we assumed for this estimate is obtained from the peak time based on the wind model; based on the ISM model is higher and it would results in a higher mass loss rate. This is a similar result to the one found by Rykoff et al. for GRB 030418. As the majority of the GRBs in our sample rise slowly or with comparable with respect GRB 090313 this will imply a higher mass loss rate for all those bursts. This model will be further tested with future simultaneous optical/IR light curves obtained at early time.
If the observed peak is due to the passage of the typical frequency of the forward shock through the optical band, we would expect much slower rise ( -0.5) and strong color evolution around the peak. These are not consistent with GRB 090313 observations ( -1.7 and no color evolution). If the optical peak is due to the deceleration of a fireball, the typical frequency of the forward shock should be below the optical band at the onset, otherwise, the forward shock emission slowly rises until the typical frequency crosses the optical band. Actually when this condition: is satisfied, the forward and reverse shock emission peak at the same time, and produce a single peak (Mundell et al. 2007a). We here consider such a low-frequency model in detail.
The onset of the afterglow is expected to occur immediately after the prompt emission if the reverse shock is in the thick shell regime, while there should be a gap between the prompt gamma-ray emission and the onset if the reverse shock is in the thin shell regime (Sari 1997). At the onset of afterglow, the forward and reverse shock emission rise as and , respectively in the thin shell case, while they are as shallower as and for the thick shell case. If the two emission components are comparable at the onset, the rising index could be determined by the shallower component. The rising index is expected to be for the thin shell case, and or shallower for the thick shell case.
As we will discuss, most optical afterglows are classified into the thin shell case. The fireball deceleration time is given by s where we have scaled parameters as ergs and . At the peak time , the cooling frequency and the typical frequencies of the forward and reverse shock emission are given (Sari et al. 1998, Kobayashi Zhang 2003) by
| (2) | |||||
| (3) | |||||
| (4) |
where and . For plausible parameters, the typical frequency of the forward shock is actually below optical band and the both shock emission is in the slow cooling regime.
The low typical frequencies provide an upper limit to the microscopic parameter . Requiring that the typical frequency of the forward shock is below the optical band at the onset of afterglow, we obtain
| (5) |
The estimated values for the upper limit of for the GRBs in our sample are reported in table 4. The spread of the values of is large (from to ) and this could still be a significant uncertainty in the upper limits estimates, even if do not strongly depend from that parameter. GRB 020903 does not constrain well, the typical upper limit is , consistent with values from later afterglow modeling (e.g. Panaitescu Kumar 2002).
A highly magnetized fireball is another possibility to explain the lack of optical flashes.555The reverse shock emission might be suppressed for high magnetization: or larger where and are the rest-frame magnetic field strength and density, respectively (Mimica et al. 2009). Assuming a mildly relativistic reverse shock, the critical magnetization could correspond to . However, Granot et al. (2010) recently argued that in the thin shell case the magnetization of the GRB outflow at the deceleration time is not high enough to suppress the reverse shock. Most events in our sample are classified into the thin shell case. Even if the reverse shock is suppressed by high magnetization, the same condition could be required to avoid slowly rising forward shock emission after the onset of afterglow.
4.2 Reverse and Forward Shocks: Relative Contributions
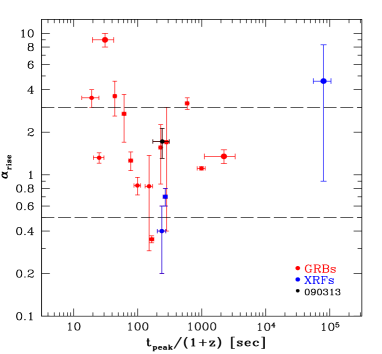
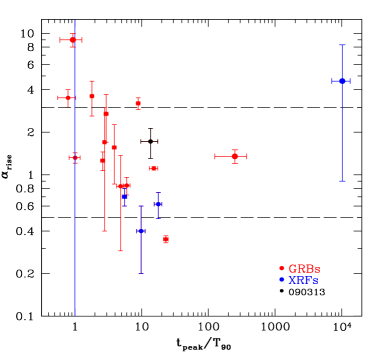
In Fig. 6 we plot the light curve rise index () against the time of the peak in the GRB rest frame (left panel) and the ratio /T90 (right panel). In a recent work Panaitescu Vestrand (2008) classified the optical light curves into ’fast-rising with an early peak’ and ’slow-rising with a late peak’. In our sample an apparent weak anti-correlation can be seen between and ; however the significance is very low () not allowing any firm conclusion about the existence of this anti-correlation. A simple fireball model predicts that the dynamics of a fireball is classified into two cases: (1) thin shell fireballs (t T90) produce a sharp peak with rising index ; (2) thick shell fireballs (T90) have a wider peak with (where this value is a limit and the rise could be much shallower). As shown in Fig. 6 (right panel), most GRBs in the sample are classified into the thin shell case, and the rising indexes are consistent with the simple model or shallower. The simple reverse shock model assumes a homogeneous fireball. However, as internal shock process requires, the initial fireball could be highly irregular. The complex structure of shell or energy injection in the post-prompt phase could make the rising index shallower.
In Fig. 6, GRB 061007 stands out as a notable exception with Rykoff et al. (2009) quoting a peculiarly steep rising index ( -9). Mundell et al. (2007a) showed that the afterglow is detected from gamma to optical wavelength, beginning during the prompt emission as early as 70 s post-trigger. The softening of the gamma-ray spectral index after 70 s further confirms the afterglow onset at this time (Mundell et al. 2007a; Rykoff et al. 2009). The gamma ray light curve is dominated by a multi-peaked flare between T=20 and 70 s, coincident with the steepest rising part of the optical light curve and possible double optical peak. If the optical emission during these prompt gamma-ray flares comprises a rising afterglow component with a contemporaneous prompt (flaring) component superimposed, the underlying afterglow rising index would be much shallower than the observed value. In our small sample, the optical afterglow of XRFs tend to rise slowly with a late peak. If we ignore XRFs and the peculiar case of GRB 061007 in fig 6, the anti-correlation between the rising index and peak time is very weak or it might not exist.
GRB 990123 has a clear reverse shock component in early optical afterglow. Our low-frequency model is not suitable to discuss this event, because it is considered to explain the lack of optical flash. On the other hand, the simple reverse shock model still predicts that the rising index is for the reverse shock dominant thick shell case. We plot GRB 990123 in Fig. 6 also to test the simple model. The discrepancy might be due to the irregularity of the fireball.
An interesting comparison can be done with the peaks detected in the high energy band by the Fermi/LAT. Ghisellini et al. (2010) studied the emission observed at energies GeV of 11 GRBs detected by the Fermi. They argue that the observed high energy flux can be interpreted as afterglow emission shortly following the start of the prompt emission. Most events show the onset of afterglow during the prompt gamma-ray phase. This is quite a contrast to what we have seen in our sample. The reason for this difference might be that Fermi events tend to have very high Lorentz factors, which allow to emit high energy photons without pair attenuation, and the events are classified into the thick shell. The peak time should be early and comparable to the duration of the prompt emission. On the other hand, our sample (early optical observations) might be biased towards the thin shell case, because early peaks are technically difficult to catch.
4.3 Radio Afterglow Modeling
In the low frequency model, the characteristics of an optical peak: the peak time and the peak flux can be used to predict the behavior of early radio afterglow. At the onset of afterglow (peak time), the typical frequencies and spectral peaks of reverse and forward shock are related as and , respectively (Kobayashi & Zhang 2003). Note that is a peak in the time domain, while is a peak in the spectral domain. To produce bright forward shock emission, should be close to optical band and we get and . After the original fireball deceleration, the typical frequency and spectral peak behave as and . The typical frequency comes to the radio band at and the flux at that time is where is a correction factor when is well below the optical band and , in principle, could be determined from radio observations, is estimated from the peak time as shown in table 4. In eq (5), the upper limit corresponds to the case of . If is obtained from radio observations, the right-hand side of the inequality with a correction factor of gives the value of .
At low frequencies and early times, self-absorption takes an important role and significantly reduces the flux. A simple estimate of the maximal flux is the emission from the black body with the reverse shock temperature (Sari & Piran 1999; Kobayashi & Sari 2000). The black body flux at the peak time is
| (6) |
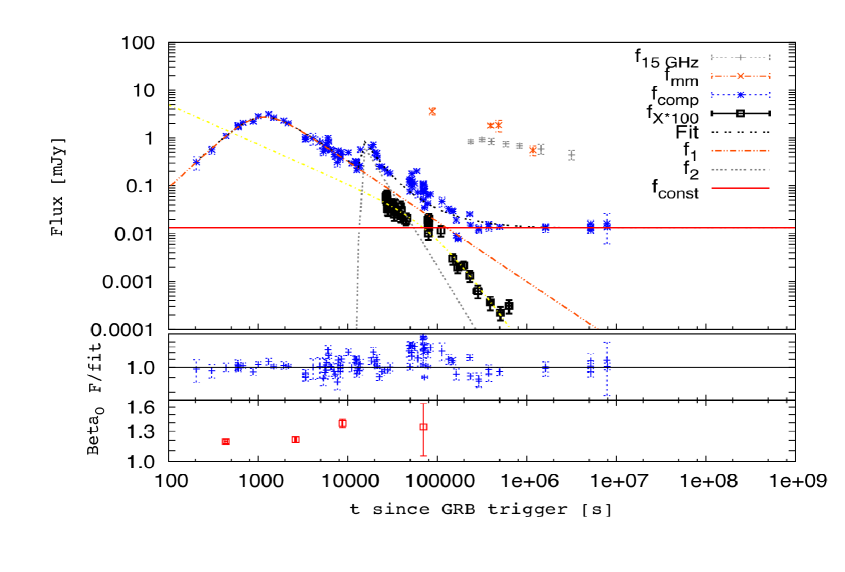
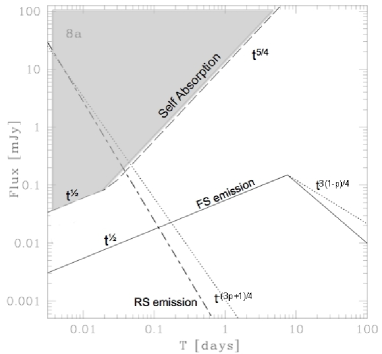
where is the observed size of the fireball. This limit initially increases as , and then steepen as after crosses the observation frequency . In Fig. 7 the dashed lines indicate the black body flux limit. Once the reverse shock emission becomes dimmer than the limit, the flux decays as . The combination of the increasing limit and decaying flux shapes “radio flare” (Kulkarni et al. 1999). The forward shock emission (thin solid) evolves as t1/2 before the passage of through the radio band, and then decays as . The forward shock peak should happen around s.
In the case of GRB 090313, assuming , the forward shock peaks in the optical band Hz with a flux density F 2 mJy and a peak time corresponding to 100; therefore the reverse-shock peak flux at this time occurs at (tpeak) 46 Hz and is F 200 mJy. Correcting for synchrotron self-absorption, results in an observable flux density of 4 mJy after 2.4 hours. After the deceleration time the reverse-shock emission in the radio band decays as (dot-dashed line Fig. 7) and the emission at 1 day is about 20 Jy for GRB 090313.
For GRB 090313, the forward shock emission is expected to peak in the radio band around 12 days after the burst (assuming Hz), with peak flux of 2 mJy (solid line Fig. 7). Taking all these factors into account, the resultant expected light curve of the radio afterglow of GRB 090313 is shown in Fig. 7. The expected 15 GHz and 100 GHz light curves (thick lines) are reasonably consistent with the observations. The deviation of the 15 GHz estimates from the observations might be partially due to a simplified synchrotron spectrum which is described by a broken power law. The deviation of the 100 GHz point around 1 day is much more apparent and might be due to an additional emission component (e.g. late time central engine activity). Since a realistic synchrotron spectrum is rounded at the break frequencies, a more accurate estimate should give a light curve rounded at the peak time. However, if this is the case, our simple model further underestimates the 100 GHz flux. It is interesting that the 15 GHz flux decays very slowly up to few ten days while X-ray afterglow displayed a steep decay around 1 day, as shown in Section 3.2. This might indicate different origins (e.g. emission regions) for the two; the is indeed too large to be explained assuming that the cooling frequency lies at the X-ray frequencies at that time.
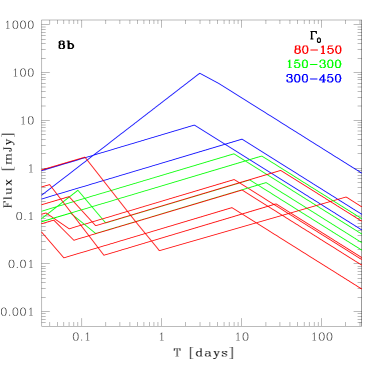
In Fig 8, we show radio light curves expected for our sample, which are evaluated by using early optical observations. GRB 990123, XRF 020903, GRB 030418, GRB 060607A, GRB 070420 and GRB 080810 are excluded in the radio afterglow estimates. Since GRB 990123 clearly shows a reverse shock component in the early afterglow, it is not consistent with our model assumption. For the other five events, the optical peak time or peak flux was not well constrained. In future, we should be able to estimate radio afterglow light curves in real time as soon as a single peaked optical light curve is detected. Depending on the Lorentz factor at the time of the peak and on the energetics of the burst, the shape of the radio will slightly change, displaying an early peak/flash at 0.1 days and later on the peak of the forward shock in the radio band peaking at about 2-10 days after the burst. Diffractive scintillation might make the detection of radio flares difficult if the amplitude of flares are order of unit. In cases similar to GRB 061007, in which the optical forward and radio reverse shocks peak at early time and the forward shock flux is large, the radio peak due to the the passage of the forward shock typical frequency is expected to be very bright. Liang et al. (2010) suggest a correlation, such that , therefore Fig. 8 can also be viewed in terms of increasing Eiso. The scatter in this correlation, however results in an over-prediction of the the initial Lorentz factor for GRB 090313 ( 130) compared with the value calculated directly from the light curves.
5 Conclusions
We have analysed multiwavelength observations of GRB 090313 and similar 18 GRBs which exhibit a single-peaked optical light curve. We have compared prompt and afterglow properties to test the standard fireball model with amended microphysics parameters. The goal of the study was to understand the origin of single optical peaks in afterglow light curves and to explain the surprising lack of bright optical flashes from reverse shocks that were predicted from the standard fireball model. Within this amended standard model, which we term the low-frequency model, a single peak in the early time optical light curve is produced when the typical synchrotron frequencies of shock emission lie below the optical band. We have shown that this condition is satisfied with plausible microphysics parameter ; the single peak consists of forward and reverse shock emission components, the peak time represents the initial deceleration of the fireball at the onset of the afterglow and the reverse shock emits most photons at frequencies below the optical band. We find that:
-
•
In the case of GRB 090313, no spectral evolution was observed at the time of the optical peak, the peak is considered to represent the onset of the GRB afterglow (or fireball deceleration) and the initial Lorentz factor of the ejecta was derived . The Lorentz factors that were similarly derived for the other GRBs and XRFs in the sample cover a wide range .
-
•
The rising indexes of most optical light-curves are consistent or shallower than the value of expected in the standard model. Although a simple reverse shock model assumes a homogeneous fireball, the internal shock model requires a highly irregular fireball. At the end of the prompt gamma-ray phase, the fireball might still have an irregular structure. The irregularity in the density distribution or energy injection in post-prompt gamma-ray phase could make the rising index shallower than the expected value. In the small sample, the optical afterglow of XRFs tend to rise slowly with a late peak.
-
•
We constrained the value of for the single-peak events, found an average value of for the whole sample. The values derived from early time light curve properties are consistent with published values derived from late-time afterglow modeling. However the large spread of values for could affect the estimates of the upper limit for .
-
•
Using the observed optical properties for our sample of GRBs, we predicted the radio afterglow light curves for the low-frequency model. Synchrotron self-absorption is important at early times in shaping the radio light curve and masking the reverse shock emission. This could result in an early detectable peak around 0.1 days, though prompt radio observations might be challenging. The forward shock peaks later around 2-10 days after the burst. It is important to note that high energies and Lorentz factors (as in the case of GRB 061007) could produce bright optical and radio afterglows. We demonstrate the effectiveness of this method in the case of GRB 090313. This is important for future observations of GRBs afterglow in the radio band with new facilities such as the EVLA, ALMA and LOFAR. The latter will have a very large field of view, and prompt radio observations could be possible. However, LOFAR will operate at low frequencies (below 250 MHz) and since synchrotron self-absorption limit F is much lower, it could be still difficult to catch prompt optical flares. Current radio sensitivities of 50 Jy are already adequate for detecting reverse and forward shock peaks but with predicted sensitivities as low as 2.3 Jy in a 2-hour integration (Chandra et al. 2010) all radio light curves in our sample would be easily observed from early to late time with instruments such as the EVLA and ALMA.
Acknowledgments
We thank the anonymous referee for valuable comments and suggestions that improved the paper. AM acknowledges funding from the Particle Physics and Astronomy Research Council (PPARC). CGM is grateful for financial support from the Royal Society and Research Councils (UK). AG acknowledges founding from the Slovenian Research Agency and from the Centre of Excellence for Space Sciences and Technologies SPACE-SI, an operation partly financed by the European Union, European Regional Development Fund and Republic of Slovenia, Ministry of Higher Education, Science and Technology. IdG is partially supported by Ministerio de Ciencia e Innovación (Spain), grant AYA2008-06189-C03 (including FEDER funds), and by Consejería de Innovación, Ciencia y Empresa of Junta de Andalucía (Spain).The Liverpool Telescope is operated by Liverpool John Moores University at the Observatorio del Roque de los Muchachos of the Instituto de Astrofisica de Canarias. The Faulkes Telescopes, now owned by Las Cumbres Observatory, are operated with support from the Dill Faulkes Educational Trust. This work is partially based on observations carried out with the IRAM Plateau de Bure Interferometer and observations collected at the German-Spanish Astronomical Center, Calar Alto, jointly operated by the Max-Planck-Institut für Astronomie Heidelberg and the Instituto de Astrofísica de Andalucía (CSIC). IRAM is supported by INSU/CNRS (France), MPG (Germany) and IGN (Spain). We thank Calar Alto Observatory for allocation of director’s discretionary time to this program. We also would like to thank M.R Zapatero-Osorio for the acquisition and reduction of NOT data.The research of JG and AJCT is suppported by the Spanish programmes AYA2007-63677, AYA2008-03467/ESP and AYA2009-14000-C03-01. This work made use of data supplied by the UK Swift Science Data Centre at the University of Leicester.
References
- [1] Amati, L., et al. 2008, MNRAS, 391, 577
- [2] Akerlof, C., et al. 1999, Nature, 398, 400
- [3] Barthelmy, S. D., et al. 2005, Space Science Reviews, 120, 143
- [4] Beloborodov, A.M. 2005, ApJ, 618, 13
- [5] Berger, E. 2009, GCN Circ. 8984
- [6] Bersier, D., et al. 2006, ApJ, 634, 284
- [7] Bloom, J.S., et al. 2009, ApJ, 691, 723
- [8] Bock, D. C.-J., et al. 2009, GCN Circ. 9005
- [9] Burrows, D. N., et al. 2005, Science, 309, 1833
- [10] Cenko, S. B., et al. 2006, ApJ, 652, 490
- [11] Chandra, P., et al. 2010, ApJ, 712, L31
- [12] Chornock, R., et al. 2009a, GCN Circ. 8979
- [13] Chornock, R., et al. 2009b, GCN Circ. 8994
- [14] Cobb, B. E. 2009, GCN Circ. 9008
- [15] de Ugarte Postigo, A., et al. 2010, AA, 513, 42
- [16] Evans, P., et al. 2007, AA, 469, 379
- [17] Falcone, A. D., et al. 2006, GCN Circ. 5009
- [18] Fan, Y., Dai Z., Huang, Y. & Lu, T. 2002, ChJAA, 2, 449
- [19] Frail, D. A., & Chandra, P., 2009, GCN Circ. 9011
- [20] Fukugita, M., et al. 1996, AJ, 111, 1748
- [21] Galama, T., et al. 1999, Nature, 398, 394
- [22] Ghisellini, G., Ghirlanda, G., Nava, L. & Celotti A. 2010, MNRAS, 403, 926
- [23] Golenetskii, S., et al. 2007, GCN Circ. 6344
- [24] Gomboc, A., et al. 2008, ApJ, 687, 443
- [25] Gomboc, A., et al. 2009, AIPC, 1133, 145
- [26] Granot, J. Komissarov, S. & Spitkovsky, A. 2010, arXiv1004.0959G
- [27] Greiner, J., et al. 2009, ApJ, 693, 1912
- [28] Guidorzi, C., et al. 2009, GCN Circ. 8989
- [29] Guidorzi, C., et al. 2009, AA, 499, 439
- [30] Klotz, A., et al., 2008, AA, 483, 847
- [31] Klotz, A., et al. 2009, GCN Circ. 8998
- [32] Kobayashi, S. 2000, ApJ, 545, 870
- [33] Kobayashi, S., & Sari, R. 2000, ApJ, 542, 819
- [34] Kobayashi, S., & Zhang, B. 2003, ApJ, 582, L75
- [35] Kobayashi, S., et al. 2007, ApJ, 655, 391
- [36] Kulkarni, S., et al. 1999, ApJ, 522, L97
- [37] Kumar, P. & Panaitescu, A. 2003, MNRAS, 346, 905
- [38] Kruhler, T., et al. 2009a, ApJ, 697, 758
- [39] Kruhler, T., et al. 2009b, AA, 508, 593
- [40] Mao, J., et al. 2009a, GCN Circ. 8980
- [41] Mao, J., & Margutti, R. 2009, GCN Circ. 8991
- [42] Mao, J., et al. 2009b, GCN Report 204.1
- [43] Melandri, A., et al. 2008, ApJ, 686, 1209
- [44] Melandri, A., et al. 2009, MNRAS, 395, 1941
- [45] Mészáros, P. & Rees, M.J. 1999, MNRAS, 306, L39
- [46] Mimica, P., Giannos, D. & Aloy, M.A. 2009, AA, 494, 879
- [47] Molinari, E., et al. 2007, AA, 469, 13
- [48] Morgan, A. N., et al. 2009, GCN Circ. 8995
- [49] Mundell, C., et al. 2007a, ApJ, 660, 489
- [50] Mundell, C., et al. 2007b, Science, 315, 1822
- [51] Mundell, C., et al. 2010, Advances in Astronomy, Vol. 2010, Article ID 718468
- [52] Nissinen, M. 2009, GCN Circ. 8993
- [53] Nousek, J. A., et al. 2006, ApJ, 642, 389
- [54] O’Brien, P. T., et al. 2006, ApJ, 647, 1213
- [55] Oates, S., et al. 2009, MNRAS, 395, 490
- [56] Page, K., et al. 2006, GCN Circ. 5240
- [57] Panaitescu, A., & Kumar, P. 2002, ApJ, 571, 779
- [58] Perley, D. A. 2009, GCN Circ. 8997
- [59] Perley, D. A., et al. 2009, GCN Circ. 9001
- [60] Perri, M., et al. 2007, AA, 471, 83
- [61] Piran, T., et al. 2009, MNRAS, 393, 1107
- [62] Pooley, G., et al. 2009a, GCN Circ. 9003
- [63] Pooley, G., et al. 2009b, GCN Circ. 9007
- [64] Pooley, G., et al. 2009c, GCN Circ. 9017
- [65] Racusin, J.L., et al. 2008, Nature, 455, 183
- [66] Rees, M. J. & Mészáros, P. 1998, ApJ, 496, 1
- [67] Roming, P. W. A., et al. 2005, Space Science Reviews, 120, 95
- [68] Rossi, F., et al. 2008, MNRAS, 388, 1284
- [69] Rykoff, E. S., et al. 2004, 601, 1013
- [70] Rykoff, E. S., et al. 2009, ApJ, 702, 489
- [71] Sari, R., Piran, T. & Narayan, R. 1998, ApJ, 497, 17
- [72] Sari, R., & Piran, T. 1999, ApJ, 520, 641
- [73] Sakamoto, T., et al. 2004, ApJ, 602, 875
- [74] Schady, P., et al., 2007, MNRAS, 380, 1041
- [75] Schady, P., et al. 2009, GCN Circ. 9006
- [76] Schlegel, D., et al. 1998, ApJ, 500, 525
- [77] Steele, I. A., et al. 2009, Nature, 462, 767
- [78] Stratta, G., et al. 2009, GCN Circ. 7240
- [79] Tagliaferri, G., et al. 2005, Nature, 436, 985
- [80] Thoene, C. C., et al. 2009, GCN Circ. 9012
- [81] Updike, A. C., et al. 2009, GCN Circ. 8983
- [82] Vaalsta, T., & Coward, D. M. 2009, GCN Circ. 8696
- [83] van der Horst, A. J., & Kamble, A. P., 2009a, GCN Circ. 9000
- [84] van der Horst, A. J., & Kamble, A. P., 2009b, GCN Circ. 9016
- [85] Vestrand, W. T., et al. 2006, Nature, 442, 172
- [86] Zhang, B., Kobayashi, S., & Meszaros, P. 2003, ApJ, 595, 950
- [87] Zhang, B., et al. 2006, ApJ, 642, 354
- [88] Zou, Y., Fan, Y. & Piran, T. 2009, MNRAS, 396, 1163


| texp | Filt. | Mag | Ref. | texp | Filt. | Mag | Ref. | ||||
|---|---|---|---|---|---|---|---|---|---|---|---|
| (min) | (s) | (mJy) | (min) | (s) | (mJy) | ||||||
| 3.41 | 30.0 | FTN | 7.30 | 10.0 | FTN | ||||||
| 9.89 | 30.0 | FTN | 11.33 | 30.0 | FTN | ||||||
| 14.71 | 60.0 | FTN | 16.71 | 60.0 | FTN | ||||||
| 21.88 | 120.0 | FTN | 24.95 | 120.0 | FTN | ||||||
| 32.21 | 180.0 | FTN | 26.20 | 180.0 | FTN | ||||||
| 89.28 | 30.0 | FTN | 93.04 | 10.0 | FTN | ||||||
| 95.70 | 30.0 | FTN | 97.10 | 30.0 | FTN | ||||||
| 100.54 | 60.0 | FTN | 102.44 | 60.0 | FTN | ||||||
| 107.70 | 120.0 | FTN | 110.56 | 120.0 | FTN | ||||||
| 117.78 | 180.0 | FTN | 121.75 | 180.0 | FTN | ||||||
| 127.19 | 120.0 | FTN | 130.82 | 120.0 | FTN | ||||||
| 137.99 | 180.0 | FTN | 141.99 | 180.0 | FTN | ||||||
| 204.80 | 300.0 | FTN | 169.90 | 900.0 | FTN | ||||||
| 210.18 | 300.0 | FTN | 186.03 | 900.0 | FTN | ||||||
| 215.56 | 300.0 | FTN | 336.59 | 300.0 | FTN | ||||||
| 220.93 | 300.0 | FTN | 352.72 | 1500.0 | FTN | ||||||
| 226.31 | 300.0 | FTN | 86288.09 | 600.0 | FTN | ||||||
| 231.69 | 300.0 | FTN | 132306.85 | 1800.0 | FTN | ||||||
| 306.69 | 900.0 | FTN | 865.36 | 900.0 | LT | ||||||
| 322.82 | 900.0 | FTN | 880.96 | 900.0 | LT | ||||||
| 1407.83 | 1800.0 | FTN | 1010.82 | 1800.0 | LT | ||||||
| 86255.28 | 600.0 | FTN | 1156.30 | 900.0 | LT | ||||||
| 86265.98 | 600.0 | FTN | 1169.30 | 900.0 | LT | ||||||
| 86277.15 | 600.0 | FTN | 2431.86 | 7200.0 | LT | ||||||
| 131244.99 | 1200.0 | FTN | 3870.60 | 7200.0 | LT | ||||||
| 828.90 | 1800.0 | LT | 27001.76 | 600.0 | LT | ||||||
| 983.50 | 3600.0 | LT | 4872.80 | 1800.0 | FTS | ||||||
| 1200.25 | 1800.0 | LT | 6285.20 | 1800.0 | FTS | ||||||
| 2507.32 | 7200.0 | LT | 811.10 | 900.0 | I | OSN | |||||
| 3933.26 | 7200.0 | LT | 829.13 | 900.0 | I | OSN | |||||
| 26990.86 | 600.0 | LT | 844.51 | 900.0 | I | OSN | |||||
| 4839.42 | 1800.0 | FTS | 855.73 | 900.0 | I | OSN | |||||
| 6251.83 | 1800.0 | FTS | 868.40 | 800.0 | I | OSN | |||||
| 935.04 | 600.0 | IAC80 | 1203.40 | 400.0 | I | OSN | |||||
| 1167.45 | 1380.0 | IAC80 | 2239.18 | 1000.0 | I | OSN | |||||
| 9695.8 | 13800.0 | — | 1.23Caha | 1885.18 | 10260.0 | I | Mitsume | ||||
| 11171.1 | 9600.0 | — | 1.23Caha | 1173.80 | 540.0 | J | NOT | ||||
| 1152.38 | 1080.0 | K | NOT | 8300.50 | 3600.0 | J | 3.5Caha |
| Frequency Range | Ref. | ||
|---|---|---|---|
| (days) | (GHz) | (mJy) | |
| 1.01 | 92.5 | CARMA, GCN 9005 | |
| 1.71 | 4.9 | WSRT, GCN 9000 | |
| 2.75 | 14.5-17.5 | AMI | |
| 3.68 | 14.5-17.5 | AMI | |
| 4.57 | 105.38 | PdBI | |
| 4.67 | 14.5-17.5 | AMI | |
| 5.63 | 228.00 | PdBI | |
| 5.85 | 8.46 | VLA, GCN 9011 | |
| 6.78 | 14.5-17.5 | AMI | |
| 7.40 | 4.9 | WSRT, GCN 9016 | |
| 9.67 | 14.5-17.5 | AMI | |
| 13.59 | 87.205 | PdBI | |
| 16.74 | 14.5-17.5 | AMI | |
| 19.54 | 110.00 | PdBI | |
| 36.66 | 14.5-17.5 | AMI | |
| 46.63 | 14.5-17.5 | AMI |
| SED | trf | |||
|---|---|---|---|---|
| (s) | (s) | |||
| 1 | 100 | 437.5 | ||
| 2 | 600 | 2625 | ||
| 3 | 2000 | 8750 | ||
| 4 |
| GRB | tpeak | AV | T90 | z | Fp | Eiso | Ref. | |||||
|---|---|---|---|---|---|---|---|---|---|---|---|---|
| (s) | mag | (s) | Upper Limit | (mJy) | (1052 erg) | |||||||
| 990123 | 0.053 | 1.61 | 0.004 | [1],[2] | ||||||||
| 020903 | 0.098 | 0.25 | 18.466 | [3],[4] | ||||||||
| 030418 | 0.077 | [5] | ||||||||||
| 050730 | 0.155 | 3.97 | 0.043 | [6],[7] | ||||||||
| 050820A | 0.137 | 2.615 | 0.021 | [8],[9] | ||||||||
| 060418 | 0.702 | 1.489 | 0.014 | [10],[20] | ||||||||
| 060605 | 0.159 | 3.78 | 0.042 | [11] | ||||||||
| 060607A | 0.089 | 3.082 | 0.014 | [10],[21] | ||||||||
| 060904B | 0.549 | 0.703 | 0.093 | [11] | ||||||||
| [15] | ||||||||||||
| 061007 | 0.024 | 1.261 | 0.005 | [12],[13],[11] | ||||||||
| 070419A | 0.087 | 0.97 | 0.100 | [14] | ||||||||
| 070420 | 1.561 | [15], [24] | ||||||||||
| [6] | ||||||||||||
| 071031 | 0.036 | 2.692 | 0.102 | [16] | ||||||||
| 080129 | 3.046 | 4.394 | 0.355 | [17],[22] | ||||||||
| 080330 | 0.051 | 1.51 | 0.109 | [18] | ||||||||
| 080603A | 0.138 | 1.688 | 0.137 | [19] | ||||||||
| 080710 | 0.230 | 0.845 | 0.213 | [25] | ||||||||
| 080810 | 0.087 | 3.355 | 0.007 | [23] | ||||||||
| 090313 | 0.090 | 3.375 | 0.074 | This work |