-titleA Universe of Dwarf Galaxies 11institutetext: Gemini Observatory, 670 N. A’ohoku Pl, Hilo, HI 96720, USA 22institutetext: Institute for Astronomy, University of Hawaii, 2680 Woodlawn Dr., Honolulu, HI 96821, USA 33institutetext: Department of Physics and Astronomy, San Francisco State University, San Francisco, CA 94132, USA 44institutetext: Astrophysics Group, H.H. Wills Physics Laboratory, University of Bristol, Tyndall Avenue, Bristol BS8 1TL, UK 55institutetext: Kavli Institute for Astronomy and Astrophysics, Peking University, Beijing 100871, China 66institutetext: Institute of Astronomy, Madingley Road, Cambridge CB3 0HA, UK 77institutetext: Astrophysics Research Institute, Liverpool John Moores University, Twelve Quays House, Egerton Wharf, Birkenhead CH411LD, UK 88institutetext: Department of Physics and Astronomy, Johns Hopkins University, 3400 North Charles Street, Baltimore, MD 21218
UCDs in the Coma Cluster
Abstract
As part of the HST/ACS Coma Cluster Treasury Survey, we have undertaken a Keck/LRIS spectroscopic campaign to determine membership for faint dwarf galaxies. In the process, we discovered a population of Ultra Compact Dwarf galaxies (UCDs) in the core region of the Coma cluster. At the distance of Coma, UCDs are expected to have angular sizes R arcsec. With ACS imaging, we can resolve all but the smallest ones with careful fitting. Candidate UCDs were chosen based on magnitude, color, and degree of resolution. We spectroscopically confirm 27 objects as bona fide UCD members of the Coma cluster, a 60% success rate for objects targeted with . We attribute the high success rate in part to the high resolution of HST data and to an apparent large population of UCDs in Coma. We find that the UCDs tend to be strongly clustered around giant galaxies, at least in the core region of the cluster, and have a distribution and colors that are similar to globular clusters. These findings suggest that UCDs are not independent galaxies, but rather have a star cluster origin. This current study provides the dense environment datapoint necessary for understanding the UCD population.
1 Introduction
Ultra compact dwarf galaxies (UCDs) were first discovered only a decade ago in the nearby Fornax cluster (hil99, ; djgp00, ; phill01, ). Their compact sizes and broad range of colors make them nearly indistinguishable from stars in ground-based data. To date, UCDs and candidate UCDs have been discovered in several other nearby clusters along with a handful that have turned up in very poor environments (see e.g. jones06, ; mieske07, ; wehner07, ; mieske06, ; hau09, ; norris10, ). None, up to this point, had been confirmed in as rich and evolved an environment as the Coma cluster.
Post-discovery, attention has turned to revealing the nature of these unusual objects which have sizes in between those of globular star clusters and dwarf galaxies, unusually red colors, high M/L ratios which cannot be explained with canonical IMFs + baryonic matter, and, within the framework of certain models, difficult to explain ages and metallicities. Hypotheses in contention include formation via threshing whereby a nucleated dwarf elliptical is disrupted in multiple orbits by the strong tidal forces of a cluster or giant galaxy, such low surface brightness dE,N that the envelope is nearly invisible, formation of a giant star cluster from the mergers of super star clusters, and the simple extension of the bright tail of the globular cluster luminosity function to exceptionally bright magnitudes (djgp00, ; fk02, ; bekki03, ; has05, ; chil08, ).
We have undertaken a Keck/LRIS spectroscopic survey of dwarf galaxies in the Coma cluster as part of the HST/ACS Coma Cluster Treasury Survey (Carter et al., 2008). As part of this survey, we have conducted a search for UCDs in this very dense, rich, evolved environment. The aim has been to establish whether a population exists, and if so, characterize the properities, population size, and distribution in order to better understand the origin of these enigmatic objects.
If UCDs are formed from the threshing of dE,N, one would expect to find them in greater numbers than in lower density environments and with broader distributions, yet remain concentrated towards the cluster core. If instead, they are simply glorified globular clusters, one would expect to find physical properties and a distribution similar to that of the Coma cluster globular cluster population. They should also be associated with individual galaxies. A super star cluster merger scenario would predict that UCDs be associated with galaxies that had undergone major mergers and that they share similar metallicities and ages with other stars in the galaxy that formed during the same event. A star cluster origin would also predict enhanced alpha element ratios due to the expected short timescale of star bursts that produce star clusters. For an environment like the Coma cluster, the formation from the mergers of super star clusters, themselves formed during major galaxy mergers, would be unlikely. Instead these would have to be old populations, created in the smaller galaxy groups that eventually formed the Coma cluster.
2 The UCDs
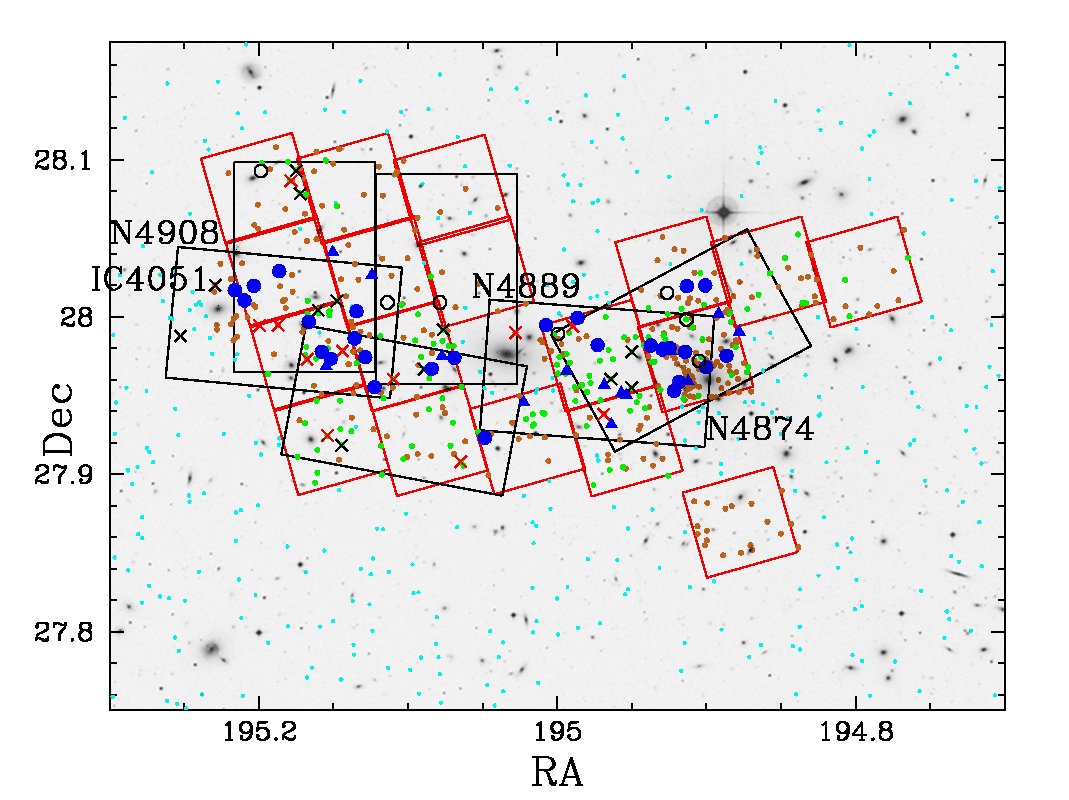
Candidate UCDs were initially chosen based on fairly broad color criteria ( and ). Since UCDs have typical sizes r pc corresponding to arcsec at the distance of the Coma cluster, the larger ones are just resolved. For this original sample we gave higher weight to those sources showing any sign of having a profile broader than a pure PSF. In an initial observing run, we targeted 47 candidates in 4 masks and confirmed 19 UCDs. Ten objects proved to be background galaxies or stars, while the remainder had too low S/N to measure reliable redshifts. For targets brighter than our completeness limit (), we find 66% of this sample are cluster members! A subsequent observing run with looser color and resolution criteria, and plagued by poor weather, turned up an additional 8 UCDs. This high success rate likely indicates the existence of a large population of UCDs in the Coma cluster, at least within the core region, although part of this success rate can also be attributed to the high spatial resolution of the ACS data. The locations of the 27 confirmed UCDs along with candidate UCDs are displayed in Figure 1. Objects which proved to be stars or background galaxies are also shown.
2.1 Properties
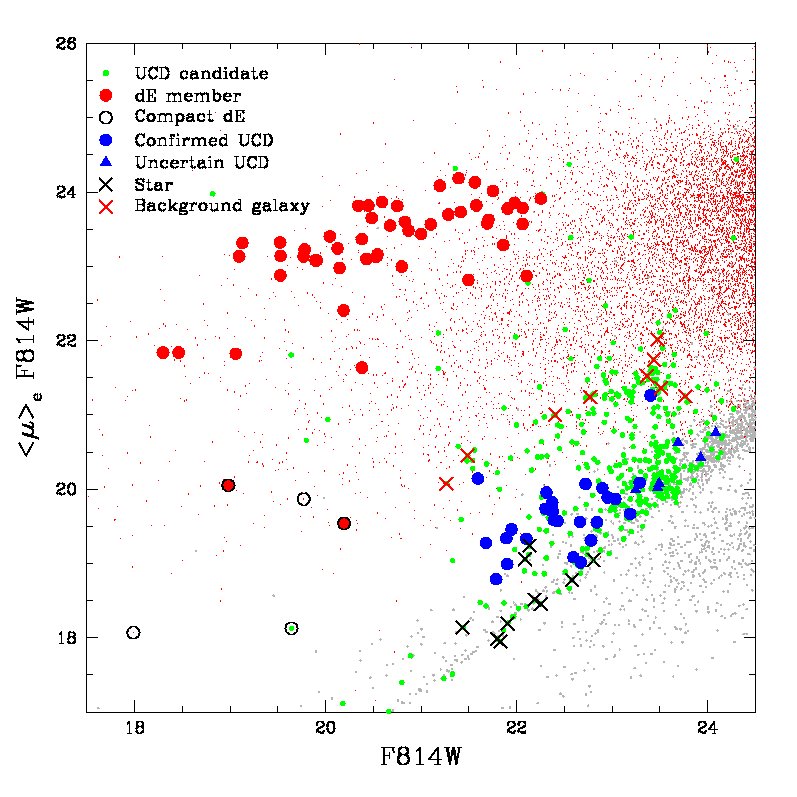
A magnitude - surface brightness diagram (Figure 2) showing both confirmed dE/dE,N cluster members and confirmed UCDs turns up two nearly parallel sequences, at the extremes in surface brightness. The dEs follow the well known dwarf galaxy magnitude - surface brightness relation while the UCDs fall near the stellar locus. However, unlike what comes out of ground-based data, the UCDs are separated from the stellar sequence, albeit with some overlap. Between these two cluster populations is largely the realm of background galaxies, although a few other members are noted. These are the compact dwarf ellipticals (cE) (Price et al., 2009), which either form a third population of member galaxies, or follow a continuous sequence with the UCDs. The latter possibility hinges on filling the 1.5 magnitude gap between the two populations, which we have thus far been unsuccessful in accomplishing.
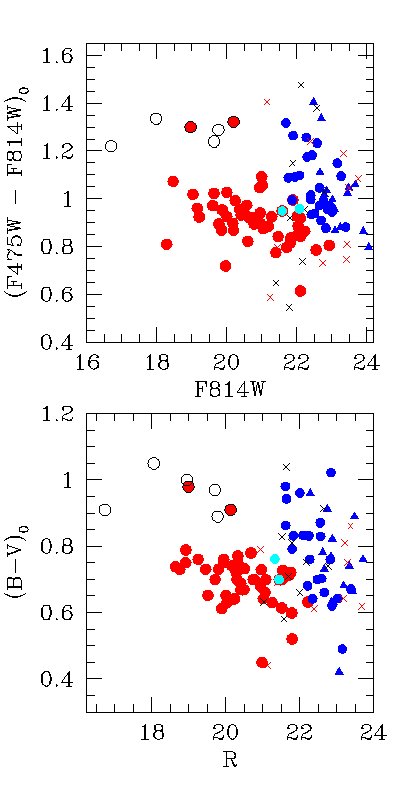
Color-magnitude diagrams (Figure 3) find a remarkably wide spread in UCD colors. The red sequence of normal dwarf galaxies is apparent, and a parallel but redder sequence of cE galaxies is noted. The UCDs meanwhile exhibit a spread of colors ranging between these two sequences and having a total extent of magnitudes in or .
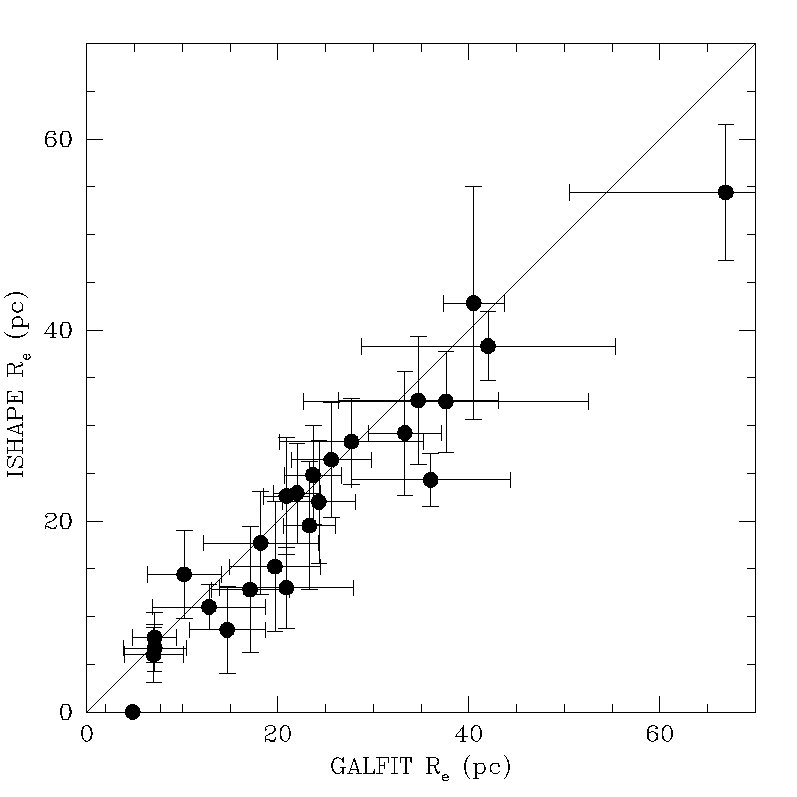
We have measured the sizes of the UCDs using the profile fitting software Galfit (peng02, ) and ishape (larsen, ). The former is used to fit Sersic profiles while the latter, a program ideal for fitting marginally resolved globular clusters, is used to fit King profiles. To convert angular sizes to physical effective radii, we assume a distance to the Coma cluster of 100 Mpc. The two measurements agree very well (Figure 4) and sizes are found to range between pc. Two objects are found with significantly larger sizes, but residuals from the fits show possible evidence for faint extended envelopes surrounding the objects.
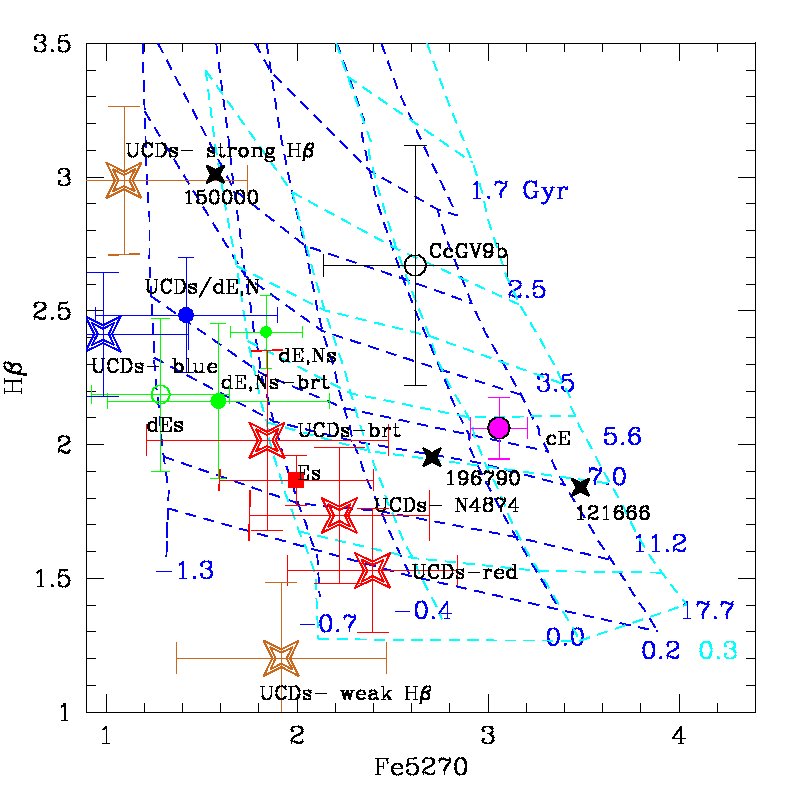
Stellar population abundances and ages are measured using the Schiavon (2007) models. We find that individual UCD spectra have too low S/N to measure abundances accurately. We therefore combine spectra of objects with similar color, distribution, or spectral properties (Figure 5). Although errorbars remain large even for the composite spectra, we find that UCDs display a large range in ages and metallicities, significant at . Blue UCDs () are found to have intermediate ages and metal poor populations, while red UCDs may have older ages and have much higher metallicities. There is some evidence for UCDs with very young populations. However, the UCD shown in the plot with a young age appears to have a faint extended envelope and may not even be in the same class of object as the other UCDs. The one cE for which we have two abundance measurements is both more metal rich and younger than the UCDs. Other cEs, from Price et al. (2009), have metallicities as low as those found for the red UCDs.
2.2 Distribution
The UCDs have thus far been found exclusively in the central core region, along a fairly narrow band in declination. This apparent structure through the core region may be due to small number statistics, although considering the full sample of good candidates (green points in Figure 1), we find very few candidates lying far north or south of this band. A strong concentration of confirmed and candidate UCDs is also seen around the cD galaxy NGC 4874. Fewer UCDs are found around NGC 4889, the other central giant, but this is possibly due to a gap in our ACS coverage at this location.
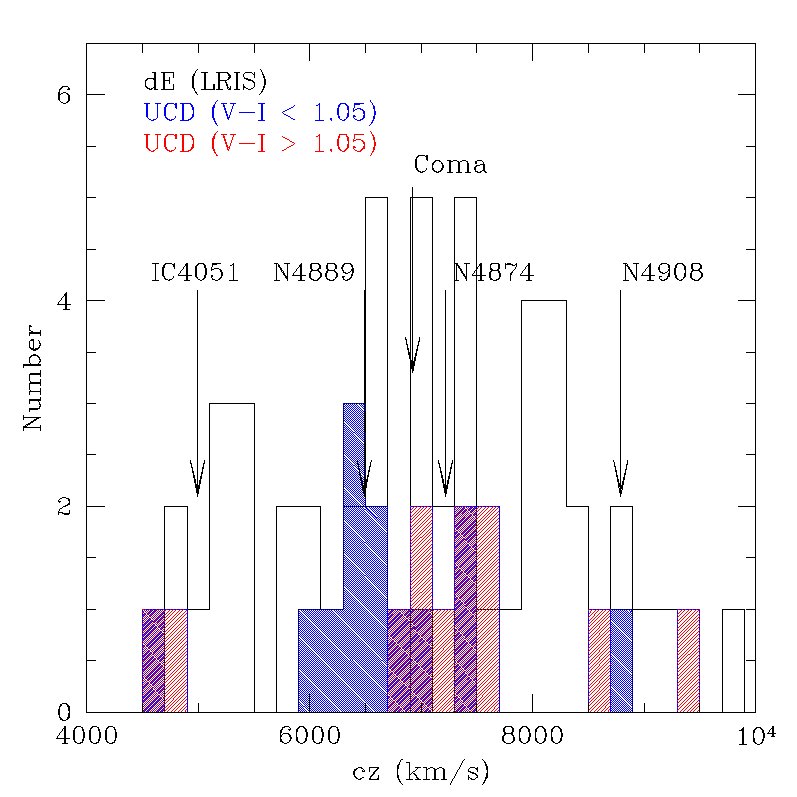
The mean radial velocity for the full set of confirmed UCDs is centered on the Coma cluster mean. A velocity dispersion of km/s for the UCDs is insignificantly lower than what we find for dEs in the same region. Velocity histograms are shown in Figure 6, with separation by UCD color. Peculiar velocities of prominent cluster giants are indicated. A large fraction of UCDs have velocities close to that of the cluster mean although there are a few outliers which have velocities similar to other cluster giants. When the UCDs are separated by color, they appear to split into two groups centered around the two central dominant giants. If we consider only UCDs with RA , we find km/s with km/s, while UCDs east of this have km/s and km/s. The differences are significant at the level.
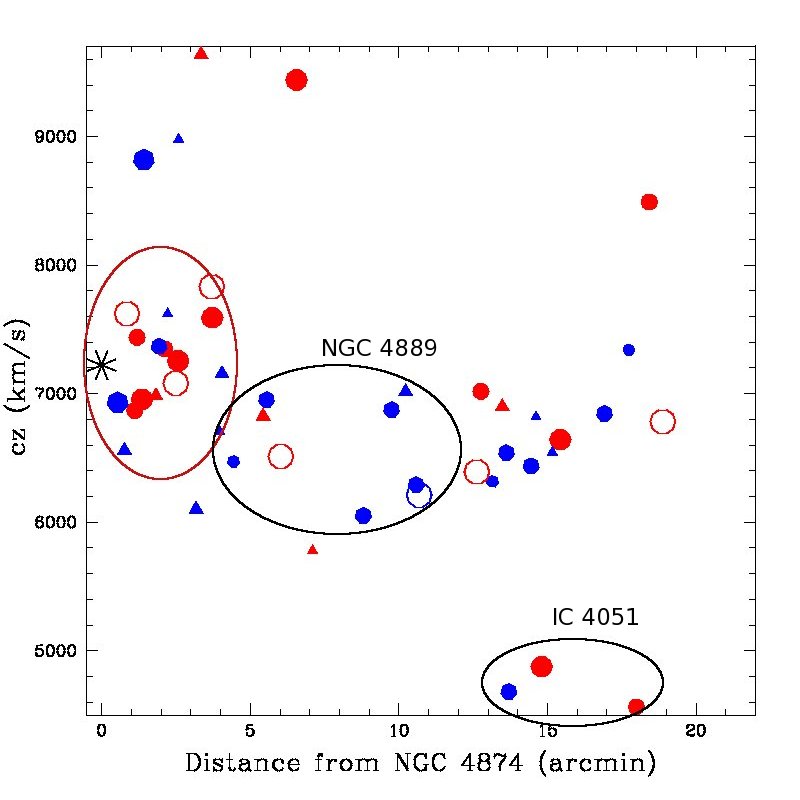
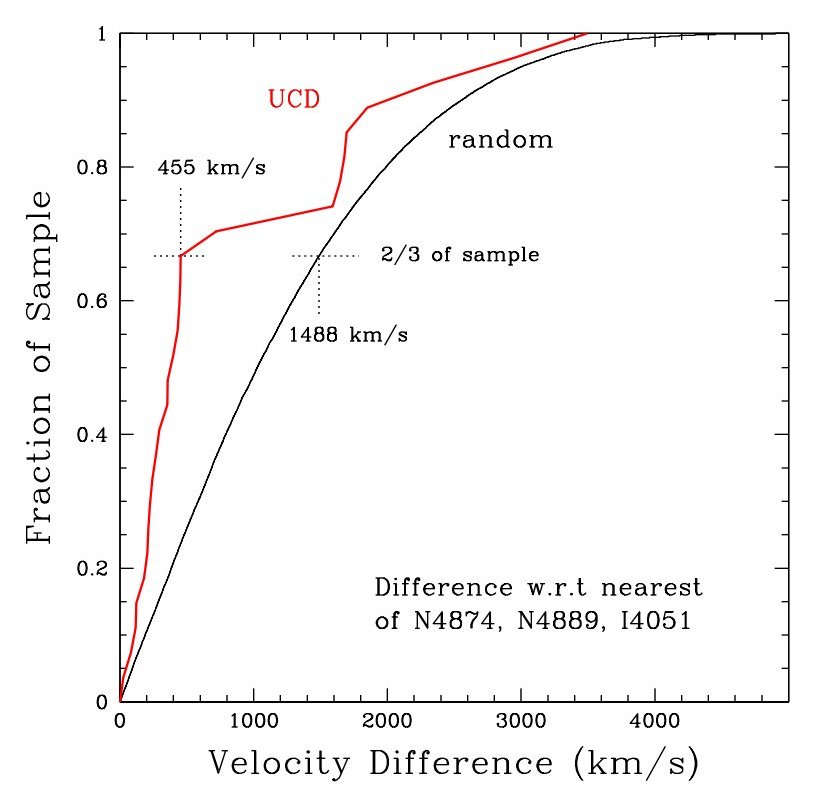
Of greater import, when we take into account spatial proximity with the central giants, we find 9 UCDs near NGC 4874 with km/s and km/s and 5 UCDs near NGC 4889 with km/s and km/s. The central giants NGC 4874 and NGC 4889 have peculiar velocities of 7220 and 6495 km/s respectively. We display possible associations of UCDs with three prominent giants in Figure 7. In Figure 8, we show the cumulative distribution of confirmed UCDs as a function of velocity difference with respect to the nearest of one of the 3 giants: NGC 4874, NGC 4889, and IC 4051. This is compared to the expectation for a spatially uniform distribution of objects having a Gaussian velocity distribution assuming the mean Coma cluster parameters. We find that 2/3 of the UCD sample exhibit a much stronger concentration around cluster giants than would be expected for a random distribution. Furthermore, based on the escape velocities and tidal radii for the 2 central giants, we expect that the UCDs which are coincident in space and velocity are bound to these galaxies. Similar isolation in space and velocity around other giants are noted, although in these cases, it is more difficult to disentangle the UCDs from the cluster potential.
3 Discussion
Overall we find the properties and distribution of the Coma cluster UCDs to be very similar to what has already been found for UCDs in other environments. Sizes, magnitudes, colors, metallicities, and even a distribution exhibiting strong associations with individual galaxies all agree with previous findings for UCDs.
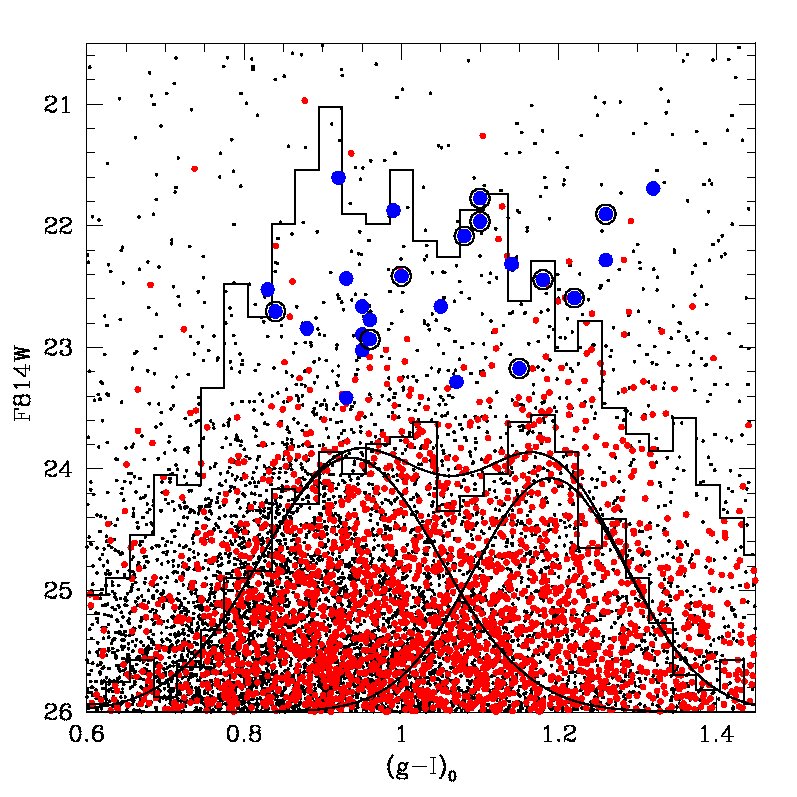
A comparison with the Coma Cluster globular cluster population hints at one potential origin. In Figure 9 we compare the color-magnitude diagram for GCs with our confirmed UCDs. We note a similar and very broad color spread for the UCDs, something not observed for normal dwarf galaxies. We also find no evidence for a discontinuity over the luminosity range between GCs and UCDs. In fact, due to this lack of any distinction in luminosity space, most of our UCDs are included in the GC list of Peng et al. (2010). The continuous extension of GC luminosities into the range of UCDs, in particular for the red branch of GCs, had been previously noted for compact stellar systems around the cD galaxy NGC 3311 (wehner08, ).
Comparing to the spatial distribution of GCs from Peng et al. (2010), we find a concentration of UCDs around NGC 4874 which also has a very high GC specific frequency. In addition we see a hint of an excess of UCD candidates towards IC 4051, which boasts one of the highest GC specific frequencies in the Coma cluster. Unfortunately, this galaxy lies just east of our ACS footprint. Confirmation of a large population of UCDs around this galaxy would provide strong support for a star cluster origin. Peng et al. (2010) also note a potential excess of GCs running E - W in a band through the core, in the same region where presently all confirmed UCDs reside, and where the majority of our best candidates are found (Figure 1).
Given this strong correlation with globular cluster properties and similar spatial distributions, we can argue that UCDs are consistent with simply constituting a bright extension of the globular cluster sequence. Arguments against this scenario have included the larger sizes found for UCDs and the discovery in a few UCDs of higher M/L ratios than can be explained with canonical IMFs and baryonic matter (has05, ). This would appear to invoke a need for dark matter, more in line with a galaxy rather than pure star cluster origin. However, recent work by Murray (2009) and Dabringhausen et al. (2009) find an explanation in terms of the physics at the time of formation of the star cluster which can account both for the larger sizes of UCDs and for the higher M/L ratios assuming a top heavy IMF.
The red UCDs are the most strongly clustered population and are primarily associated with the cD galaxy NGC 4874. This is perhaps expected since more massive galaxies tend to host both more massive and more metal rich globular clusters (peng06, ; harris09, ; hilker09, ). Some of the blue UCDs can be identified with specific giant galaxy hosts, while others may lie within the intracluster region. These lie along a band exactly where an excess of GCs has been noted (Peng et al., 2010). It is possible these are threshed nuclei of the same dwarfs who lost their globular clusters to the Coma cluster potential, although it is likewise possible that they are themselves simply stripped star clusters from giant galaxies.
In summary, although we cannot rule out the galaxy threshing hypothesis, we do find some support for a GC-UCD relationship. Besides having properties and a distribution similar to that of the Coma GCs, we find strong spatial and velocity correlations with the major galaxies and show that a majority of the confirmed UCDs reside within the halos of those galaxies. The UCDs furthermore exhibit color and metallicity correlations with at least some of the giant galaxies. NGC 4874 hosts a predominantly red population, while NGC 4889 is currently associated with only blue UCDs, although a radial gradient cannot be ruled out due to a missing observation centered on this galaxy. This differentiation in color by host suggests formation in discrete star formation events, from pre-enriched host environments. It is difficult to imagine how threshing of dE,N could produce a similar color/metallicity distribution.
A couple of the confirmed UCDs do show evidence for having extremely low surface brightness envelopes and may be entirely different entities. We also note that we find some similarities with the cE population, but a 1.5 magnitude gap currently separates these two populations. The majority of the UCDs are consistent with a star cluster origin.
References
- (1) M. Hilker, L. Infante, G. Vieira, M. Kissler-Patig, T. Richtler, A&AS 134, (1999), 75
- (2) M.J. Drinkwater, J.B. Jones, M.D. Gregg, S. Phillipps, PASA 17, (2000), 227
- (3) S. Phillipps, M.J. Drinkwater, M.D. Gregg, J.B. Jones, ApJ 560, (2001), 201
- (4) J.B. Jones, M.J. Drinkwater, R. Jurek, S. Phillipps, M.D. Gregg, K. Bekki, W.J. Couch, A. Karick, Q.A. Parker, R.M. Smith, AJ 131, (2006), 312
- (5) S. Mieske, M. Hilker, A. Jordán, L. Infante, M. Kissler-Patig, A&A 472, (2007), 111
- (6) E.M.H. Wehner, W.E. Harris, ApJL 668, (2007), L35
- (7) S. Mieske, M.J. West, C.M. de Oliveira, Groups of Galaxies in the Nearby Universe, edited by I. Saviane, V. D. Ivanov, & J. Borissova (2007), 103
- (8) G.K.T. Hau, L.R. Spitler, D.A. Forbes, R.N. Proctor, J. Strader, J.T. Mendel, J.P. Brodie, W.E. Harris, MNRAS 394, (2009), L97
- (9) M.A. Norris, S.J. Kannappan, BAAS 41, (2010), 528
- (10) M. Fellhauer, P. Kroupa, MNRAS 330, (2002), 642
- (11) K. Bekki, W.J. Couch, M.J. Drinkwater, Y. Shioya, MNRAS 344, (2003), 399
- (12) M. Haşegan, A. Jordán, P. Côté, S.G. Djorgovski, D.E. McLaughlin, J.P. Blakeslee, S. Mei, M.J. West, E.W. Peng, L. Ferrarese et al., ApJ 627, (2005), 203
- (13) I.V. Chilingarian, V. Cayatte, G. Bergond, MNRAS 390, (2008), 906
- Carter et al. (2008) D. Carter, P. Goudfrooij, B. Mobasher, H.C. Ferguson, T.H. Puzia, A.L. Aguerri, M. Balcells, D. Batcheldor, T.J. Bridges, J.I. Davies et al., ApJS 176, (2008), 424
- Price et al. (2009) J. Price, S. Phillipps, A. Huxor, N. Trentham, H.C. Ferguson, R.O. Marzke, A. Hornschemeier, P. Goudfrooij, D. Hammer, R.B. Tully et al., MNRAS 397, (2009), 1816
- Hammer et al. (2010) D. Hammer, G. Verdoes Kleijn, C. Hoyos, M. den Brok, M. Balcells, H.C. Ferguson, P. Goudfrooij, D. Carter, R. Guzman, R.F. Peletier et al., (2010), ArXiv:1005.3300
- Adami et al. (2006) C. Adami, J.P. Picat, C. Savine, A. Mazure, M.J. West, J.C. Cuillandre, R. Pelló, A. Biviano, C.J. Conselice, F. Durret et al., A&A 451, (2006), 1159
- Schlegel et al. (1998) D.J. Schlegel, D.P. Finkbeiner, M. Davis, ApJ 500, (1998), 525
- (19) C.Y. Peng, L.C. Ho, C.D. Impey, H.W. Rix, AJ 124, (2002), 266
- (20) S.S. Larsen, A&AS 139, (1999), 393
- Schiavon (2007) R.P. Schiavon, ApJS 171, (2007), 146
- Peng et al. (2010) E.W. Peng, H.C. Ferguson, P. Gudfrooij, D. Hammer, J.R. Lucey, R.O. Marzke, T.H. Puzia, D. Carter, ApJ submitted ,(2010)
- (23) E.M.H. Wehner, W.E. Harris, B.C. Whitmore, B. Rothberg, K.A. Woodley, ApJ 681, 1233 (2008), 681
- Murray (2009) N. Murray, ApJ 691, (2009), 946
- Dabringhausen et al. (2009) J. Dabringhausen, P. Kroupa, H. Baumgardt, MNRAS 394, (2009), 1529
- (26) E.W. Peng, A. Jordán, P. Côté, J.P. Blakeslee, L. Ferrarese, S. Mei, M.J. West, D. Merritt, M. Milosavljević, J.L. Tonry, ApJ 639, (2006), 95
- (27) W.E. Harris, J.J. Kavelaars, D.A. Hanes, C.J. Pritchet, W.A. Baum, AJ 137, (2009), 3314
- (28) M. Hilker, (2009), ArXiv:0906.0776