Strong-Lensing Analysis of MS 1358.4+6245: New Multiple Images and Implications for the Well-Resolved z=4.92 Galaxy
Abstract
We present a strong-lensing analysis of the galaxy cluster MS 1358.4+6245 (), in deep 6-band ACS/HST imaging. In addition to the well-studied system at , our modelling method uncovers 19 new multiply-lensed images so that a total of 23 images and their redshifts are used to accurately constrain the inner mass distribution. We derive a relatively shallow inner mass profile, ( kpc), with a much higher magnification than estimated previously by models constrained only by the system. Using these many new images we can apply a non-parametric adaptive-grid method, which also yields a shallow mass profile without prior assumptions, strengthening our conclusions. The total magnification of the galaxy is high, about a over its four images, so that the inferred source size, luminosity and star-formation rate are about smaller than previous estimates, corresponding to a dwarf-sized galaxy of radius kpc. A detailed image of the interior morphology of the source is generated with a high effective resolution of only 50 pc, thanks to the high magnification and to the declining angular diameter distance above for the standard cosmology, so that this image apparently represents the best resolved object known at high redshift.
keywords:
dark matter, galaxies: clusters: individuals: MS 1358.4+6245, galaxies: clusters: general, galaxies: high-redshift, galaxies: formation, gravitational lensing1 Introduction
The galaxy cluster MS 1358.4+6245 (also known as CL 1358+62; hereafter MS 1358) was first identified by Zwicky & Herzog (1968), and later classified as an X-ray luminous, rich cluster by Luppino et al. (1991) based on observations from the Einstein Observatory Extended Medium-Sensitivity Survey (EMSS; Gioia et al. 1990, Stocke et al. 1991). This cluster has been subject to intensive study, mainly due to its high X-ray luminosity and richness at an intermediate-high redshift (e.g., Henry et al. 1992, Carlberg et al. 1996, Poggianti & Barbaro 1996, Mushotzky & Scharf 1997, Nichol et al. 1997, Kelson et al. 1997), but became particularly famous when a pair of lensed galaxies were uncovered in its inner region by Franx et al. (1997). Subsequently, other such high- galaxies have been found in systematic surveys of galaxy clusters and in deep field imaging (e.g., Frye & Broadhurst 1998, Frye, Broadhurst & Benítez 2002, Kneib et al. 2004, Stark et al. 2007, Bouwens et al. 2004, 2009b, 2010, Bradley et al. 2008, Zheng et al. 2009).
Magnified objects are particularly useful, being generally bright enough to yield useful spectra, in particular the system in MS 1358 which has an especially well-resolved large fold image straddling the tangential critical curve. Detailed spectroscopy by Franx et al. (1997; see also Swinbank et al. 2009) has revealed asymmetric and redward shifted Ly-alpha emission relative to metal absorption lines, which is claimed to imply this galaxy is suffering an outflow of metal enriched gas (Franx et al. 1997), similar to local dwarf starburst galaxies (Dekel & Silk 1986, Heckman, Armus & Miley 1990). This spectral signature of gas outflow was shown to be a general property of galaxies, in the larger sample of lensed galaxies behind eight massive clusters, by Frye, Broadhurst & Benítez (2000), with implications for the enrichment of the IGM in general (Scannapieco & Broadhurst 2001).
In the past two decades other extensive studies have included or focused on MS 1358, ranging from X-ray to radio measurements and scaling relations (e.g., Cagnoni, della Ceca & Maccacaro 1998, Cooray et al. 1998, Ettori & Fabian 1999, Allen 2000, Wu 2000, Böhringer et al. 2000, Arabadjis, Bautz & Garmire 2002, Brown et al. 2003, McCarthy et al. 2003, Egami et al. 2006, Laroque et al. 2006, Morandi, Ettori & Moscardini 2007), to intracluster content and evolution studies (e.g., van Dokkum et al. 1998, Kelson et al. 2000a,b, 2006, Borgani et al. 1999, Fabricant, Franx & van Dokkum 2000, Ferreras & Silk 2000, Henry 2000, Kochanek et al. 2000, Tran et al. 2003, Postman et al. 2005, Holden et al. 2007), and arc statistics and searches (La Fèvre et al. 1994, Hattory, Watanabe & Yamashita 1997, Luppino et al. 1999, Oguri, Lee & Suto 2003, Wambsganss, Bode & Ostriker 2004, Sand et al. 2005).
Despite this broad study, only one multiply-lensed system has been hitherto identified in this cluster (the drop-out galaxy; Franx et al. 1997), so that no full SL analysis has been possible given the wide degeneracy of models with so few images. Franx et al. (1997) have presented a SL mass model based on the drop-out galaxy they uncovered, and various simplified mass models have been used by others (e.g., Allen 1998, Molikawa et al. 1999, Williams, Navarro & Bartelmann 1999), often based on isothermal potentials or spherical symmetry. Richard et al. (2008; see also Swinbank et al. 2009) have presented two unverified multiply-lensed candidates for which Ly-alpha emission has not been detected. Moreover, we note that for a cluster at , the lensing-distance ratio for sources at and differs by only , so that in order to meaningfully constrain the inner mass profile it is crucial to use other multiply-lensed systems at lower redshifts to expand the range of lensing-distances.
Here we use our well-tested approach to modelling in order find a significant number of multiple images across the central field of MS 1358 so that the mass distribution and its profile can be well constrained. This method was developed by Broadhurst et al. (2005a), and simplified further by Zitrin et al. (2009b) and has securely identified tens of multiple images in high quality HST/ACS (Advanced Camera for Surveys) images, of background sources behind several clusters with deep ACS/HST imaging, including Abell 1689, Cl0024+17 and a sample of 12 MACS clusters at (Broadhurst et al. 2005a, Zitrin et al. 2009b, Zitrin et al. 2010a). This is done with only six free parameters so that in practice the number of multiple images uncovered readily exceeds the number of free parameters as minimally required in order to obtain a reliable fit.
This approach to lens-modelling is based on the reasonable assumption that mass approximately traces light. Recently we have independently tested this assumption in Abell 1703 (Zitrin et al. 2010b), by applying the non-parametric technique of Liesenborgs et al. (2006, 2007, 2009) for comparison, which is also employed here. This latter technique employs an adaptive grid inversion method and does not require prior assumptions regarding the mass distribution, relying only on the images we have identified and their redshift estimates. For meaningful constraints, this approach to modelling requires many sets of multiple images, and over a wide range of background redshifts per cluster. This condition is well met for A1703 (Zitrin et al. 2010b) and this model-independent method yields a very similar mass distribution to our parametric technique in the case of A1703, supporting the assumption that mass generally traces light. Independently, it has been found that SL methods based on parametric modelling are accurate at the level of a few percent in determining the projected inner mass (Meneghetti et al. 2010).
The results of this work will be further combined with a wide-range WL data from deep Subaru imaging to provide the cluster mass profile out to the virial radius and beyond (Umetsu et al., in preparation). To date only a few clusters have been reliably analysed by combining both weak and strong lensing for a full determination of the mass profile and a definitive comparison with theoretical predictions, (e.g., Gavazzi et al. 2003, Broadhurst et al. 2005b, 2008, Merten et al. 2009, Newman et al. 2009, Okabe et al. 2009 and references therein, Umetsu et al. 2010, Zitrin et al. 2010b). The upcoming multi-cycle HST program of cluster imaging (the CLASH program111footnotetext: PI: Postman; http://www.stsci.edu/postman/CLASH/) will provide a much more definitive derivation of mass profiles for a statistical sample of relaxed, X-ray selected clusters, combining high resolution space imaging with deep, wide-field ground based data, for a definitive determination of the equilibrium mass profiles of virilised clusters.
Luppino et al. (1991) have measured the Brightest Cluster Galaxy (BCG) of MS 1358 at a redshift of . Other spectroscopic studies of many cluster member galaxies suggest a similar cluster redshift of , which is the redshift adopted here (e.g., Fabricant, McClintock & Bautz 1991, Carlberg et al. 1996, Yee et al. 1998, Fisher et al. 1998).
The paper is organised as follows: In §2 we describe the observations. In §3 we detail the SL analysis and in §4 we report and discuss the results, which are then summarised in §5. Throughout this paper we adopt a concordance CDM cosmology with (, , ). With these parameters one arcsecond corresponds to a physical scale of 4.75 kpc for this cluster (at ). The reference centre of our analysis is fixed at the centre of the BCG: RA = 13:59:50.55 Dec = +62:31:05.00 (J2000.0).
2 Observations and Photometric Redshifts
MS 1358 was observed with the Wide Field Channel (WFC) of the ACS installed on HST in the framework of the ACS Guaranteed Time Observations (GTO; PI: Ford, H.; program IDs 9292, 9717, 10325) which includes deep observations of several massive, intermediate-redshift galaxy clusters (Ford et al. 2003). Integration times of 7928, 5470, 5482, 9196, 13552 and 17757 seconds were obtained through the F435W, F475W, F555W, F625W, F775W, and F850LP () filters, respectively. Some important aims of the GTO program were the determination of the mass distribution of clusters for testing the standard cosmological model and to study distant, background lensed galaxies for which some of the very highest redshift galaxies are found because of high magnification by massive clusters.
Mass models and detailed lensing analyses have been presented for most of the GTO clusters (e.g., Broadhurst et al. 2005a, Elíasdóttir et al. 2007, Jee et al. 2007, Lemze et al. 2008, 2010, Limousin et al. 2008, Richard et al. 2009, Umetsu et al. 2010, Zitrin et al. 2009b, 2010b, Coe et al. 2010, Medezinski et al. 2010). In this work, we present a strong lensing (SL) analysis of the ACS images of MS 1358, and detect several multiple-image systems so the mass profile of this cluster can be reliably constrained as well.
The ACS images were initially reduced, processed, and analysed by APSIS, the ACS GTO pipeline (Blakeslee et al. 2003). An optimal detection image was created as a weighted sum of all filters, each divided by its background RMS. Objects were detected and photometry obtained using SExtractor (Bertin & Arnouts 1996).
The light of cluster galaxies was carefully modelled in each filter and subtracted from the images. This improves both the detection and photometry of lensed background objects. Based on this photometry, we obtain photometric redshifts using BPZ (Benítez 2000, Benítez et al. 2004, Coe et al. 2006). The distances to the galaxies are, of course, key ingredients to the lens model.
3 Strong Lensing Modelling and Analysis
We apply our well tested approach to lens modelling, which has previously uncovered large numbers of multiply-lensed galaxies in ACS images of Abell 1689, Cl0024, and 12 high- MACS clusters (respectively, Broadhurst et al. 2005a, Zitrin et al. 2009b, Zitrin & Broadhurst 2009, Zitrin et al. 2009a, 2010a,b). Briefly, the basic assumption adopted is that mass approximately traces light, so that the photometry of the red cluster member galaxies is used as the starting point for our model. Cluster member galaxies are identified as lying close to the cluster sequence by the photometry described in §2.
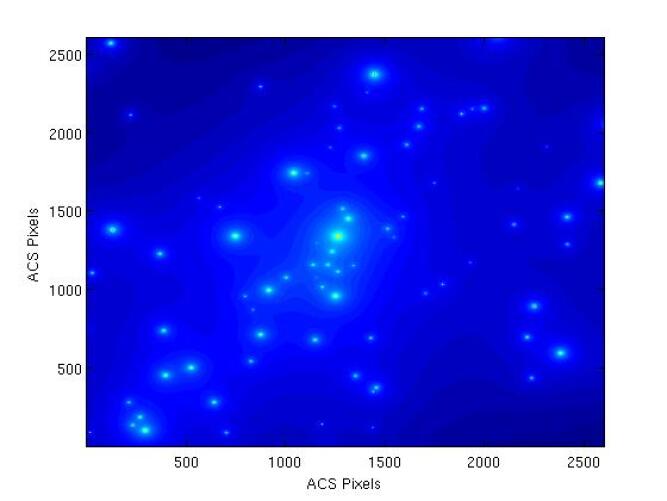
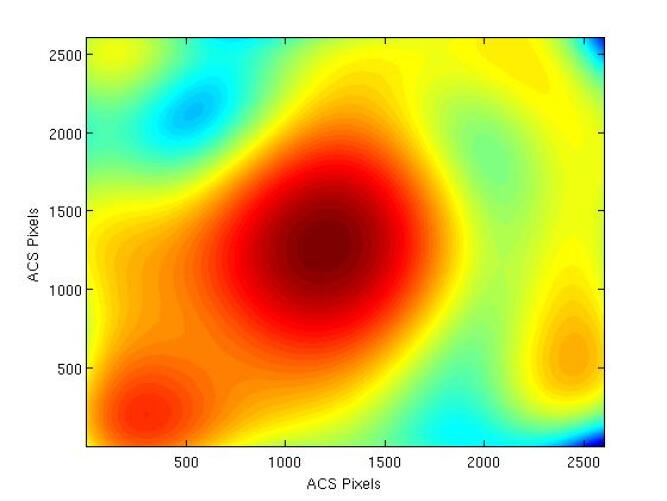
We approximate the large scale distribution of cluster mass by assigning a power-law mass profile to each galaxy (see Figure 1), the sum of which is then smoothed (see Figure 2). The degree of smoothing () and the index of the power-law () are the most important free parameters determining the mass profile. A worthwhile improvement in fitting the location of the lensed images is generally found by expanding to first order the gravitational potential of this smooth component, equivalent to a coherent shear describing the overall matter ellipticity, where the direction of the shear and its amplitude are free parameters, allowing for some flexibility in the relation between the distribution of DM and the distribution of galaxies, which cannot be expected to trace each other in detail. The total deflection field , consists of the galaxy component, , scaled by a factor , the cluster DM component , scaled by (1-), and the external shear component :
| (1) |
where the deflection field at position due to the external shear, , is given by:
| (2) |
| (3) |
where is the displacement vector of the position with respect to a fiducial reference position, which we take as the lower-left pixel position , and is the position angle of the spin-2 external gravitational shear measured anti-clockwise from the -axis. The normalisation of the model and the relative scaling of the smooth DM component versus the galaxy contribution brings the total number of free parameters in the model to 6. This approach to SL is sufficient to accurately predict the locations and internal structure of multiple images, since in practice the number of multiple images uncovered readily exceeds the number of free parameters thus fully constraining them.
In addition, two of the six free parameters can be primarily set to reasonable values so only 4 of these parameters have to be constrained initially, which sets a very reliable starting-point using obvious systems. The mass distribution is therefore primarily well constrained, uncovering many multiple-images which can then be iteratively incorporated into the model, by using their redshift estimation and location in the image-plane.
Firstly we use this preliminary model to lens the more obvious lensed galaxies back to the source plane by subtracting the derived deflection field, and then relens the source plane to predict the detailed appearance and location of additional counter images, which may then be identified in the data by morphology, internal structure and colour. We stress that multiple images found this way must be accurately reproduced by our model and are not simply eyeball “candidates” requiring redshift verification. The best fit is assessed by the minimum RMS uncertainty in the image plane:
| (4) |
where and are the locations given by the model, and and are the real image locations, and the sum is over all images. The best-fit solution is unique in this context, and the model uncertainty is determined by the location of predicted images in the image plane. Importantly, this image-plane minimisation does not suffer from the well known bias involved with source plane minimisation, where solutions are biased by minimal scatter towards shallow mass profiles with correspondingly higher magnification.
The model is successively refined as additional sets of multiple images are incorporated to improve the fit, importantly using also their redshift information for better constraining the mass slope through the cosmological relation of the growth.
In order to examine our results, we also apply the adaptive-grid, non-parametric modelling method of Liesenborgs et al. (2006, 2007, 2009), which makes no prior assumptions regarding the mass distribution. In a recent work, we have made a more thorough comparison of these methods by analysing the well studied cluster Abell 1703 (Zitrin et al. 2010b). We showed that the results of these two distinct approaches are very similar when sufficient data constraints are available. The effective area modelled with the non-parametric technique is limited to roughly the critical area, beyond which there are very few multiple-images that can be used to reliably constrain the fit. Some discrepancy may be expected with regards to the mass distribution between the two methods, especially when not enough constraints are available. However, aside from minor local trade-offs originating in the mass-sheet degeneracy or in the inclusion of cluster members, the overall profile can be expected to be similar in order to maintain the cosmological lensing-distance ratio of the various systems.
4 Results and Discussion
4.1 Multiple-Images, Mass Model and Critical Curves
| ARC | RA | DEC | Min | Max | Best | Comment | |
| ID | (J2000.0) | (J2000.0) | (95% C.L.) | (95% C.L.) | |||
| 1.1 | 13:59:48.689 | +62:30:48.00 | – | – | 4.92 | spec- | |
| 1.2 | 13:59:49.239 | +62:30:45.30 | – | – | 4.92 | ” | ” |
| 1.3 | 13:59:49.564 | +62:30:49.32 | – | – | 4.92 | ” | ” |
| 1.4 | 13:59:54.812 | +62:31:04.52 | – | – | 4.92 | ” | ” |
| 2.1 | 13:59:50.454 | +62:31:28.83 | 0.25 | 3.93 | 3.42 | Bimodal | |
| 2.2 | 13:59:51.949 | +62:31:28.20 | 0.18 | 3.48 | 0.53 | ” | Bimodal |
| 3.1 | 13:59:51.097 | +62:31:14.73 | – | – | – | NA | |
| 3.2 | 13:59:52.333 | +62:31:11.30 | 1.68 | 2.39 | 2.04 | ” | |
| 3.3 | 13:59:47.077 | +62:30:59.44 | 1.67 | 2.39 | 2.03 | ” | |
| 4.1 | 13:59:50.729 | +62:31:17.28 | 1.82 | 2.59 | 2.22 | ||
| 4.2 | 13:59:52.592 | +62:31:13.88 | 1.76 | 2.49 | 2.13 | ” | |
| 4.3 | 13:59:47.328 | +62:31:02.60 | 1.68 | 2.39 | 2.04 | ” | |
| 5.1 | 13:59:50.197 | +62:31:15.38 | 1.67 | 2.38 | 2.02 | ||
| 5.2 | 13:59:52.879 | +62:31:12.70 | 1.67 | 2.38 | 2.02 | ” | |
| 5.3 | 13:59:48.046 | +62:31:04.65 | 1.67 | 2.38 | 2.03 | ” | |
| 6.1 | 13:59:52.131 | +62:30:59.22 | 1.61 | 2.39 | 2.00 | ||
| 6.2 | 13:59:51.723 | +62:30:56.91 | 1.41 | 2.26 | 1.77 | ” | |
| 6.3 | 13:59:48.150 | +62:30:58.05 | 1.34 | 2.67 | 1.80 | ” | |
| 7.1 | 13:59:50.897 | +62:30:27.83 | – | – | – | NA | |
| 7.2 | 13:59:51.330 | +62:30:28.06 | – | – | – | NA | |
| 8.1 | 13:59:50.087 | +62:30:44.59 | 1.76 | 2.50 | 2.13 | ||
| 8.2 | 13:59:48.737 | +62:30:46.85 | 1.84 | 2.60 | 2.23 | ” | |
| 8.3 | 13:59:53.746 | +62:30:59.07 | 1.79 | 2.53 | 2.16 | ” | |
| c1a | 13:59:50.252 | +62:31:27.06 | 1.77 | 2.51 | 2.14 | ||
| c1b | 13:59:51.952 | +62:31:26.86 | 1.67 | 2.39 | 2.03 | ||
| c1c | 13:59:47.656 | +62:31:18.25 | 1.68 | 2.40 | 2.04 | — | |
| c2a | 13:59:50.354 | +62:31:24.84 | 0.73 | 5.53 | 4.84 | Bimodal | |
| c2b | 13:59:52.638 | +62:31:24.04 | 0.57 | 4.81 | 0.78 | ” | Bimodal |
| c2c | 13:59:53.585 | +62:31:19.68 | – | – | – | ” | Similarly red |
| c2d | 13:59:52.644 | +62:31:20.19 | – | – | – | ” | Similarly red |
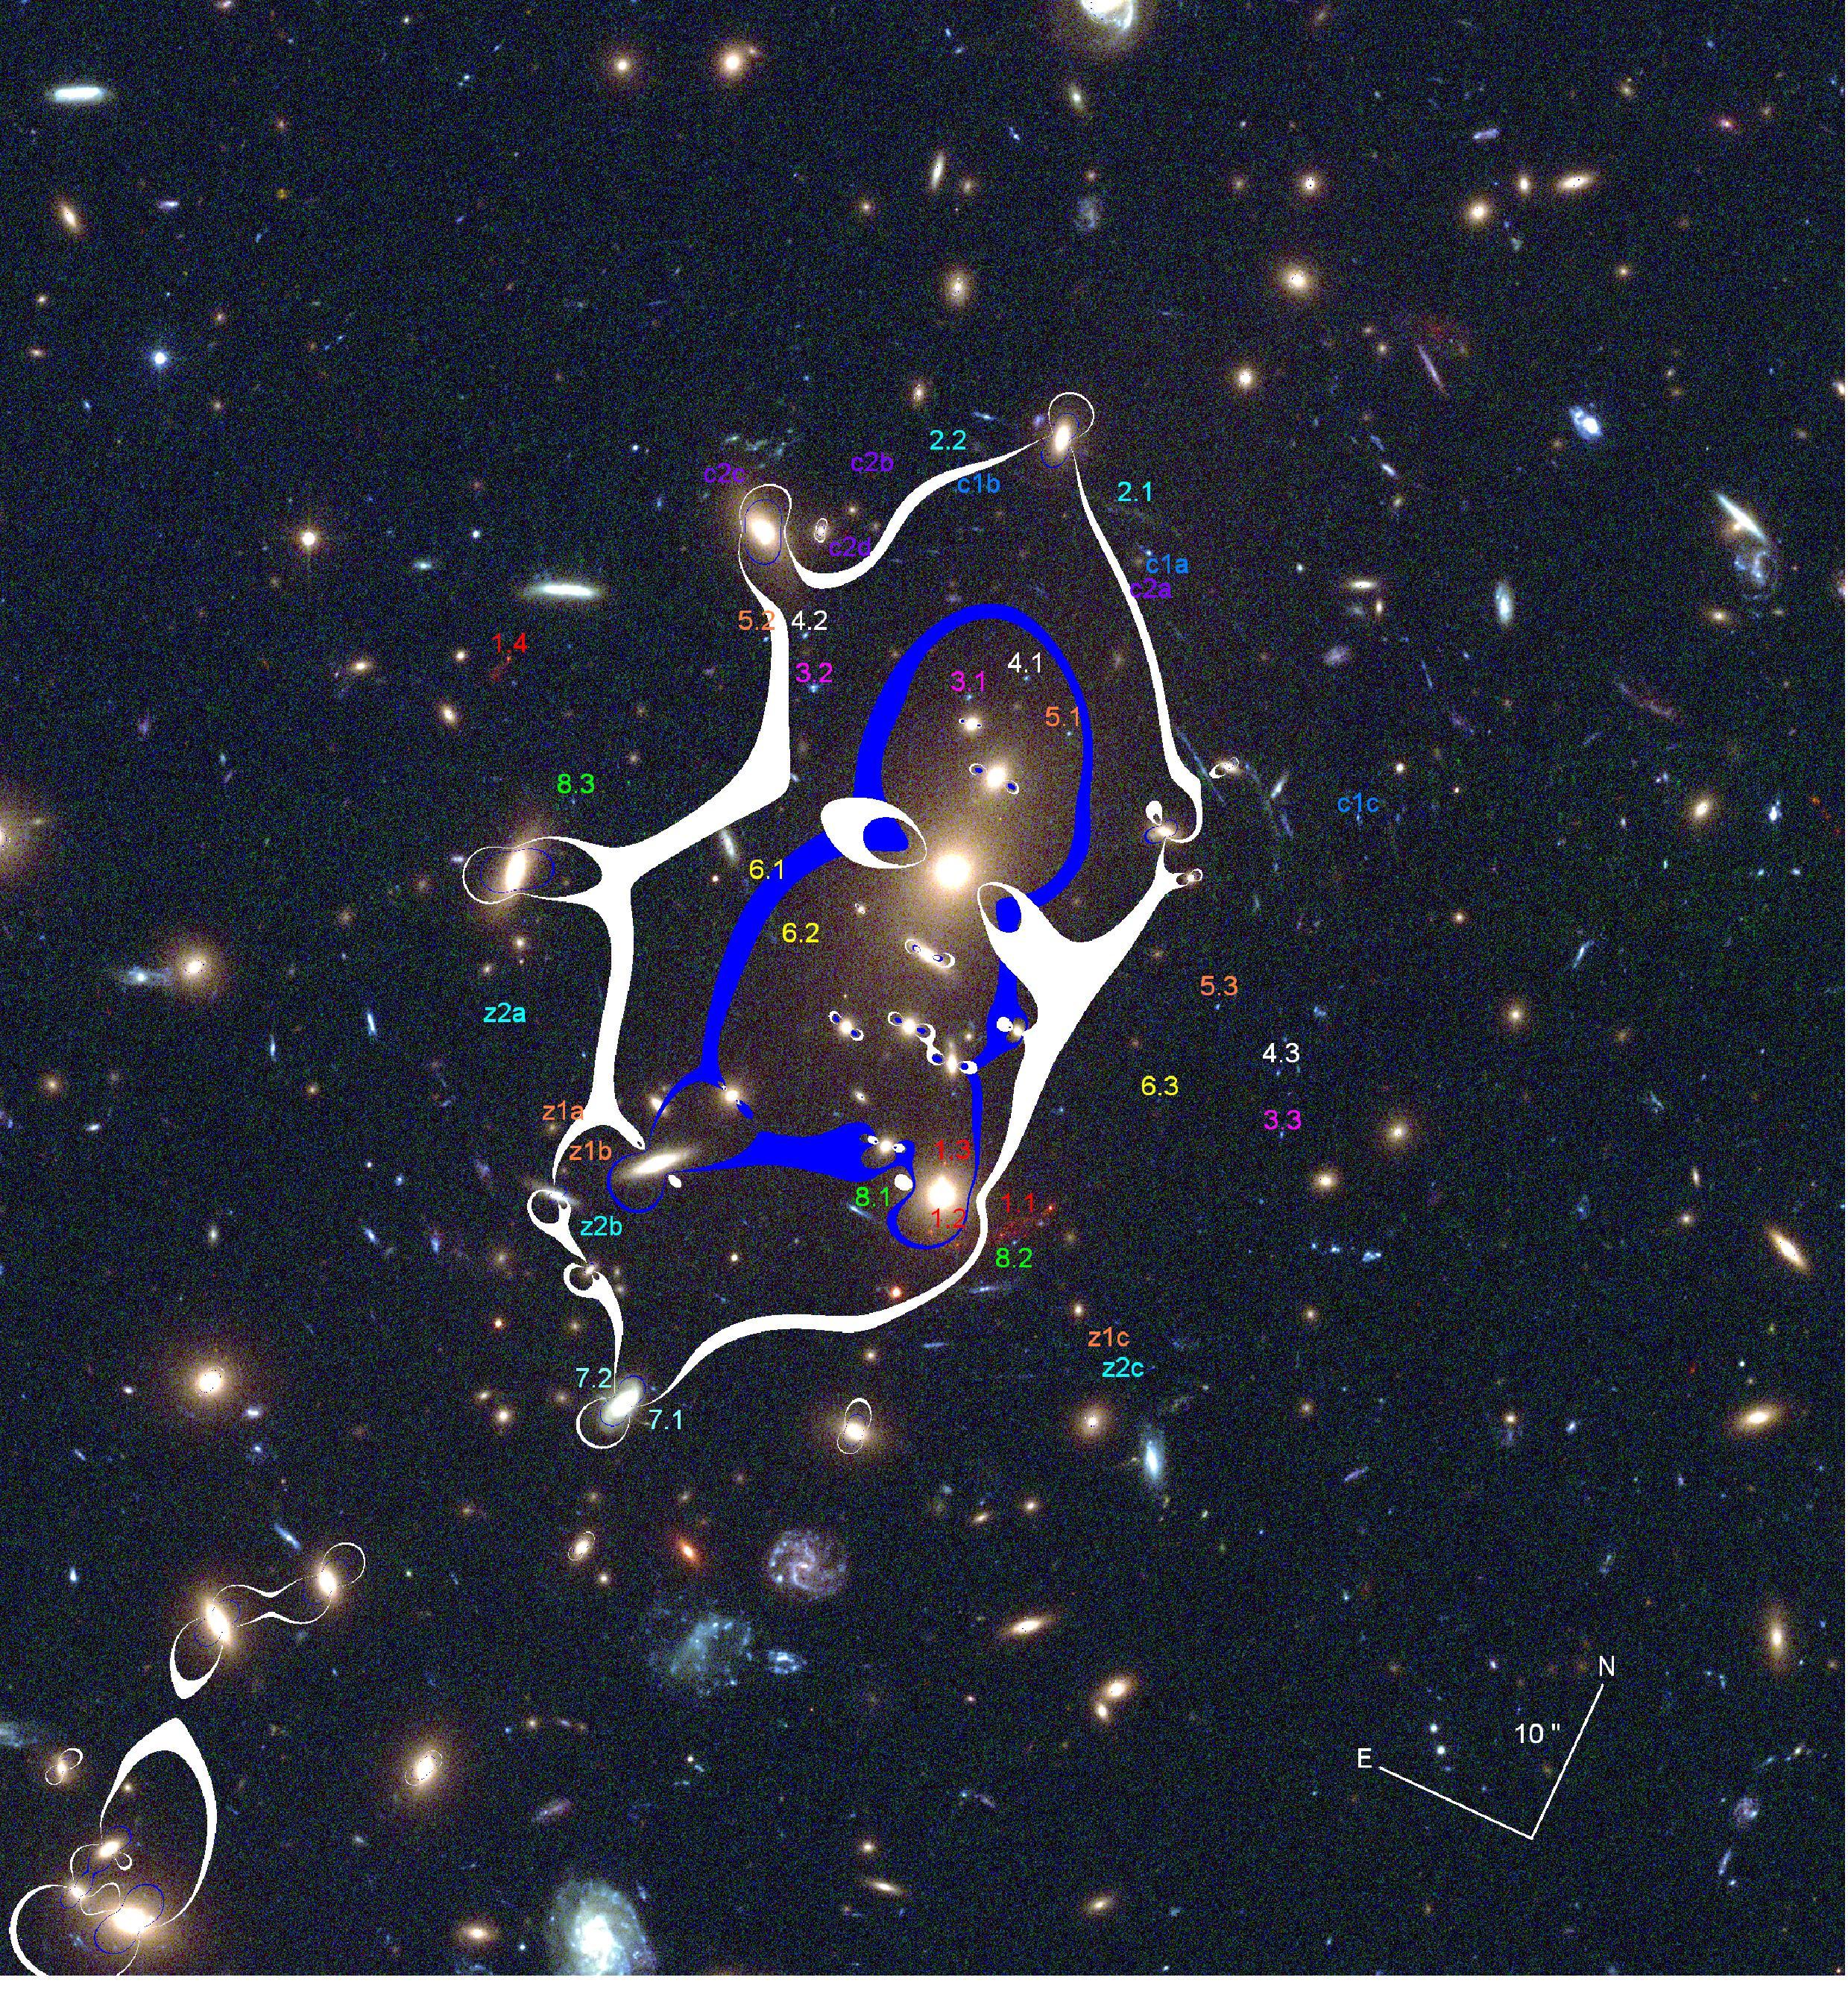
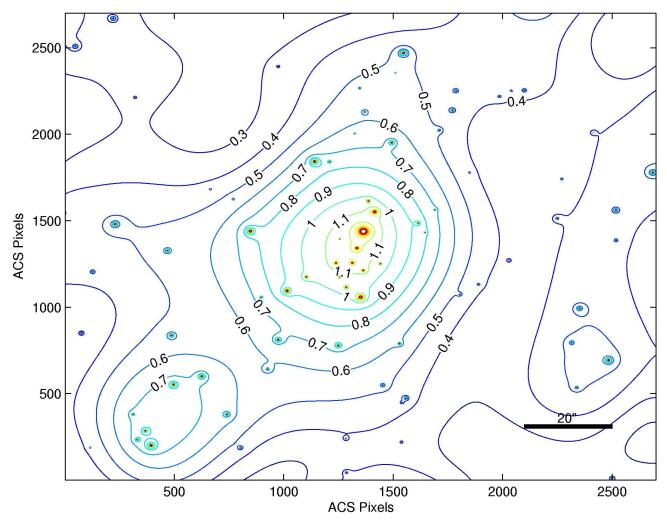
In addition to the four previously-known lensed images of the dropout galaxy (Franx et al. 1997), our modelling technique has uncovered 19 new multiply-lensed images in the central field of MS 1358, belonging to 7 new systems. We have made use of the location and photometric redshift information of these images to fully constrain the mass model. We find that the critical curves for a source at (system 1) enclose an area with an effective Einstein radius of , or 100 kpc at the redshift of the cluster. This critical curve we find (see Figure 3) encloses a projected mass of . For a source redshift of the effective Einstein radius is , enclosing a projected mass of around the BCG. For general comparison, this is in very good agreement with the Einstein radius-mass scaling relation for a source at , found in Zitrin et al. 2010a (taking into account also the different lens distances; see Figure 27 therein). The corresponding critical curves are plotted on the cluster image in Figure 3 along with the multiply-lensed systems. The resulting mass distribution and its profile are shown in Figures 4 and 5.
Note that another small critical curve is formed around the group of bright cluster galaxies to the south, whose prominence is hard to determine due to lack of multiple-images at that region. We note that if this southern clump is somewhat more massive than presented here, the critical curves may merge with the central main critical curves to form a larger more elongated critical region. This however does not seem probable as only few arcs are seen in between, and thus rule out the existence of such an extended critical curve.
Several mass models have been created in earlier work, describing the critical curves and mass distribution based only on system 1 (). Franx et al. (1997) used isothermal potentials with which they were able to reconstruct the images of this system. They find an Einstein radius of , similar to our result. Allen (1998) has calculated a total mass of with 20% uncertainty, within a radius of 121 kpc (), in good agreement with our result considering the Einstein radius difference. Other mass models made for this cluster based on projected WL profiles and circular symmetry, derive similar or slightly smaller values (see Diaferio, Geller & Rines 2005, e.g., Hoekstra et al. 1998, 2007, Arabadjis, Bautz & Garmire 2002, Takahashi & Chiba 2007).
It should be stressed that the multiple-images found here are accurately reproduced by our model and are not simple identifications by eye. The parametric method of Zitrin et al. (2009b) has been shown in many cases to have the predictive power to find multiple images in clusters. Due to the small number of parameters this model is initially well-constrained enabling a reliable identification of other multiple-images in the field, which are then used to fine-tune the mass model. We now detail each multiply-lensed system in turn, as listed in Table 1:
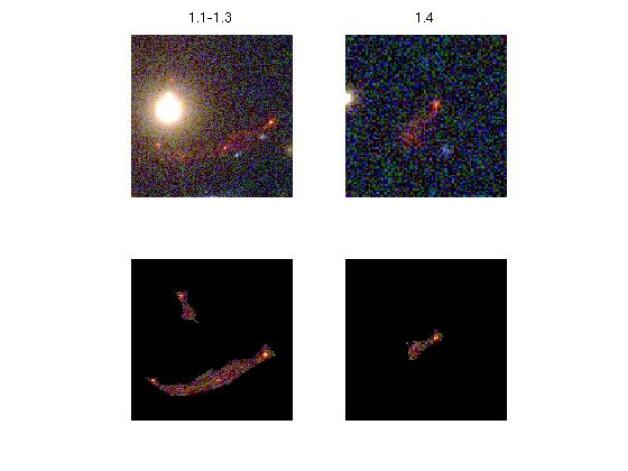
A high-redshift dropout galaxy at . The four images of this multiply-lensed source were found by Franx et al. (1997) who also measured its redshift. Two of the multiple-images of this system (1.1/1.2), form a prominent red fold-arc about south-west of the BCG, next to another bright cluster member (see Figure 3). Image 1.3 is a smaller image on the other side of that cluster member, and image 1.4 is east of the BCG. These images are well reproduced by our model, as seen in Figure 6. According to our model, the angular area of the source is (see Figure 7), and is therefore magnified about a 100 times in area, summed over all four images which in total subtend in the image-plane (see also §4.2).
A long faint arc north of the BCG, next to a bright cluster member. Our model reproduces this arc accurately at a redshift of , similar to the photometric redshift of image 2.1. The photometric redshift of image 2.2 is double peaked, with peaks around 0.5 and 3.4, the latter in agreement with our model. In addition, the clearly lensed arc lies away from the BCG and should have a relative high redshift in order to be lensed, further strengthening our match. Another similar looking candidate is seen to the right of image “c1c” (see Figure 3), but as can be seen the critical curves do not pass between these images and thus this third candidate is not probable in the context of our model.
These three systems consist of typical blue and white arclets seen in large amounts in lensing clusters. Systems 3-5 follow a similar symmetry, as can been seen in Figure 3. One image of each system appears north of the BCG, the second image appears east of the BCG and the third image to its west. These three systems have similar typical photometric redshifts of (see Table 1), and due to their close vicinity and similar appearance were hard to match accurately, especially in the case of the third images to the west. We therefore note that there can be an irrelevant mix-up with regards to the third image of each of these three systems, but since the distances between them are small this does not affect the resulting mass model. In addition, due to a minor, northwards offset in the image-plane reproduction of images 4.3 and 5.3, we acknowledge the possibility that there are other similar-looking spots which may correspond to these systems, but have a negligible effect on the mass model.
Two blue faint images with mirror symmetry lying on two sides of the critical curve for a source at by our model. Their photometric redshifts are and , respectively, where the first may be affected by a nearby galaxy light. Our model predicts the extra small and faint spec on the other side of the cluster about south-west of the BCG, as identified in the data.
Two greenish small images on two sides of a bright galaxy. These lack photometric redshifts due to the vicinity of the galaxy, and our model reproduces them accurately at .
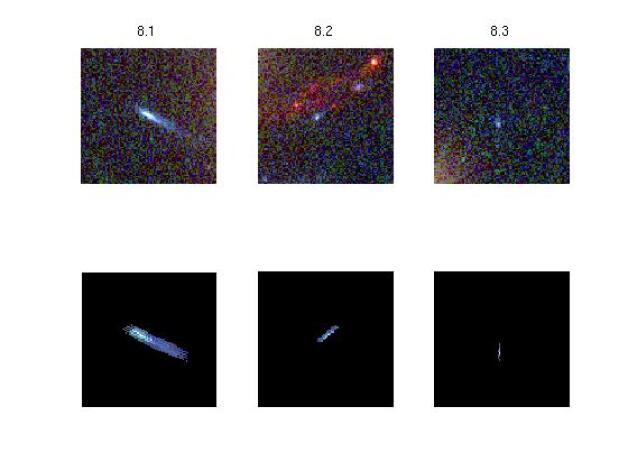
Three blue and white relatively bright images of a galaxy, following similar symmetry as system 1. Our model reproduces these images very well at this redshift, as seen in Figure 8. Note in Figure 1 the highly magnified region near the location of image 8.1, which explains its larger appearance relatively to images 8.2 and 8.3.
Other candidate systems and image identification uncertainty: A similar symmetry to that systems 2-5 follow, can be expected in the northern region of the cluster between the BCG and system 2. Moreover, several images in the west side of the cluster (marked in Figure 1) resemble their corresponding image candidate near system 2, and have reasonably similar photo-’s. However, according to our model these candidate systems are not being lensed in full or in their expected photometric redshifts and we therefore exclude them from our secure identification.
System “c1” consists of two bright blue-white arclets which seem to have mirror symmetry (“c1a” and “c1b”), and an additional similar looking arclet, “c1c”, south-west of them. These have a photometric estimate of and as can be seen in Figure 1 are north of the critical curve for a such a source, so that they are not lensed by our model. This may be artificially overcome if one boosts the mass obtained by the nearby galaxy, but then system 2 would not correspond to its photometric redshift. In addition, both this system, and system 2, have candidates to the west, which are not generated by our model, since there is no extra apparent mass nor galaxies between these locations, so the critical curve does not pass between them. One can significantly boost the nearby galaxies to create a mass lump which might produce images at that region; however, it should be noted that such actions are rarely justified and have not been critically required in any of the many clusters we have analysed to date. We conclude that despite the similar appearance this system is not probable in the context of our model.
System “c2” is a much more probable candidate consisting of four red drop-out arclets. Our model reproduces and therefore identifies arcs “c2c” and “c2d” as the same system in any redshift in the range 3 to 5. Arcs “c2a” and “c2b” are obtained as part of this system only in redshifts higher than , corresponding to the photometric redshift of arcs “c2a” and “c2b”, of . Still, we decided not to include it as a secure system since the redshift agreement is marginal and the distance in the image-plane reproduction of arcs “c2a” and “c2b” (from their observed location) is larger than our typical uncertainty.
Systems “z1” and “z2” are multiple-images of dropout candidates, claimed as possibilities by Richard et al. (2008). In Figure 3 we mark their approximate locations generated by our model (see Figure 12 in Richard et al. 2008). We did not use these candidate images to constrain the model, but verified that they are plausible high- objects in the context of our model (for the lensing-distance of sources at is only bigger than the lensing distance of the galaxy, so that redshifts throughout that range are plausible in that context).
4.2 Mass Profile and High Magnification
We mentioned in the preceding sections that the profile can only be accurately constrained by incorporating the cosmological redshift-distance relation, i.e., the lensing distance of each system based on the measured spectroscopic or photometric redshifts. In so doing we normalise our mass model to system 1, so that the normalised scaling factor, , is equal to 1. We then make use of the lower- systems, in particular the systems (number 3,4,5 and 8) and the system (number 2), whose photometric redshifts we find most credible to constrain the profile.
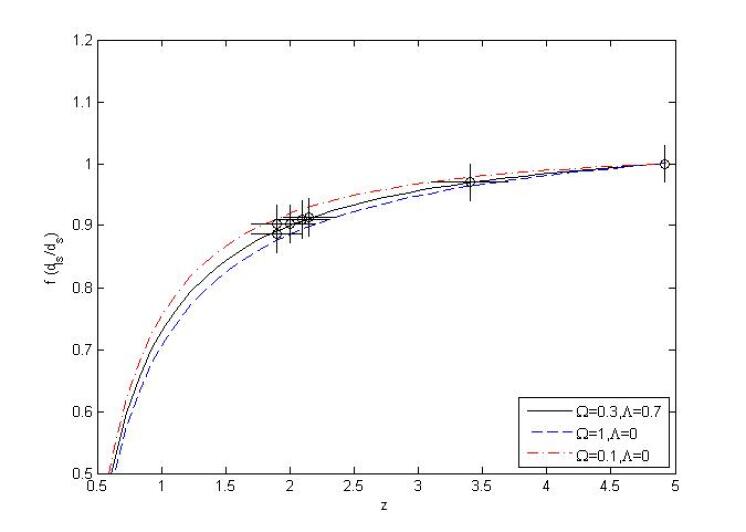
We examine how well the cosmological relation is reproduced by our model, accounting for all systems with photo-’s, as shown in Figure 9. Clearly the redshifts of these systems verify very well that the predicted deflection of the best fitting model at the redshift of each of these systems, lies accurately along the expected cosmological relation, with a mean deviation of only (see Figure 9), and for the best model, considerably strengthening the plausibility of our approach to modelling in general.
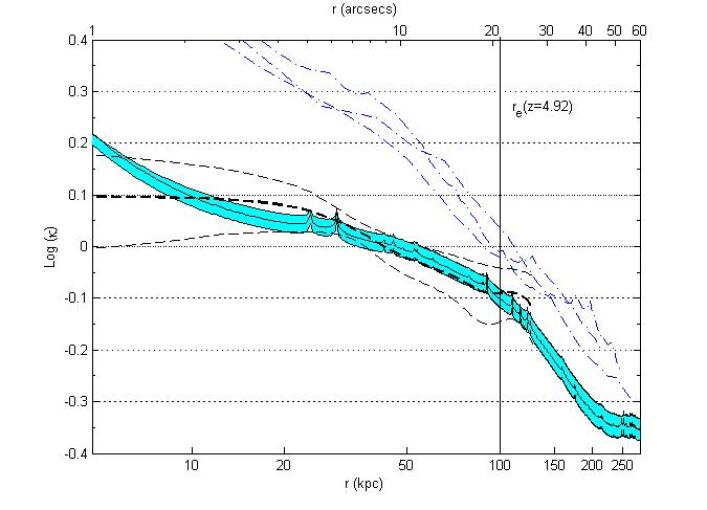
We find that unlike other well-known lensing clusters such as Abell 1689, Abell 1703 or Cl0024+17, which all have a typical profile slope of (see Broadhurst et al. 2005a, Zitrin et al. 2009b, 2010b), MS 1358 has a relatively shallow profile slope of only in its main critical region of [3″,21″], increasing to in twice the critical region [3″,42″] ( kpc), as can be seen in Figure 5. We compare our profile with the profile derived by the assumption-free method of Liesenborgs et al. (2006), overplotted as well in Figure 5. As can be seen the profiles are similarly shallow and in good agreement with each other. This may be expected, since the profile must be adjusted to maintain the lensing-distance ratio for each lensed system, manifesting the importance of the images found in this work for constraining the mass profile of this cluster.
The shallow profile results in high magnification, as kappa is close to unity over a wide central area and thus the magnification is boosted. This phenomenon we have revealed recently in another even shallower profile cluster, MACS 1149.5+2223 (Zitrin & Broadhurst 2009) which hugely magnifies a distant spiral galaxy by a factor of creating the largest lensed images known, as the slope is even shallower in this case related to the unrelaxed nature of that cluster. Another work based on spectroscopic redshifts claims a somewhat more moderate slope of up to for MACS 1149.5+2223 (Smith et al. 2009) but still significantly lower than typically found in other rich lensing clusters. In MS 1358 the high magnification is inferred by the distribution of multiple-images and their redshifts, and can account for the large bright images of system 1, at (see Figure 3). We find that the source galaxy is magnified into arcs 1.1/1.2, and about into each of arcs 1.3 and 1.4, so that the source is magnified in total about a 100 times, and is therefore one of the most highly-magnified distant objects known.
The magnification values are hard to determine precisely since the magnification is a very sensitive function of the local mass gradient so that in practice shallower models yield much higher magnifications. For example, Franx et al. (1997), have used isothermal potentials to find a magnification of at the eastern part of the bigger arc (image 1.2 here), and Swinbank et al. (2009; see also Richard et al. 2008) have found a revised “luminosity-weighted” magnification of , while we find in that region an average magnification of . It is well understood now by most practitioners that the mass profile cannot be appropriately constrained when too few multiple-images are used, or when they span only a narrow redshift range. Here, our identification of many multiple-images spread over a wide range of redshifts allows for the first time an accurate determination of the profile slope of MS 1358, revealing the rather shallow central mass profile.
4.3 Luminosity of the Source
Due to the large difference in magnification with models published earlier (Franx et al. 1997, Swinbank et al. 2009), and due to the importance of the object at , we calculate our corrections to the original source luminosity. Firstly, we simply divide the bolometric luminosity published by Franx et al., , by the approximate magnification ratio of the two mass models, to obtain a corrected source bolometric luminosity of . Independently, we find that the source AB magnitude is I and I (after accounting for the magnification), significantly fainter than I or I, as published by Franx et al. and Swinbank et al., respectively. We then use eq. 2 of Bouwens et al. (2009a) to convert the corrected bolometric luminosity into an absolute magnitude in the rest-frame UV. This relation is known to hold from to at least , and is expected to be approximately valid also at . Following our model, the absolute magnitude of the source is , times a more common value for objects at according to up-to-date high- luminosity functions (e.g., Bouwens et al. 2007, van der Burg, Hildebrandt & Erben 2010).
4.4 Mass-To-Light Ratio
We calculate here the central Mass-To-Light ratio using the Luminous Red Galaxies (LRG) template described in Benítez et al. (2009) to convert fluxes into luminosities, and measure an ratio of within the critical curves for (see Figure 3). We compare this value to the M/L versus Einstein radius relation found in Zitrin et al. (2010a) for a sample of 12 clusters. After correcting for the difference in the lens redshift, this value tightly follows the relation they presented (see Figure 28 therein), which predicts a similar ratio.
We may also examine in detail the M/L of the luminous elliptical galaxy which splits the images of the galaxy arcs 1.1/1.2 and 1.3 (visible in Figure 3; RA=13:59:49.47 DEC= +62:30:47.55). According to our model this cluster member has a mass of within a radius of ( kpc), after subtracting the cluster smooth DM component. We compare this result with the mass inferred by the virial theorem through the velocity dispersion, and in the same aperture. For example, Kelson et al. (2000a,b, 2006) measured a velocity dispersion of km/s for this galaxy, which corresponds to within , in fair agreement with our result (we note however that a smaller galaxy may be hidden in this bright elliptical light, slightly affecting the comparison). The light enclosed within is , which yields a small ratio of , close to the purely stellar value indicating no significant DM out to kpc. The effective radius of this galaxy was found to be (4.75 kpc; Kelson et al. 2000a,b, 2006) so that in practice we measure in a radius bigger three times than the effective radius, where the DM should be dominant. However, a lower ratio is not surprising, because we subtracted the cluster DM component from our mass measurement, and the halo of this galaxy should already be stripped by the significant tidal forces in the central cluster region (if not earlier during the hierarchical evolution of the cluster through mergers of subclumps). It is known that about 70% of the DM is stripped from central galaxies also in simulations of massive clusters (e.g., Nagai & Kravtsov 2005).
5 Summary
In this work we have presented a detailed lensing analysis of the galaxy cluster MS 1358 in HST/ACS images. Our well-established modelling method (Broadhurst et al. 2005a, Zitrin et al. 2009b, Zitrin et al. 2010a,b) has revealed the rather shallow mass distribution of the central region by uncovering 19 multiply-lensed images which eluded previous detection, so that in total 23 images of 8 different sources were used to fully constrain the fit. Though more lensed candidates might be found in this field with further careful effort, our minimalistic approach to lensing involves only 6 free parameters so that the resulting model is clearly fully constrained by these multiple images. In addition we have uncovered several other lensed candidates, for which it would be interesting to obtain spectroscopic redshifts (as well as to the systems identification presented here) in order to further establish the results of this work.
The photometric redshifts of the newly found arcs throughout the central region enable the determination of the inner mass profile of MS 1358, through the cosmological lensing-distance ratio, and imply a shallow mass distribution manifested also in our modelling iterations so that models spanning almost the full parameter space yield similar shallow mass profiles with typical slopes of ( kpc). We further tested our results with a non-parametric adaptive-grid method (Liesenborgs et al. 2006, 2007, 2009), which yields a similarly shallow profile hence strengthening the conclusions of this work. A shallow mass distribution translates into a boosted magnification in the central region so that the source galaxy is magnified in total times, and is therefore one of the more highly-magnified, distant objects known.
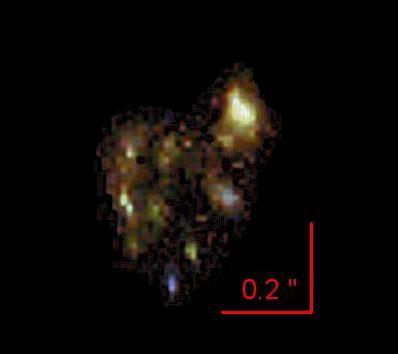
Our magnification values for this system are higher by a factor of than previous estimates (e.g., Franx et al. 1997, Swinbank et al. 2009) based on models constrained only by the system. Hence the source size, bolometric luminosity, and star-formation rate are correspondingly smaller, more typical of faint field galaxies based on current high- luminosity functions (e.g., Bouwens et al. 2007, van der Burg, Hildebrandt & Erben 2010), and with a physical scale of a dwarf galaxy of radius kpc. A detailed image of the interior morphology of the source is generated by delensing the most magnified image (1.1/1.2), resulting in a high effective resolution of only 50 pc, thanks to the high magnification and to the declining angular diameter distance above for the standard cosmology, so that this image apparently represents the best resolved object known at high redshift.
acknowledgments
This research is being supported by the Israel Science Foundation, and encouraged further by the TAU school of physics and astronomy scholarship for research excellency. AZ acknowledges Eran Ofek and Salman Rogers for their publicly available Matlab scripts. We thank Daniel Kelson for useful information. ACS was developed under NASA contract NAS 5-32865. Results are based on observations made with the NASA/ESA Hubble Space Telescope, obtained from the data archive at the Space Telescope Science Institute. STScI is operated by the Association of Universities for Research in Astronomy, Inc. under NASA contract NAS 5-26555.
References
- [] Allen, S.W., 1998, MNRAS, 296, 392
- [] Allen, S.W., 2000, MNRAS, 315, 269
- [] Arabadjis, J.S., Bautz, M.W. & Garmire, G.P., 2002, ApJ, 572, 66
- [] Benítez, N., 2000, ApJ, 536, 571
- [] Benítez, N., et al., 2004, ApJS, 150, 1
- [] Benítez, N., et al., 2009, ApJ, 691, 241
- [] Bertin, E. & Arnouts, S., 1996, A&AS, 117, 393
- [] Blakeslee, J.P., Anderson, K.R., Meurer, G.R., Benítez, N., Magee, D., 2003, in Astronomical Society of the Pacific Conference Series, Vol. 295, Astronomical Data Analysis Software and Systems XII, ed. H. E. Payne, 257
- [] Böhringer, H.; et al., 2000, ApJS, 129, 435
- [] Borgani, S., Girardi, M., Carlberg, R.G., Yee, H.K.C., Ellingson, E., 1999, ApJ, 527, 561
- [] Bouwens, R.J., et al., 2004, ApJ, 616, 79
- [] Bouwens, R.J., Illingworth, G.D., Franx, M., Ford, H., 2007, ApJ, 670, 928
- [] Bouwens, R.J., et al., 2009a, ApJ, 705, 936
- [] Bouwens, R.J., et al., 2009b, ApJ, 690, 1764
- [] Bouwens, R.J., et al., 2010, ApJ, 709L, 133
- [] Bradley, L. D., et al., 2008, ApJ, 678, 647
- [] Broadhurst, T., et al. 2005a, ApJ, 621, 53
- [] Broadhurst, T., Takada, M., Umetsu, K., Kong, X., Arimoto, N., Chiba, M., Futamase, T., 2005b, ApJ, 619, 143
- [] Broadhurst, T, Umetsu, K, Medezinski, E., Oguri,M., Rephaeli, Y., 2008, ApJ 685, L9
- [] Brown, T.M., Ferguson, H.C., Smith, E., Bowers, C.W., Kimble, R.A., Renzini, A., Rich, R.M., 2003, ApJ, 584L, 69
- [] Cagnoni, I., della Ceca, R., Maccacaro, T., 1998, ApJ, 493, 54
- [] Carlberg, R.G., Yee, H.K.C., Ellingson, E., Abraham, R., Gravel, P., Morris, S., Pritchet, C. J., 1996, ApJ, 462, 32
- [] Coe, D., Benítez, N., Sánchez, S. F., Jee, M., Bouwens, R., Ford, H., 2006, AJ, 132, 926
- [] Coe, D., Benítez, N., Broadhurst, T., Moustakas, L., Ford, H., 2010, arXiv:1005.0398
- [] Cooray, A.R., Grego, L., Holzapfel, W.L., Joy, M., Carlstrom, J.E., 1998, AJ, 115, 1388
- [] Diaferio, A., Geller, M.J. & Rines, K.J., 2005, ApJ, 628L, 97
- [] Dekel, A. & Silk, J., 1986, ApJ, 303, 39
- [] Egami, E., et al., 2006, ApJ, 647, 922
- [] Elíasdóttir, Á., et al., 2007, arXiv:0710.5636
- [] Ettori, S. & Fabian, A. C., 1999, MNRAS, 305, 834
- [] Fabricant, D., Franx, M. & van Dokkum, P., 2000, ApJ, 539, 577
- [] Fabricant, D.G., McClintock, J.E. & Bautz, M.W., 1991, ApJ, 381, 33
- [] Ferreras, I. & Silk, J., 2000, ApJ, 532, 193
- [] Fisher, D., Fabricant, D., Franx, M., van Dokkum, P., 1998, ApJ, 498, 195
- [] Ford, H.C., et al. 2003, in Presented at the Society of Photo-Optical Instrumentation Engineers (SPIE) Conference, Vol. 4854, Society of Photo-Optical Instrumentation Engineers (SPIE) Conference Series, ed. J.C. Blades & O.H.W. Siegmund, 81 94
- [] Franx, M., Illingworth, G.D., Kelson, D.D., van Dokkum, P.G. & Tran, K., 1997, ApJ, 486, 75
- [] Frye, B. & Broadhurst, T., 1998, ApJ, 499, 115
- [] Frye, B., Broadhurst, T., & Benítez, N., 2002, ApJ, 568, 558
- [] Gavazzi, R., Fort, B., Mellier, Y., Pello, R., Dantel-Fort, M., 2003, A&A, 403, 11
- [] Gioia, I.M., Maccacaro, T., Schild, R.E., Wolter, A., Stocke, J.T., Morris, S.L., Henry, J.P., 1990, ApJS, 72, 567
- [] Hattori, M., Watanabe, K., Yamashita, K., 1997, A&A, 319, 764
- [] Heckman, T.M., Armus, L., Miley, G.K., 1990, ApJS, 74, 833
- [] Henry, J.P., 2000, ApJ, 534, 565
- [] Henry, J.P., Gioia, I.M., Maccacaro, T., Morris, S.L., Stocke, J.T., Wolter, A., 1992, ApJ, 386, 408
- [] Hoekstra, H., 2007, MNRAS, 379, 317
- [] Hoekstra, H., Franx, M., Kuijken, K., Squires, G., 1998, ApJ, 504, 636
- [] Holden, B.P., et al., 2007, ApJ, 670, 190
- [] Jee M.J., et al., 2007, ApJ, 661, 728
- [] Kelson, D.D., Illingworth, G.D., van Dokkum, P.G., Franx, M., 2000a, ApJ, 531, 137
- [] Kelson, D.D., Illingworth, G.D., van Dokkum, P.G., Franx, M., 2000b, ApJ, 531, 159
- [] Kelson, D.D., Illingworth, G.D., Franx, M., van Dokkum, P.G., 2006, ApJ, 653, 159
- [] Kelson, D.D., van Dokkum, P.G., Franx, M., Illingworth, G.D., Fabricant, D., 1997, ApJ, 478L, 13
- [] Kneib, J.-P., Ellis, R.S., Santos, M.R., Richard, J., 2004, ApJ, 607, 697
- [] Kochanek, C.S., et al., 2000, ApJ, 543, 131
- [] LaRoque, S.J., Bonamente, M., Carlstrom, J.E., Joy, M.K., Nagai, D., Reese, E.D., Dawson, K.S., 2006, ApJ, 652, 917
- [] Le Fèvre, O., Hammer, F., Angonin, M.C., Gioia, I.M., Luppino, G.A., 1994, ApJ, 422L, 5
- [] Lemze, D., Rephaeli, Y., Barkana, R., Broadhurst, T., Wagner, R., Norman, M.L., 2010, arXiv:1008.2758
- [] Liesenborgs, J., De Rijcke, S., Dejonghe, H., 2006, MNRAS, 367, 1209
- [] Liesenborgs, J., De Rijcke, S., Dejonghe, H., Bekaert, P., 2007, MNRAS, 380, 1729
- [] Liesenborgs, J., De Rijcke, S., Dejonghe, H., Bekaert, P., 2009, MNRAS, 397, 341
- [] Limousin, M., et al., 2008, A&A, 489, 23
- [] Luppino, G.A., Cooke, B.A., McHardy, I.M., Ricker, G.R., 1991, AJ, 102, 1
- [] Luppino, G.A., Gioia, I.M., Hammer, F., Le Fèvre, O., Annis, J.A., 1999, A&AS, 136, 117
- [] McCarthy, I.G., Holder, G.P., Babul, A., Balogh, M.L., 2003, ApJ, 591, 526
- [] Medezinski, E., Broadhurst, T., Umetsu, K., Oguri, M., Rephaeli, Y., Benítez, N., 2010, MNRAS, 405, 257
- [] Meneghetti, M., Rasia, E., Merten, J., Bellagamba, F., Ettori, S., Mazzotta, P., Dolag, K., 2010, arXiv:0912.1343
- [] Molikawa, K., Hattori, M., Kneib, J.-P., Yamashita, K., 1999, A&A, 351, 413
- [] Morandi, A., Ettori, S. & Moscardini, L., 2007, MNRAS, 379, 518
- [] Mushotzky, R.F. & Scharf, C.A., 1997, ApJ, 482L, 13
- [] Nagai, D. & Kravtsov, A.V., 2005, ApJ, 618, 557
- [] Newman, A.B., et al., 2009, ApJ, 706, 1078
- [] Nichol, R.C., Holden, B.P., Romer, A.K., Ulmer, M.P., Burke, D.J., Collins, C.A., 1997, ApJ, 481, 644
- [] Oguri, M., Lee, J. & Suto, Y., 2003, ApJ, 599, 7
- [] Okabe, N., Takada, M., Umetsu, K., Futamase, T., Smith, G.P., 2009, arXiv:0903.1103
- [] Poggianti, B.M. & Barbaro, G., 1996, A&A, 314, 379
- [] Postman, M., et al., 2005, ApJ, 623, 721
- [] Richard, J., Pei, L., Limousin, M., Jullo, E., Kneib, J.P., 2009, A&A, 498, 37
- [] Sand, D.J., Treu, T., Ellis, R.S., Smith, G.P., 2005, ApJ, 627, 32
- [] Scannapieco, E. & Broadhurst, T., 2001, ApJ, 549, 28
- [] Stark, D.P., Ellis, R.S., Richard, J., Kneib, J.-P., Smith, G.P., Santos, M.R., 2007, ApJ, 663, 10
- [] Stocke, J.T., Morris, S.L., Gioia, I.M., Maccacaro, T., Schild, R., Wolter, A., Fleming, T.A., Henry, J.P., 1991, ApJS, 76, 813
- [] Swinbank, A.M., et al., 2009, MNRAS, 400, 1121
- [] Takahashi, R. & Chiba, T., 2007 ,ApJ, 671, 45
- [] Tran, K.-V.H., Simard, L., Illingworth, G., Franx, M., 2003, ApJ, 590, 238
- [] Umetsu, K., Medezinski, E., Broadhurst, T., Zitrin, A., Okabe, N., Hsieh, B.C., Molnar, S.M., 2010, ApJ, 714, 1470
- [] van der Burg, R.F.J., Hildebrandt, H., Erben, T., 2010, arXiv:1009.0758
- [] van Dokkum, P.G., Franx, M., Kelson, D.D., Illingworth, G.D., Fisher, D., Fabricant, D., 1998, ApJ, 500, 714
- [] Wambsganss, J., Bode, P., Ostriker, J.P., 2004, ApJ, 606L, 93
- [] Williams, L.L.R., Navarro, J.F., Bartelmann, M., 1999, ApJ, 527, 535
- [] Wu, X.-P., 2000, MNRAS, 316, 299
- [] Yee, H.K.C., Ellingson, E., Morris, S.L., Abraham, R.G., Carlberg, R.G., 1998, ApJS, 116, 211
- [] Zheng, W., et al., 2009, ApJ, 697, 1907
- [] Zitrin, A. & Broadhurst, T., 2009, ApJ, 703L, 132
- [] Zitrin, A., Broadhurst, T., Rephaeli, Y., Sadeh, S., 2009a, ApJ, 707L, 102
- [] Zitrin, A., et al., 2009b, MNRAS, 396, 1985
- [] Zitrin, A., Broadhurst, T., Barkana, R., Rephaeli, Y., Benítez, N., 2010a, arXiv:1002.0521, MNRAS in press
- [] Zitrin, A., et al., 2010b, arXiv:1004.4660, MNRAS in press
- [] Zwicky, F. & Herzog, E., 1968, Catalogue of Galaxies and Clusters of Galaxies (Pasadena: Caltech)