On the radial extent of the dwarf irregular galaxy IC1011affiliation: This research used the facilities of the Canadian Astronomy Data Centre operated by the National Research Council of Canada with the support of the Canadian Space Agency. This research is based in part on data collected at Subaru Telescope, which is operated by the National Astronomical Observatory of Japan.
Abstract
We present new deep and accurate space (Advanced Camera for Surveys – Wide Field Planetary Camera 2 at the Hubble Space Telescope) and ground-based (Suprime-Cam at Subaru Telescope, Mega-Cam at Canada-France-Hawaii Telescope) photometric and astrometric data for the Local Group dwarf irregular IC10. We confirm the significant decrease of the young stellar population when moving from the center toward the outermost regions. We find that the tidal radius of IC10 is significantly larger than previous estimates of 10′. By using the ,V–I Color Magnitude Diagram based on the Suprime-Cam data we detect sizable samples of red giant (RG) stars up to radial distances of 18-23′ from the galactic center. The ratio between observed star counts (Mega-Cam data) across the tip of the RG branch and star counts predicted by Galactic models indicate a star count excess at least at a 3 level up to 34-42′ from the center. This finding supports the hypothesis that the huge HI cloud covering more than one degree across the galaxy is associated with IC10 (Huchtmeier, 1979; Cohen, 1979). We also provide new estimates of the total luminosity (9 , -15.1 mag) that agrees with similar estimates available in the literature. If we restrict to the regions where rotational velocity measurements are available (r13′), we find a mass-to-light ratio (10 /) that is at least one order of magnitude larger than previous estimates. The new estimate should be cautiously treated, since it is based on a minimal fraction of the body of the galaxy.
Subject headings:
galaxies: dwarf — galaxies: individual (IC10) — galaxies: stellar content — Local Group — stars: evolution1. Introduction
Photometric investigations of the stellar populations in Local Group (LG) dwarf galaxies provide firm constraints on cosmological parameters and the unique opportunity to investigate galaxy formation models (Mateo, 1998; Tolstoy et al., 2009; Wyse, 2010). In this context dwarf irregulars (dIs) play a key role, since we still lack firm empirical and theoretical constraints concerning their evolution and the possible transition into dwarf spheroidal galaxies (Bekki, 2008; Woo et al., 2008; Kormendy et al., 2009). Although the number of dwarf galaxies known in the LG is rapidly growing in the last few years, current statistics indicate that the dIs are at least one quarter of LG galaxies (McConnachie et al., 2008; Sanna et al., 2009).
Among the dIs of the LG, IC10 is an interesting system, since it underwent strong star formation activity during the last half billion years and it is considered the only LG analog of starburst galaxies. Even though IC10 has been the subject of several investigations ranging from the radio (Wilcots & Miller, 1998) to the near-infrared (NIR, Vacca et al., 2007), to the UV (Hunter, 2001; Richer et al., 2001), and to the X-ray (Wang et al., 2005), its structural parameters and in particular its radial extent are poorly defined. Massey & Armandroff (1995) found that the major axis of IC10 is . A similar diameter () was found by Jarrett et al. (2003) using the isophotal radii from 2MASS NIR images. More recently Tikhonov & Galazutdinova (2009), using both ground-based and space images, suggested that the extent of the thick disk along the minor axis is 10.5′. It has also been suggested by Demers et al. (2004), using asymptotic giant branch and red giant branch (RGB) stars, that IC10 should have a halo of diameter. On the other hand, radio measurements by Huchtmeier (1979, hereinafter H79) indicated that IC10 has a huge envelope of neutral hydrogen extending over more than 1 square degree () across the sky.
We are also facing a significant uncertainty in the total mass of IC10. By using HI regions H79 found x, assuming a distance of 1 Mpc and a Holmberg diameter of . Also, Shostak & Skillman (1989, hereinafter SS89), using high resolution maps of HI regions, measured an inclination of 45∘ and a maximum in the rotation curve of 30 km s-1 (42 km s-1 deprojected) and the same Holmberg diameter (deprojected angular diameter ), from which they found x. More recently, van den Bergh (2000), following H79, but assuming a smaller distance (660 kpc, Sakai et al., 1999), found x.
2. Photometric data
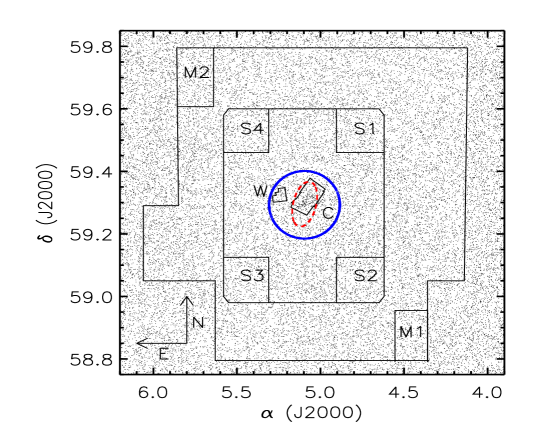
The Hubble Space Telescope (HST) data were collected with the Advanced Camera for Surveys (ACS, pointings ,) and with the Wide Field Planetary Camera 2 (WFPC2, pointings ,). Data from pointings , and were already presented (Sanna et al., 2008, 2009). Pointing includes 24 -band and 24 -band images of 500 s each. This pointing is located NE of the galaxy center; it is outside the disk identified by Jarrett et al. (2003, see the red ellipse in Fig. 1) and inside the thick disk identified by Tikhonov & Galazutdinova (2009). The ground-based data were collected with the prime focus camera (Suprime-Cam, pointing ) on the Subaru telescope and with Mega-Cam on the CFHT (pointing ). Pointing (see Fig. 1) is located across the galaxy center and includes both shallow (3, 3, 3; 360 s per band) and deep (12, 12480 s; 13, 13360 s; 23, 23240 s) images. The pointing (see Fig. 1) is also located across the galaxy center and includes 3g (3700 s) and 3i-band (3400 s) images.
Photometry on individual images was performed with DAOPHOT IV/ALLSTAR (Stetson, 1987). The 786 ground-based images were simultaneously reduced with ALLFRAME (Stetson, 1994); the same applies to the 392 space images. We ended up with a catalog including stars with at least one measurement in two different bands. The ground-based data were transformed into the Johnson-Kron-Cousins system using the standard stars provided by Landolt (1983, 1992) to calibrate local standards. The typical accuracy is 0.04 for and 0.05 mag for the band. Some external chips of the Mega-Cam include a limited number of local standards and they were not included in the final calibrated catalog. To provide a homogeneous photometric catalog the ACS and the WFPC2 were transformed into the Johnson-Kron-Cousins system using prescriptions by Sirianni et al. (2005). The typical accuracy is of a few hundredths of magnitude in both and . The conclusions of this investigation are not affected by the precision of the absolute zero-points.
3. Results and Discussion
The ground-based data cover a sky area of while the high angular resolution of HST images allowed us to perform accurate photometry in the innermost crowded regions. We selected eight different regions, the region “C” is located across the galaxy center and includes data of pointings (ACS@HST) and (WFPC2@HST), while the region “W” is located from the center and includes the data of the pointing (WFPC2@HST). Regions “S1”, “S2”, “S3”, and “S4” cover the corners of the Suprime-Cam data (pointing ) and are located at from the galaxy center, while regions “M1” and “M2” are two regions of the Mega-Cam data (pointing ) located at from the galaxy center in the SW and NE directions, respectively. Fig. 2 shows the ,V–I Color-Magnitude Diagrams (CMDs) of the selected regions. Data plotted in this figure show several interesting features.
i) The photometry based on HST data is deep and very accurate, and indeed the CMDs (regions “C” and “W”) reach limiting magnitudes of and mag. The same outcome applies to the Subaru data, and indeed the CMDs reach limiting magnitudes of and mag. The CMDs based on CFHT data are shallower with limiting magnitudes and mag.
ii) Young MS stars (, mag) show a strong radial gradient. Their number decreases rapidly when moving from the center to the outermost galaxy regions. A handful of them are visible in region “W”, while the blue objects of region “S” might be field galaxies.
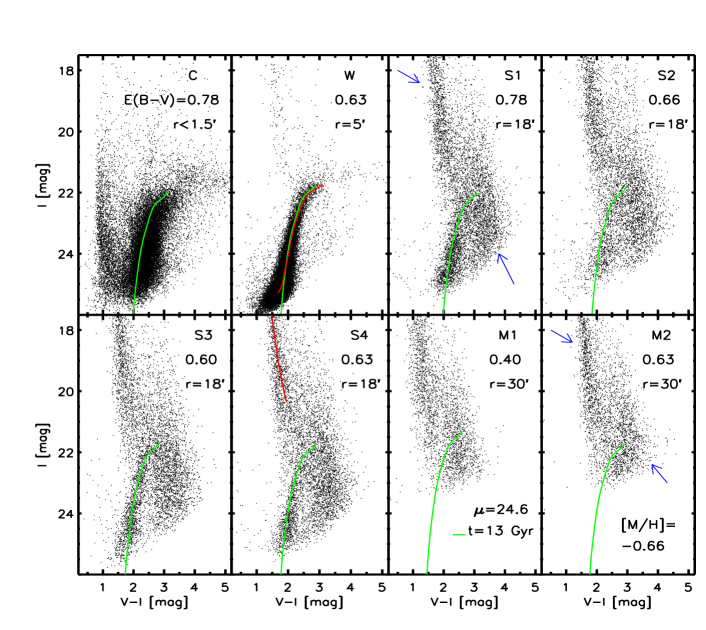
iii) The different apparent colors of RGB stars when moving from the center to the outermost regions further support the occurrence of differential reddening. We estimated the reddening of region “W” using the same approach adopted in Sanna et al. (2008). The ridgeline of the RGB in this field was adopted to estimate the reddening in the regions covered by Subaru data. The ridgeline of the contaminating blue field stars located in region “S4” was used to estimate the reddening in the regions covered by CFHT data. We found that the reddening is higher along the semi-major axis ( mag) and attains an almost constant value ( mag) in the regions covered by the Subaru data external to the HST data. In the regions covered by the CFHT data external to the Subaru data the reddening attains either similar ( mag) or smaller ( mag) values in the SW direction (Sanna et al. 2010, in preparation). The presence of a significant reddening variation up to 20′ from the center supports previous investigations based on the radial distribution of HI regions (SS89; Wilcots & Miller 1998).
iv) Old RGB stars are ubiquitous and they can be easily identified in HST and Subaru CMDs. To properly identify RGB stars we also plotted an -enhanced isochrone (green line) of 13 Gyr at fixed metal content (total metallicity, [M/H]=-0.66 dex; helium content, Y=0.251) from the BaSTI data base (Pietrinferni et al., 2006)111See also http://www.oa-teramo.inaf.it/BASTI. We also adopted the same true distance modulus (=24.600.15 mag, Sanna et al. 2008) and individual reddening estimates. The comparison between theory and observations further supports the evidence that stars located in the range and mag are bona fide old and intermediate-age RGB stars. The CMDs based on these data show also strong contamination by field stars (see the region “S1”).
v) The CMDs based on CFHT data show the same field contamination as the Subaru data, and probably a small overdensity of stars in the region across the tip of the RGB (TRGB, , mag).
The above results indicate that the radial extent of IC10 has been significantly underestimated, and indeed according to the Subaru data the diameter is at least of the order of 36-46′ and probably larger than one degree according to the CFHT data.
To further constrain the radial extent of IC10, we decided to compare the observed star counts with star counts of foreground field stars predicted by Milky Way (MW) models. This approach presents several advantages when compared with the method based on the statistical subtraction of an external control field. i) It is not affected by reddening differences between the galactic and the control field. ii) It is not affected by completeness problems of the control field, thus saving telescope time. iii) The real radial extent of these stellar systems it is not known in advance. Therefore, the control fields might still be located inside their halo. The main drawback is that MW models need to be validated using deep and accurate star counts covering broad sky regions (Reyle et al., 2009, and references therein).
However, the ground-based and space data sets are characterized by different limiting magnitudes. To provide a robust estimate of the completeness of the former data sets, we compared their luminosity function (LF) with the LF of the WFPC2 data for pointing “W”. We adopted this approach since we are interested in estimating the completeness down to 1.5 magnitudes fainter than the TRGB, i.e., mag. In this magnitude range the WFPC2 data are minimally affected by completeness problems. We have found that the completeness is % for the Subaru at the limiting magnitude of mag, while it is % for the CFHT at the limiting magnitude of mag. We have chosen the above limiting magnitudes to apply conservative completeness corrections to both the Suprime-Cam and the Mega-Cam data.
In order to compare theory and observations, we used the Pisa (Castellani et al., 2002; Cignoni et al., 2006) and the Padova (Girardi et al., 2005) MW model. We focused our attention on two outer regions covering the same sky area, with the same mean reddening ( mag) and located in the NE direction, namely the “S4” (N(stars)4000) and “M2” (N(stars) 3000) regions. The top panels of Fig. 3 show the ,V–I CMD for the Pisa (left) and the Padova (right) MW models for a sky area of at the position of IC10 (; ) and assuming a reddening of mag.

The bottom panels of Fig. 3 show the ratio between the number of observed stars and the number of candidate field stars predicted by the quoted MW models. Star counts were smoothed using a Gaussian kernel at fixed . We also estimated the number of unresolved background galaxies, with reddened -band magnitudes and V–I colors typical of the tip of RGB stars, using empirical galaxy counts (Fukugita et al., 1995; Benitez, 2000; Capak et al., 2004; Ferguson et al., 2004) and it was subtracted to the number of observed stars. To avoid spurious fluctuations caused by the limited sky area covered by observations, theory and observations were normalized in the bright end (17.9I18.4 mag). The bottom left panels display the comparison with the Pisa MW model. There is evidence of IC10 stars across the TRGB region ( mag) in both the “S4” (left, 1.590.13) and the “M2” (right, 1.38 0.12) field. The star count excess is at 3 level. The above evidence further supports the occurrence of IC10 stars in the region covered by the Mega-Cam data, since in the “S4” region we clearly identified IC10 RG stars. The bottom right panels of Fig. 3 display the comparison between observations and the Padova MW model. There is once again a clear evidence of a star excess across the TRGB region in both the “S4” (left, 1.740.14) and the “M2” (right, 1.530.14) field ( 4 level). The two Galactic models were constructed assuming similar input parameters222Galactic model input parameters: Kroupa initial mass function not corrected for binaries; double exponential thin disk ((height)=250 pc, (scale length)=3000 pc, constant star formation rate [SFR] for t 7 Gyr, Z(mean metallicity)=0.02); exponential thick disk (=1000 pc, =3500 pc, constant SFR for 5t12 Gyr, Z=0.006); oblate halo with (=2800 pc, (semiaxis ratio)=0.8, constant SFR for 11t13 Gyr, Z=0.0002).. The difference in the star count ratios between the two models is due to the different evolutionary inputs and to the normalization of the star counts in the Solar neighbourhood.
The above findings indicate that the radial distribution of IC10 old and intermediate-age stellar populations agrees quite well with the size of the huge hydrogen cloud detected by Huchtmeier (1979) and by Cohen (1979), and cover more than one square degree across the galaxy (′). This means that the stellar halo and the hydrogen cloud have, within the errors, similar radial extents and resolve this peculiar feature of IC10 (Tikhonov & Galazutdinova, 2009). Moreover, this evidence further supports the hypothesis that the hydrogen cloud is associated with the galaxy (stellar mass loss, pristine gas; Huchtmeier, 1979; Cohen, 1979; Wilcots & Miller, 1998).
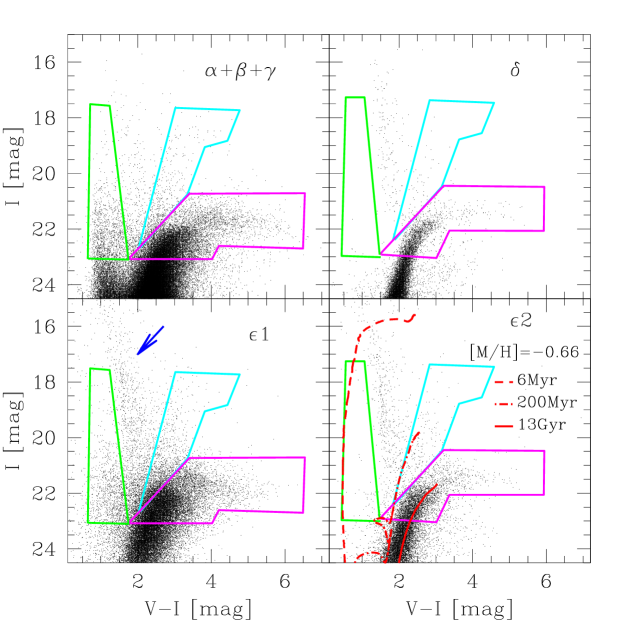
To estimate the total luminosity we need to select candidate IC10 stars. To describe the procedure, Fig. 4 shows the CMDs of the stars located inside a circle of 13′ diameter across the galaxy center. The top panels display the photometry of space data (pointings , , , ), while the bottom ones show ground data (pointing , Suprime-Cam). The difference between 1 and 2 is in the mean reddening (see Fig. 4). For the stars located in the overlapping regions we use the HST photometry. The candidate IC10 stars were selected using different boxes in the aforementioned CMDs. The green box includes young MS stars ( mag), the cyan box the intermediate-age stars (, mag), while the pink box includes old and intermediate-age RG stars (, mag). The position of the boxes in the four CMDs was shifted according to the local reddening (see Fig. 1). The limiting magnitude of the boxes is according to the completeness experiment.
The dashed and the dashed-dotted lines plotted in the bottom right panel of Fig. 4, show two young scaled Solar abundance isochrones (Pietrinferni et al., 2004) at fixed metallicity ([M/H]=-0.66 dex) and ages of and 200 Myr, while the solid red line shows the old -enhanced isochrone with the same total metallicity and an age of Gyr. These isochrones validate the position of the boxes we adopted to pinpoint the different subpopulations of IC10. The same approach was adopted to select candidate IC10 stars located between the blue circle of Fig. 1 and the outermost regions of the pointing (′). On the basis of these data and of the recent IC10 distance based on the TRGB (830 kpc, Sanna et al., 2008) we estimated a total -band luminosity of and a total magnitude of =-15.11 mag. This estimate agrees within a factor of two with similar estimates available in the literature ( , Mateo 1998; =-16.0 mag, Richer et al. 2001). The current estimate is a lower limit, since we are not including the stars located in the outermost regions covered by our photometry (pointing ). However, the estimates available in the literature only cover the innermost galactic regions. The difference is mainly due to the fact that the current photometry allows us a robust identification of field stars (, mag, see the blue arrow in the bottom left panel of Fig. 4). If they are even partially included, these objects introduce a systematic bias in the estimate of the total luminosity. The different assumptions concerning the adopted distance and reddening variation also help to explain the above difference.
To estimate the mass-to-light (M/L) ratio of IC10 we restricted ourself to the galactic regions where rotational velocity measurements are available (see the blue circle with a diameter of 13′ in Fig. 1). The luminosity inside this area is ( mag). By using the quoted true distance and diameter together with the rotation velocity based on HI regions (SS89) we found, following Huchtmeier & Richter (2001) and Casertano & Shostak (1980), a total mass of x that agrees quite well with similar estimates available in the literature (Huchtmeier, 1979; van den Bergh, 2000; Woo et al., 2008). Eventually, we found M/L 10 . Although this estimate is hampered by several empirical limitations it is at least one order of magnitude larger than the value recently provided by Woo et al. (2008). The quoted authors use two independent methods to estimate the M/L ratios of LG dwarf galaxies: colors and inferred star formation history. They found that the median M/L ratio of dIs based on the latter approach is slightly smaller than on the former one (0.7 vs 0.8, see their Table˜2). However, the difference needs to be investigated in more detail, particularly in view of the severe limitations affecting the estimates of the rotational velocity and of the total luminosity over the entire body of the galaxy.
We are facing empirical evidence that dIs seem to show smaller M/L ratios when compared with dwarf ellipticals (see Fig. 1 and Table 2 in Woo et al. 2008). The new data will allow us to constrain whether this evidence might be affected by observational biases. Moreover, they can shed new lights on the prediction that dwarf galaxies might have tidal radii significantly larger than empirical estimates (Hayashi et al., 2003; Kazantzidis et al., 2004).
References
- Bekki (2008) Bekki, K. 2008, MNRAS, 388,10
- Benitez (2000) Benitez, N. 2000, ApJ, 536, 571
- Capak et al. (2004) Capak, P. et al. 2004, AJ, 127, 180
- Casertano & Shostak (1980) Casertano, S. P. R., & Shostak, G. S. 1980, A&A, 81, 371
- Castellani et al. (2002) Castellani, V., Cignoni, M., Degl’Innocenti, S., Petroni, S., Prada Moroni, P. G. 2002, MNRAS, 334, 69
- Cignoni et al. (2006) Cignoni, M., Degl’Innocenti, S., Prada Moroni, P. G., Shore, S. N. 2006, A&A, 459, 783
- Cohen (1979) Cohen, R. J. 1979, MNRAS, 187, 839
- Demers et al. (2004) Demers, S., Battinelli, P., Letarte, B. 2004, A&A, 424, 125
- Ferguson et al. (2004) Ferguson, H. C. et al. 2004, ApJ, 600L, 107
- Fukugita et al. (1995) Fukugita, M., Shimasaku, K., Ichikawa, T. 1995, PASP, 107, 945
- Girardi et al. (2005) Girardi, L., Groenewegen, M. A. T., Hatziminaoglou, E., da Costa, L 2005, A&A, 436, 895
- Hayashi et al. (2003) Hayashi, E., Navarro, J. F., Taylor, J. E., Stadel, J., Quinn, T. 2003, ApJ, 584, 541
- Huchtmeier (1979) Huchtmeier, W. K. 1979, A&A , 75, 170 (H79)
- Huchtmeier & Richter (2001) Huchtmeier, W. K., Richter, O. -G. 1988, A&A , 203, 237
- Hunter (2001) Hunter, D. A. 2001, ApJ, 559, 225
- Jarrett et al. (2003) Jarrett, T. H. Chester, T., Cutri, R., Schneider, S. E., Huchra, J. P. 2003, AJ, 125, 525
- Kazantzidis et al. (2004) Kazantzidis, S., Mayer, L., Mastopietro, C., Diemand, J., Stadel, J., Moore, B. 2004, ApJ, 608, 663
- Kormendy et al. (2009) Kormendy, J., Fisher, D. B., Cornell, M. E., & Bender, R. 2009, ApJS, 182, 216
- Landolt (1983) Landolt, A.U., 1983, AJ, 88, 853
- Landolt (1992) Landolt, A. U. 1992, AJ, 104, 340
- Massey & Armandroff (1995) Massey, P. & Armandroff, T. E. 1995, AJ, 109, 2470
- Mateo (1998) Mateo, M. 1998, ARA&A, 36, 435
- McConnachie et al. (2008) McConnachie, A. W., Huxor, A., Martin, N. F. et al. 2008, ApJ, 688, 1009
- Pietrinferni et al. (2006) Pietrinferni, A., Cassisi, S., Salaris, M., Castelli, F. 2006, ApJ, 642, 797
- Pietrinferni et al. (2004) Pietrinferni, A., Cassisi, S., Salaris, M., Castelli, F. 2004, ApJ, 612, 168
- Reyle et al. (2009) Reyle, C., Marshall, D. J., Robin, A. C., Schultheisé, M. 2009, A&A, 495, 819
- Richer et al. (2001) Richer, M. G. et al. 2001, A&A, 370, 34
- Sakai et al. (1999) Sakai, S., Madore, B. F., Freedman, W. L. 1999, ApJ, 511, 671
- Sanna et al. (2008) Sanna, N. et al. 2008, ApJ, 688, L69
- Sanna et al. (2009) Sanna, N. et al. 2009, ApJ, 699, L84
- Shostak & Skillman (1989) Shostak, G. S., Skillman, E. D. 1989, 1989, A&A, 214, 33 (SS89)
- Sirianni et al. (2005) Sirianni, M. et al. 2005, PASP, 117, 1049
- Stetson (1994) Stetson, P. B. 1994, PASP, 106, 250
- Stetson (1987) Stetson, P.B, 1987, PASP, 99, 191
- Tikhonov & Galazutdinova (2009) Tikhonov, N. A., Galazutdinova, O. A. 2009, AstL, 35, 748
- Tolstoy et al. (2009) Tolstoy, E., Hill, V., & Tosi, M. 2009, ARA&A, 47, 371
- Vacca et al. (2007) Vacca, W. D.; Sheehy, C. D., Graham, J. R. 2007, ApJ, 662, 272
- van den Bergh (2000) van den Bergh, S. 2000, The Galaxies of the Local Group, ed. Cambridge Astrophysical Series
- Wang et al. (2005) Wang, Q. D., Whitalker, K. E., Williams, R. 2005, MNRAS, 362, 1065
- Wilcots & Miller (1998) Wilcots, E. M., Miller, B. W. 1998, AJ, 116, 2363
- Woo et al. (2008) Woo, J., Courteau, S., Dekel, A. 2008, MNRAS, 390, 1453
- Wyse (2010) Wyse, R. F. G. 2010, AN, 331, 526