Hot-Dust-Poor Type 1 Active Galactic Nuclei in the COSMOS Survey
Abstract
We report a sizable class of type 1 active galactic nuclei (AGNs) with unusually weak near-infrared (1–3m) emission in the XMM-COSMOS type 1 AGN sample. The fraction of these “hot-dust-poor” AGNs increases with redshift from 6% at low redshift () to 20% at moderate high redshift (). There is no clear trend of the fraction with other parameters: bolometric luminosity, Eddington ratio, black hole mass and X-ray luminosity. The m emission relative to the m emission is a factor of 2–4 smaller than the typical Elvis et al. AGN spectral energy distribution (SED), which indicates a ‘torus’ covering factor of 2%–29%, a factor of 3–40 smaller than required by unified models. The weak hot dust emission seems to expose an extension of the accretion disk continuum in some of the source SEDs. We estimate the outer edge of their accretion disks to lie at (0.3–2.0) Schwarzschild radii, 10–23 times the gravitational stability radii. Formation scenarios for these sources are discussed.
Subject headings:
galaxies: evolution – quasars: general1. Introduction
Characteristically, active galactic nuclei (AGNs) have hotter dust than starburst galaxies, which has long been employed to select AGNs in near-infrared (NIR) surveys (e.g., Miley et al. 1985, Lacy et al. 2004, 2007, Stern et al. 2005, Donley et al. 2008). In AGNs, dust reaches maximum temperature (1000–1900 K) at the smallest equilibrium radius (Barvainis 1987, Suganuma et al. 2006). The hot dust is assigned to the inner edge of the ‘torus’ by the unified model of AGNs (Krolik & Begelman 1988, Antonucci 1993, Urry & Padovani 1995). The obscuring torus might be a smooth continuation of the broad-line region (BLR; Elitzur & Ho 2009), with the BLR extending outward to the inner boundary of the dusty torus (Suganuma et al. 2006).
However, exceptions have been observed and predicted. Observationally, Jiang et al. (2010) found two quasars, without any detectable emission from hot dust, suggesting that these hot-dust-free AGNs are the first generation quasars that do not have enough time to form a dusty torus. Rowan-Robinson et al. (2009) found AGNs with torus to bolometric luminosity ratio of only a few percent.
Emmering et al. (1992) proposed a BLR/torus structure in the disk–wind scenario. The two structures correspond to different regions of a clumpy wind coming off the accretion disk rotating around the black hole (BH). The disk–wind scenario predicts that the torus disappears at luminosities lower than erg s-1 because the accretion onto the central BH can no longer sustain the required cloud outflow rate (Elitzur & Shlosman, 2006). In a sample of nearby AGNs, even the BLR disappears at luminosities lower than erg s-1 (Elitzur & Ho, 2009).
The AGN structure is reflected in the shape of the spectral energy distribution (SED). The maximum dust temperature leads to a characteristic drop in the NIR emission at 1m (Elvis et al. 1994, E94 hereafter; Glikman et al. 2006). AGNs with weak or no ‘torus’ have an SED with weak or no IR bump, or no 1m inflection.
We have found a substantial (10%) population of such “hot-dust-poor” (HDP) AGNs by studying the SEDs of 408 XMM-COSMOS (Hasinger et al. 2007; Cappelluti et al. 2009) X-ray-selected type 1 (FWHM 2000 km s-1; Elvis et al. 2010) AGNs. All these X-ray sources have secure optical and infrared identifications (Brusa et al. 2010) and at least one optical spectrum, from either the Magellan (Trump et al. 2009a), Sloan Digital Sky Survey (SDSS; Schneider et al. 2007), or Very Large Telescope (VLT; Lilly et al. 2007, 2009) surveys.
2. Selection of HDP Objects
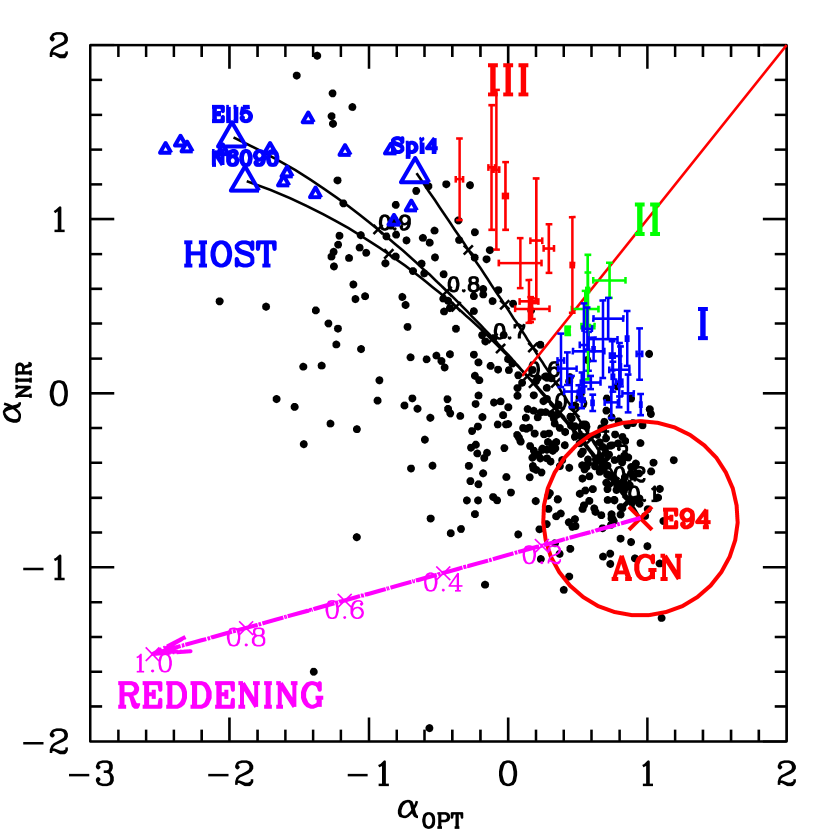
The HDP AGNs are selected based on the NIR and optical SED shapes. We plot NIR versus optical slopes on either side of m (rest frame, Figure 1; for details see Hao et al. 2010). The 1m point is not chosen arbitrarily. It is where the blackbody emission of the hot dust at the maximum sublimation temperature (e.g., 1500 K; Barvainis 1987) normally begins to outshine the emission of the accretion disk.
The plot is equivalent to a color–color plot, but utilizes more than four photometric bands. Briefly, we fit power laws () on either side of the 1m inflection point of the rest-frame SED: m–3000Å to derive an optical slope () and m - 1m to derive a NIR slope (). In normal type 1 AGNs, these slopes are and (E94; Richards et al. 2006). In order to obtain slopes that reflect the shape of the SED correctly, we required the number of photometric points of the linear fit to be larger than 2. Four hundred four out of the 408 X-ray-selected type 1 AGNs111Three out of the other four (XID=2119, 5320, 5617) are low-redshift AGNs with only band and one IRAC band in the rest-frame NIR SED. The remaining source (XID=54439) is the highest redshift AGN with only two IRAC bands in the rest-frame NIR SED. satisfy these criteria. The errors of the slopes are the standard errors of the linear fit.
The plot can be conveniently used to separate the nuclear from the host galaxy emission. Figure 1 shows the and for the E94 radio-quiet AGN template (red cross) and three galaxy templates (a spiral — Spi4, a 5 Gyr old elliptical — Ell5, and a starburst — NGC 6090; big blue triangles) from the “SWIRE Template Library” (Polletta et al. 2007). The black curves show the slopes of the SED templates obtained by mixing the AGN and galaxy with different fraction (0%–100%) after normalizing the E94 and galaxy templates at m. The mixing curves of NGC 6090 and Spi4 define the boundaries of the possible slopes obtained by mixing the E94 with all the 16 available galaxy templates in the SWIRE library (small blue triangles). The magenta line shows the OPT and NIR slopes of E94 template when reddening ( mag) is applied222We applied the IDL dereddening routine ‘‘FM_UNRED.PRO’’, with the SMC extinction curve (Gordon et al. 2003).. Reddening primarily affects .
The majority of the XMM-COSMOS AGNs ( 90%) are explained by combinations of an AGN, a galaxy, and reddening (Hao et al. 2010), as they lie within the triangular region at the left of the plot, bounded by the reddening and mixing curves. However, 10% (41 sources) lie in the upper right corner of Figure 1, more than beyond the AGN–host–reddening triangle. These sources have an optical slope consistent with typical AGNs, but a relatively weak IR bump. We name them “hot-dust-poor” (HDP) quasars.
3. HDP SEDs
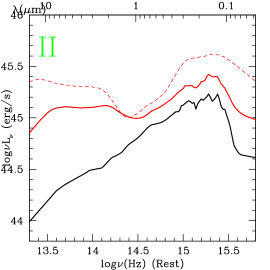
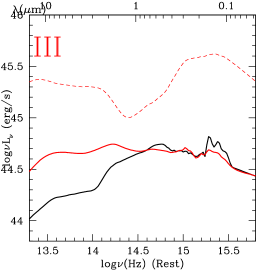
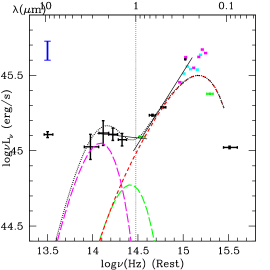
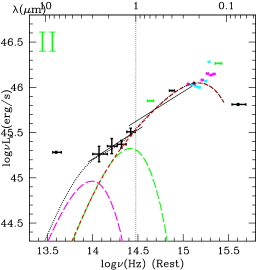
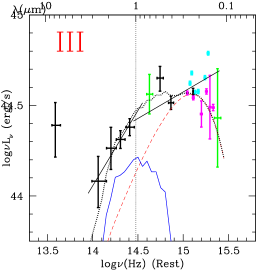
There is a range of SED shapes for the 41 HDP AGNs. We further divide these AGNs into three classes, according to their relative positions to the equal slope (red) line in the plot. Figure 2 shows examples of SEDs for each class. All wavelengths in this section refer to the rest frame.
Class I. Twenty-four sources lie below the equal slope line (blue symbols in Figure 1). These sources have a normal big blue bump (BBB), but a factor of 2–4 lower than the E94 mean SED at 3m. They all have a rather flat infrared SED shape () extending to at least m (rest frame; Figure 2, left). Severn have high luminosities (, ranging from 5.3 to 24, where is the break point of the galaxy luminosity function; Cirasuolo et al. 2007) at 1m and hence should have weak host galaxy contribution, while the rest have luminosities –.
Class II. Six sources are consistent with lying on the equal slope line (green symbols in Figure 1). The infrared emission could be the exposed continuation of the BBB to longer wavelengths (2–3m). Two out of six, have high luminosities (, –) at 1m, while the rest have luminosities –.
Class III. Eleven sources lie above the equal slope line (red symbols in Figure 1). These sources have flatter BBB than normal, possibly due to reddening. Some of them show quite strong m continuum emission (Figure 2, right). The class III sources have luminosities of –.
We calculated the mean SEDs of the HDP AGNs in each class and compared them with the mean SEDs of the other type 1 AGNs in the XMM-COSMOS sample having the same range of optical slopes for that class, i.e., normal type 1 AGNs with same BBB shape (Figure 2, upper). The HDP AGNs show relatively weaker 1–3m emission, by a factor of 1.6 for class I, 3 for class II, and 2.5 for class III.

4. Source Properties
4.1. Correlations
We compared a number of observed properties of the HDP AGNs with the whole XMM-COSMOS sample: redshift (), bolometric luminosity (, 24 m–912 Å), BH mass (; Trump et al. 2009b; Merloni et al. 2010), Eddington ratio (; Lusso et al. 2010), the optical to X-ray spectral index ()333 log, where , and larger means X-ray louder (Tananbaum et al. 1979)., the X-ray luminosity at rest frame 2keV (), the X-ray hardness ratio (HR)444HR= where are the XMM counts in the 2–10 keV band and those in the 0.5–2 keV band (Brusa et al. 2007, 2010)., and radio loudness ()555log as radio loud (Appleton et al. 2004).. All the values of these parameters were reported in Lusso et al. (2010), Brusa et al. (2010), and Hao et al. (2010). In the HDP sample, only one source 666XID=167, class III. is radio-loud (Elvis et al. 2010).
We used the Kolmogorov–Smirnov (K-S) test to compare the distributions of each parameter for the HDP AGNs with the whole sample (HDP AGNs excluded). The K-S probabilities are reported in Table 1. Only shows a significant correlation (). Distributions of other parameters (, , log, and ) are indistinguishable for the two samples. We will study the X-ray properties of the HDP AGNs in a following paper. We can also see some of these results in the fraction plot in Figure 3, where we divided two parameters 777One () with the lowest and one () with the highest . into nine bins and plotted the fraction of HDP AGNs in each bin.
| Parameter | (HDP)/(totalHDP)11The number of sources that have the detection of the physical parameter in the format of (HDP AGN)/(whole type 1 AGN sample exclude the HDP AGN). | |
|---|---|---|
| 41/363 | 0.0002 | |
| HR | 41/363 | 0.080 |
| log | 16/206 | 0.166 |
| 41/363 | 0.201 | |
| 41/363 | 0.202 | |
| 16/206 | 0.630 | |
| 41/363 | 0.729 |
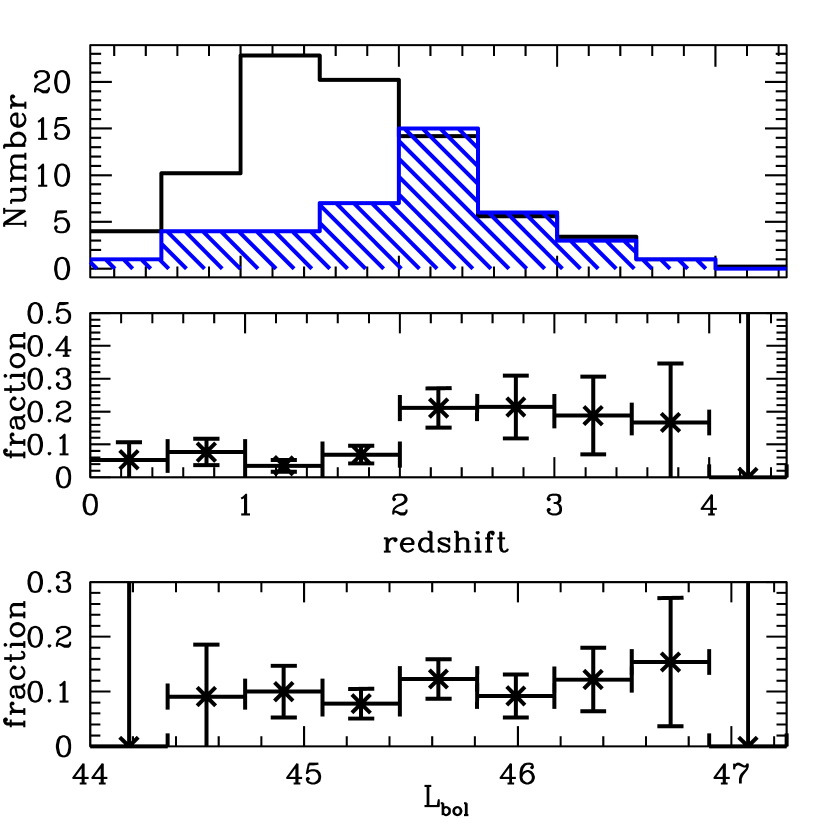
The fraction of the HDP AGNs clearly increases with . This fraction is at but increases to at . Beyond , the sample is too small (one source in two bins) to give a useful constraint. A linear regression fit of the fractions gives . The photometry used in the SED comes from a point source correction to the 3′′ aperture photometry. Low-redshift SEDs therefore include less host compared to the high redshift ones. This effect will only move the source along the mixing curve, so it cannot explain the observed HDP fraction increase versus redshift.
4.2. SED Fitting and Physical Parameters
Studies of NIR spectrum of quasars showed that a blackbody spectrum is needed to fit the observed spectrum (Glikman et al. 2006). The BBB is mainly caused by the emission of the accretion disk (e.g., Elvis et al. 1994) and could be reddened by the dust in the host (e.g., Hopkins et al. 2004). At m, host galaxy has the maximum contribution to the observed type 1 AGN SED (e.g., Polletta et al. 2007). Considering all these effects, we fit all the HDP AGNs observed NIR–optical SEDs with three components: (1) accretion disk emission: we use the standard -disk model in Schwarzschild geometry with electron scattering and Comptonization of soft photons in the disk atmosphere (Siemiginowska et al. 1995), with measured BH mass and accretion rate where available (Hao et al. 2010) and 0.1–0.2 in eight cases to get good chi-square in the UV. (2)hot dust emission: we use a single temperature blackbody spectrum. (3)host galaxy emission: we use a 5 Gyr old elliptical galaxy (Polletta et al. 2007). Examples of the fit results are shown in the lower panel of Figure 2.
4.2.1 Covering Factor
The NIR SEDs are fitted with a blackbody to get the maximum dust temperature (). The sublimation temperature for graphite and silicate grains are 1500–1900 K and 1000–1400 K, respectively (e.g., Salpeter 1977; Laor & Draine 1993). ranges from 800 K to 1900 K. Most (19 out of 34) HDP AGNs with dust component have 1400 K, suggesting graphite grains.
Dust can only exist at a radius beyond the dust evaporation radius, given by pc (Barvainis 1987), where is the total ultraviolet (1m–912Å) luminosity in units of erg s-1 and is the maximum dust temperature in units of 1500 K. We find ranges from 0.2 pc to 3.9 pc for the HDP sources. The emission area () is given from the blackbody fitting, and ranges from 0.1 pc2 to 10.68 pc2. The covering factor of the dust component is then ). For example, the results for source XID=2105 (Figure 2, left) are =1500 K and =1.76 pc2. The evaporation radius is 0.83 pc, corresponding to = 20%. ranges from 1.9% to 29%, which are a factor of 2–40 smaller than the 75% expected from the unified models to give the observed type 2 to type 1 ratio (e.g., Krolik & Begelman 1988). Even if considering the dependence of type 2 to type 1 ratio on X-ray luminosity (e.g., Gilli et al. 2007), the of HDP AGN is still smaller than the 50% expected for the X-ray bright AGNs.
The above innermost radius estimation is comparable to those reported in Kishimoto et al. (2007, 2009). Kishimoto et al. (2007) also showed that the innermost radii measured by near-IR reverberation are systematically smaller by a factor of 3 than the value predicted with the Barvainis (1987) formula. For the HDP AGNs, if the innermost radius of the hot dust is really a factor of 3 smaller, the covering factor would be a factor of 9 larger than the values we calculated, which could reach the 75% required by the unified models (e.g., Krolik & Begelman 1988) for most (29 out of 34) of the HDP sources.
4.2.2 Disk Outer Radius
For 11 HDP AGNs with little host galaxy contamination (defined as 50% at m), and available and (Lusso et al. 2010; Trump et al. 2009b; Merloni et al. 2010), the lack of hot dust emission allows us to see what appears to be the accretion disk emission extending further out well beyond m.
We fitted the outer edge of the accretion disk component (red dashed line in Figure 2) with a single temperature () blackbody spectrum (green dashed line). The outer radius of the accretion disk (Frank et al. 2002):
where and . We assume , .
An example is the source XID=96 shown in Figure 2 (lower middle; , ), the blackbody temperature at outer edge is 3200 K. This gives pc, Schwarzschild radius (), 13.6 times the gravitational stability radius of the accretion disk (Goodman 2003, i.e., the radius beyond which the disk is unstable to self-gravity and should break up). For the 11 HDP AGNs, the range from 2200 K to 4500 K. The range from 0.09 pc to 0.99 pc, corresponding to . These are 10–23 times larger than the gravitational stability radius.
5. Discussion and Conclusions
In a sample of 404 XMM-selected type 1 AGNs (excluding four with incomplete NIR photometry), we found that have weak NIR emission, indicating a relative paucity of hot dust emission. We call these HDP AGNs.
HDP AGNs have not been reported from SDSS or earlier samples. We have made an initial check of where the Richards et al. (2006) and E94 samples lie on the plane. We find similar fraction of HDP AGNs and will report on this study in detail in a later paper. The plane is a useful tool for locating outliers.
The fraction of HDP AGNs clearly increases to redshift (). No trends of the fraction of HDP AGNs with other parameters, notably , are observed.
We divided these HDP AGNs into three classes according to their and . We fitted the HDP SEDs with three components: the accretion disk, a blackbody to represent the hot dust, and the host galaxy. We found the dust covering factors are 1.9%–29%, well below the typical 75% required by unified models (e.g., Krolik & Begelman 1988). For the 11 HDP AGNs with little host contribution ( 50% at 1 m) and available and , we estimated the lower limit of the accretion disk outer radius to be (0.29–2) (0.09–0.99 pc), corresponding to 10–23 times the gravitational stability radius of an disk. How these disks stabilized is an open question, or the long wavelength turndown is not as we assumed. These results agree with the NIR disk spectrum uncovered using polarized light in Kishimoto et al. (2008). We ignore further discussion of the sources with strong host galaxy contribution as the system is more complicated to include the also unknown galaxy part.
There are several possibilities to explain the lack of NIR emission in HDP sources. First, most XMM–COSMOS HDPs are at , when the universe is 2.1–4.2 Gyr old, and they have 1–3 Gyr from reionization to form a torus. The Jiang et al. (2010) proposed explanation thus seems unlikely for the XMM–COSMOS HDP AGNs. Second, the luminosity and Eddington ratio distributions of the HDP AGNs and the normal XMM–COSMOS type 1 AGNs are indistinguishable. This rules out the possibility that HDP AGNs are low-luminosity or low-accretion rate sources, unable to support a dusty torus (Elitzur & Ho 2009). Third, evolutionary scenarios (e.g., Hopkins et al. 2008) predict short-lived Eddington limited outbursts after a merger, which could destroy the innermost dust. The HDP AGNs might then be quasars that had insufficient time to reform dust in the inner region. Fourth, alternatively, when two galaxies merge , the chaotic dynamics might destroy the “torus”. The ‘torus’ then reforms in a timescale that might allow 10% of quasars to be HDP. The dust formation timescale depends strongly on pressure and temperature (Whittet 2003; Krügel 2003) making estimates unreliable as both quantities are poorly known. Last, Guedes et al. (2010) suggested that a BH ejected by gravitational wave recoil and carrying along its accretion disk and broad emission line region, but not the hot dust “torus”, would appear as an HDP AGN.
The unusual SEDs of HDP AGNs can affect estimates of galaxy bulge and BH masses derived from SED fitting assuming the BH SED to be E94 mean SED. Merloni et al (2010) recently used this method to show that quasars deviate from the local relationship (Häring & Rix 2004). Three of the Merloni et al. (2010) quasars belong to our HDP sample. For these sources, the SED fitting using E94 template gives a small AGN contribution. Allowing an HDP SED to fit would increase the BH mass and decrease the stellar mass, making them deviate even more from the local relationship. New AGN templates with variable dust bump strengths are needed to derive accurate galaxy and BH masses in these objects.
The properties of the HDP AGNs still need to be investigated to understand their formation scenario and put them in the context of galaxy and SMBH evolution. In particular, we will check the existing Hubble images and optical and X-ray spectra of HDP AGNs in future papers.
6. Acknowledgments
H.H. thanks Sumin Tang for useful discussions. This work was supported in part by NASA Chandra grant number GO7-8136A (H.H., F.C., M.E.). In Italy this work is supported by ASI/INAF grants I/023/05.
References
- Antonucci (1993) Antonucci, R. 1993, ARA&A, 31, 473
- Appleton et al. (2004) Appleton, P. N., et al. 2004, ApJS, 154, 147
- Barvainis (1987) Barvainis, R. 1987, ApJ, 320, 537
- Brusa et al. (2007) Brusa, M., et al. 2007, ApJS, 172, 353
- Brusa et al. (2010) Brusa, M., et al. 2010, ApJ, 716, 348.
- Capak et al. (2007) Capak, P., et al. 2007, ApJS, 172, 99
- Cappelluti et al. (2009) Cappelluti, N., et al. 2009, A&A, 497, 635
- Cirasuolo et al. (2007) Cirasuolo, M., et al. 2007, MNRAS, 380, 585
- Donley et al. (2008) Donley, J. L., Rieke, G. H., Pérez-González, P. G. & Barro, G. 2008, ApJ, 687, 111
- Elitzur & Ho (2009) Elitzur, M. & Ho, L. C. 2009, ApJ, 701, L91
- Elitzur & Shlosman (2006) Elitzur, M. & Shlosman, I. 2006, ApJ, 648, L101
- Elvis et al. (1994) Elvis, M. et al., 1994, ApJS, 95, 1
- Elvis et al. (2010) Elvis, M., et al., 2010, ApJ in preparation
- Emmering et al. (1992) Emmering, R. T., Blandford, R. D. & Shlosman, I. 1992, ApJ, 385, 460
- Frank et al. (2002) Frank, J., King, A., & Raine, D. 2002, Accretion Power in Astrophysics (Cambridge University Press)
- Gilli et al. (2007) Gilli, R., Comastri, A. & Hasinger, G., 2007, A&A, 463, 79
- Glikman et al. (2006) Glikman, E., Helfand, D. J. & White, R. L. 2006, ApJ, 640, 579
- Goodman (2003) Goodman, J., 2003, MNRAS, 339, 937
- Gordon et al. (2003) Gordon, K. D., Clayton, G. C., Misselt, K. A., Landolt, A. U. & Wolff, M. J. 2003, ApJ, 594, 279
- Guedes et al. (2010) Guedes, J., Madau, P., Mayer, L. & Callegari, S. 2010, ApJ, submitted, astro-ph 1008.2032
- Hao et al. (2010) Hao, H., et al., ApJ, in preperation
- Häring & Rix (2004) Häring, N. & Rix, H.-W., 2004, ApJ, 604, L89
- Hasinger et al. (2007) Hasinger, G., et al., 2007, ApJS, 172, 29
- Hopkins et al. (2004) Hopkins, P. F., et al., 2004, AJ, 128, 1112
- Hopkins et al. (2008) Hopkins, P. F., Hernquist, L.,Cox, T. J. & Kere, D. 2008, ApJS, 175, 356
- Jiang et al. (2010) Jiang, L. et al., 2010, Nature, 464, 380
- Kishimoto et al. (2007) Kishimoto, M., Hönig, S. F., Beckert, T., & Weigelt, G. 2007, A&A, 476, 713
- Kishimoto et al. (2008) Kishimoto, M., Antonucci, R., Blaes, O., Lawrence, A., Boisson, C., Albrecht, M., & Leipski, C. 2008, Nature, 454, 492
- Kishimoto et al. (2009) Kishimoto, M., Hönig, S. F., Antonucci, R., Kotani, T., Barvainis, R., Tristram, K. R. W. & Weigelt, G. 2009, A&A, 507, L57
- Krolik & Begelman (1988) Krolik, J. H. & Begelman, M. C., 1988, ApJ, 329, 702
- Krügel (2003) Krügel, E., 2003, The Physics of Interstellar Dust (Bristol and Philadelphia: Institute of Physics)
- Lacy et al. (2004) Lacy, M., et al., 2004, ApJS, 154, 166
- Lacy et al. (2007) Lacy, M., Petric, A. O., Sajina, A., Canalizo, G., Storrie-Lombardi, L. J., Armus, L., Fadda, D. & Marleau, F. R. 2007, AJ, 133, 186
- Laor, A. & Draine, B. T. (1993) Laor, A. & Draine, B. T., 1993, ApJ, 402, 441
- Lilly et al. (2007) Lilly, S. J., et al. 2007, ApJS, 172, 70
- Lilly et al. (2009) Lilly, S.J., et al., 2009, ApJS, 184, 218
- Lusso et al. (2010) Lusso, E., et al., 2010, A&A, 512, 34
- Merloni et al. (2010) Merloni, A., et al., 2010, ApJ, 708, 137
- Miley et al. (1985) Miley, G. K., Neugebauer, G. & Soifer, B. T. 1985, ApJ, 293, 11
- Polletta et al. (2007) Polletta, M., et al., 2007, ApJ, 663, 81
- Richards et al. (2006) Richards, G., et al., 2006, ApJS, 166, 470
- Rowan-Robinson et al. (2009) Rowan-Robinson, M., Valtchanov, I. & Nandra, K., 2009, MNRAS, 397, 1326
- Salpeter (1977) Salpeter, E. E., 1977, ARA&A, 15, 267
- Schneider et al. (2007) Schneider, D. P., et al., 2007, AJ, 130, 367
- Siemiginowska et al. (1995) Siemiginowska, A., Kuhn, O., Elvis, M., Fiore, F., McDowell, J. & Wilkes, B. J. 1995, ApJ, 454, 77
- Suganuma et al. (2006) Suganuma, M., et al., 2006, ApJ, 639, 46
- Stern et al. (2005) Stern, D. et al., 2005, ApJ, 631, 163
- Tananbaum et al. (1979) Tananbaum, H., et al. 1979, ApJ, 234, 9
- Trump et al. (2009a) Trump, J. R., et al., 2009, ApJ, 696, 1195
- Trump et al. (2009b) Trump, J. R., et al., 2009, ApJ, 700, 49
- Urry & Padovani (1995) Urry, C., & Padovani, P. 1995, PASP, 107, 803
- Whittet (2003) Whittet, D.C.B., 2003, Dust in the Galactic Environment (Bristol and Philadelphia: Institute of Physics)