First-principles calculations of phase transition, elasticity, and thermodynamic properties for TiZr alloy
Abstract
Structural transformation, pressure dependent elasticity behaviors, phonon, and thermodynamic properties of the equiatomic TiZr alloy are investigated by using first-principles density-functional theory. Our calculated lattice parameters and equation of state for and phases as well as the phase transition sequence of are consistent well with experiments. Elastic constants of and phases indicate that they are mechanically stable. For cubic phase, however, it is mechanically unstable at zero pressure and the critical pressure for its mechanical stability is predicted to equal to 2.19 GPa. We find that the moduli, elastic sound velocities, and Debye temperature all increase with pressure for three phases of TiZr alloy. The relatively large values illustrate that the TiZr alloy is rather ductile and its ductility is more predominant than that of element Zr, especially in phase. Elastic wave velocities and Debye temperature have abrupt increase behaviors upon the transition at around 10 GPa and exhibit abrupt decrease feature upon the transition at higher pressure. Through Mulliken population analysis, we illustrate that the increase of the d-band occupancy will stabilize the cubic phase. Phonon dispersions for three phases of TiZr alloy are firstly presented and the phase phonons clearly indicate its dynamically unstable nature under ambient condition. Thermodynamics of Gibbs free energy, entropy, and heat capacity are obtained by quasiharmonic approximation and Debye model.
pacs:
62.20.de, 64.70.kd, 61.50.Ks, 74.70.AdI INTRODUCTION
Group IV transition metals such as titanium, zirconium, and hafnium as well as their alloys have been investigated extensively by experiments and theoretical calculations since their particular applications in the aerospace, nuclear, and chemical industries Ikehata ; LiuPRB ; Perez ; Vohra . Their properties of low thermal neutron absorption cross section, adequate strength and ductility, good corrosion resistance, long-term dimensional stability in an irradiation environment, excellent compatibility with the fuel and coolant, good thermal conductivity and adequate resistance to fracture project them to the front of material applications for both fuel element cans and in-core structural components in water-cooled nuclear reactors Kutty . Specifically, TiZr alloy is traditionally used for high-pressure neutron diffraction and has similar machining properties to the ZrNb alloy used in nuclear-reactor tubing. Therefore, investigations of their structural and elastic properties, which relate to various fundamental solid-state properties such as interatomic potentials, equation of state, phonon spectra, and thermodynamic properties, have prominent meaning in both scientific and technological fields. The scientific interest in Group IV transition metals and their alloys origins from the fact that they have a narrow d-band in the midst of a broad sp-band. The d-band occupancy is crucial for the structural stability of these materials and a pressure-induced s-d electron transfer is the driving force behind their structural and electronic transitions Duthie ; Skriver .
At ambient condition, both Ti and Zr crystallize in hexagonal closed-packed (hcp) structure ( phase). At high temperature of 1155 and 1135 K, they transform into the body-centered cubic (bcc) phase, respectively. At room temperature and under compression, -Zr transforms to another hexagonal structure phase at about 27 GPa Zilbershtein ; Sikka ; Xia1 ; ZhaoPRB . Under further high pressure of 3035 GPa, the phase transition has been observed Xia1 ; Xia2 ; Akahama1 ; Akahama2 ; ZhaoAPL . The whole transition series for Zr have been reproduced in theoretical investigations WangZr ; HaoPRB ; Schnell ; Ahuja . However, the experimental established room temperature transition sequence of Ti is Vohra ; Xia1 ; Akahama3 ; Errandonea . The phase of Ti metal has not been observed up to 216 GPa Akahama3 . Recent first-principles study performed by Mei et al. MeiPT found that the -Ti is not stable under hydrostatic compression and the 0 K phase transition sequence of Ti is . The absence of the high-pressure phase for Ti in experiments was attributed to the possible nonhydrostatic stress which distorts the phase Verma .
For TiZr alloys, transition sequence of upon compression has been reported by Bashkin et al. BashkinPSS2000 ; BashkinJETP ; BashkinPRB . Using the differential thermal analysis (DTA) and calorimetric technique, they extensively studied the effects of temperature and pressure on the and transformations in the equiatomic TiZr alloy at temperatures up to 1023 K, and pressures up to 7 GPa. BashkinPSS2000 At atmospheric pressure, the transition temperature was measured to be 852 K upon cooling. Under pressure, the transition temperature decreases down to the triple equilibrium point (=4.90.3 GPa, =73330 K). At pressures above the triple point, the slope of the equilibrium boundary is positive at pressures up to 7 GPa. At room temperature, the transition occurs at around 5 GPa. Cooling of the phase in the pressure range 2.84.8 GPa can form a two-phase mixture of a stable and a metastable phase. Another group Aksenenkov reported that the equilibrium boundary is situated on the diagram at 6.6 GPa. Afterward, Bashkin et al. BashkinJETP ; BashkinPRB employed the energy-dispersive X-ray diffraction (EDXD) with synchrotron radiation to investigate the structural transitions of the TiZr alloy. They found an increase in the transition pressure from about 30 to 4357 GPa when the titanium content in the alloys increases from 0 to 50 at. %. The pressure dependant behaviors of superconductivity was also presented. For equiatomic TiZr alloy, they found that the phase remains the sole stable phase under quasi-hydrostatic pressure up to 12.2 GPa BashkinPRB . Only from 15.5 GPa on, the phase becomes dominant. Recent in situ high-temperature high-pressure angle-dispersive synchrotron radiation diffraction experiment revealed that under pressure the equiatomic TiZr alloy occurs an isostructural transition at high-pressure domain Dmitriev .
However, to date only one theoretical study has focused on TiZr alloy Trubitsin , where they calculated the electron structure and total energy by the scalar relativistic full-potential linearized augmented-planewave (FPLAPW) method with a generalized gradient approximation (GGA) potential. The phase diagram and tendency toward decomposition in equiatomic TiZr alloy were calculated within the electron density functional theory (DFT) and the Debye-Grneisen model. Their calculations showed that the phase is stable at atmospheric pressure and moderate (up to 610 K) temperatures, and hence no transition occurs at room temperature. They attributed the discrepancy between experiment and theory to the experimental samples, within which defects may exist. In present work, we have carefully calculated the structural, phase transition, elastical, phonon vibrational, and thermodynamic properties for equiatomic TiZr alloy by employing the first-principles total energy calculations. Elastic constants, elastic properties, and phonon dispersions of three experimentally observed phases are firstly presented. Our main motivation is to give out detail pressure behaviors of the elasticity as well as the thermodynamic properties to support the practical application of TiZr alloy in nuclear technology.
II computational methods
First-principles DFT calculations on the basis of the frozen-core projected augmented wave (PAW) method of Blöchl PAW are performed within the Vienna ab initio simulation package (VASP) Kresse3 , where the Perdew, Burke, and Ernzerhof (PBE) PBE form of the GGA is employed to describe electron exchange and correlation. To obtain accurate total energy and stress tensor, a cutoff energy of 500 eV is used for the plane-wave set. The -centered k point-meshes in the full wedge of the Brillouin zone (BZ) are sampled by 181816, 16169, and 181818 grids according to the Monkhorst-Pack (MP) Monk for (two atoms cell), (six atoms 112 supercell), and (two atoms cell) phases TiZr alloy, respectively. Full geometry optimization at each volume is considered to be completed when all atoms are fully relaxed until the Hellmann-Feynman forces becoming less than 0.001 eV/Å. The Ti 32363341 and the Zr 42464351 orbitals are explicitly included as valence electrons.
III results
III.1 Structure
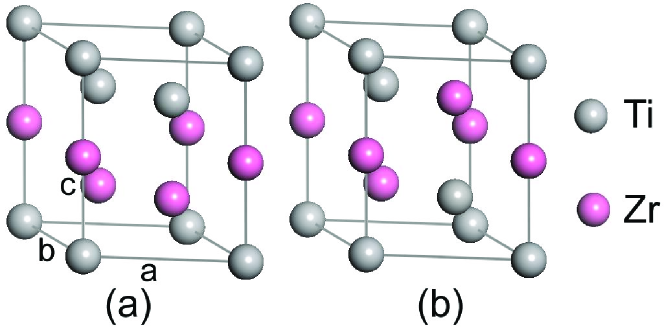
In calculations of phase TiZr alloy, we use one lamella structure, which has the same unit cell as the conventional hcp unit cell but the Ti and Zr atoms are located on the layer along the c axis alternately. For phase, Ti atoms are fixed at corner and Zr atoms are located at center of the bcc unit cells. For TiZr, two types (A-type and B-type) of 112 supercells are constructed (Fig. 1). The theoretical equilibrium structural parameters, bulk modulus B, and pressure derivative of the bulk modulus B′ obtained by fitting the energy-volume data in the third-order Birch-Murnaghan equation of state (EOS) Birch are tabulated in Table 1. Experimental values from Ref. BashkinPRB and other theoretical results from Refs. Ikehata and Trubitsin are also presented for comparison. Note that we only list in Table 1 the results of B-type structure for phase. Our calculated equilibrium structural parameters for A-type phase are =4.829 Å and =3.013 Å. Its bulk modulus B and pressure derivative of the bulk modulus B′ are equal to 100.6 GPa and 3.63, respectively. All these values are almost equal to that of B-type structure. However, the total energy of B-type structure is smaller by 0.0769 eV per formula unit than that of A-type structure. Using A-type structure for phase will lead to incorrect results in calculations of phase transition and mechanical properties. Thus, the results of A-type phase are not presented in the following and unless otherwise stated results of phase refer to that of B-type structure.
| Phase | Method | Pressure | a | c | B | B | C11 | C12 | C13 | C33 | C44 |
|---|---|---|---|---|---|---|---|---|---|---|---|
| (GPa) | (Å) | (Å) | (GPa) | (GPa) | (GPa) | (GPa) | (GPa) | (GPa) | |||
| This work | 0 | 3.111 | 4.913 | 97.8 | 3.47 | 145.1 | 72.5 | 70.9 | 169.0 | 30.0 | |
| 5 | 3.059 | 4.847 | 162.6 | 85.2 | 80.8 | 193.9 | 31.5 | ||||
| 10 | 3.013 | 4.795 | 181.2 | 95.7 | 90.1 | 217.8 | 33.4 | ||||
| DFT-PBE | 0 | 3.114 | 4.918 | 137.7 | 75.3 | 67.8 | 164.0 | 30.0 | |||
| Expt. | 0 | 3.104 | 4.923 | 148 | 3.8 | ||||||
| This work | 0 | 4.825 | 3.011 | 100.5 | 3.55 | 170.9 | 76.2 | 51.9 | 209.2 | 39.6 | |
| 10 | 4.697 | 2.923 | 216.1 | 97.6 | 66.7 | 257.2 | 45.6 | ||||
| 20 | 4.592 | 2.860 | 257.7 | 120.1 | 80.6 | 301.4 | 49.5 | ||||
| 30 | 4.507 | 2.808 | 298.5 | 141.7 | 93.5 | 340.9 | 51.4 | ||||
| 40 | 4.438 | 2.762 | 336.8 | 163.7 | 105.3 | 375.5 | 51.6 | ||||
| Expt. | 0 | 4.840 | 2.991 | 146 | 1.7 | ||||||
| This work | 0 | 3.423 | 94.8 | 3.35 | 91.5 | 96.8 | 36.6 | ||||
| 10 | 3.321 | 134.4 | 113.0 | 30.2 | |||||||
| 20 | 3.244 | 172.9 | 129.2 | 38.9 | |||||||
| 30 | 3.181 | 211.1 | 142.9 | 47.0 | |||||||
| 40 | 3.128 | 249.9 | 153.1 | 55.0 | |||||||
| 50 | 3.081 | 286.9 | 164.6 | 64.5 | |||||||
| 60 | 3.040 | 322.6 | 176.3 | 76.0 | |||||||
| FPLAPW-GGA | 0 | 3.417 | |||||||||
| Expt. | 57 | 3.098 |
Reference Ikehata , Reference BashkinPRB , Reference Trubitsin .
From Table 1, one can find excellent coincidence between our calculated values and the corresponding experimental results for and structural parameters. But our calculated bulk moduli B for these two phases are largely smaller than that from experiment. Although we can not simply attribute these results to the under-binding effect of the GGA approach, we find that our calculated bulk modulus B for TiZr alloy lies within the range of experimental values between Ti 102 GPa Vohra and Zr 92 GPa ZhaoPRB . As for phase, our calculated equilibrium crystal constant is in good agreement with recent theoretical calculation Trubitsin , where a value of 3.417 Å was given out. The discrepancy between our results and the experimental value (3.417 Å at 57 GPa) BashkinPRB mainly due to the temperature effect.
| Transition pressure | |||
|---|---|---|---|
| (GPa) | |||
| Metal | Transition | Expt. | Theory |
| TiZr | 511 | 13.8 | |
| 43 | 26, 33.9 | ||
| Ti | 211.9 | 52, 3.7 | |
| Zr | 27 | 4.8, 3.3, 3.7 | |
| 3035 | 32.4 | ||
Reference BashkinPSS2000 ; BashkinPRB ; Aksenenkov , Present work, References Trubitsin , References Vohra ; Xia1 ; Akahama3 ; Errandonea , Reference JonaPSS , Reference MeiPT , References Sikka ; Xia1 ; ZhaoPRB , Reference JomardZr , Reference LandaZr , Reference WangZr , References Xia1 ; Xia2 ; Akahama1 ; Akahama2 ; ZhaoAPL .
III.2 Phase transition at 0 K
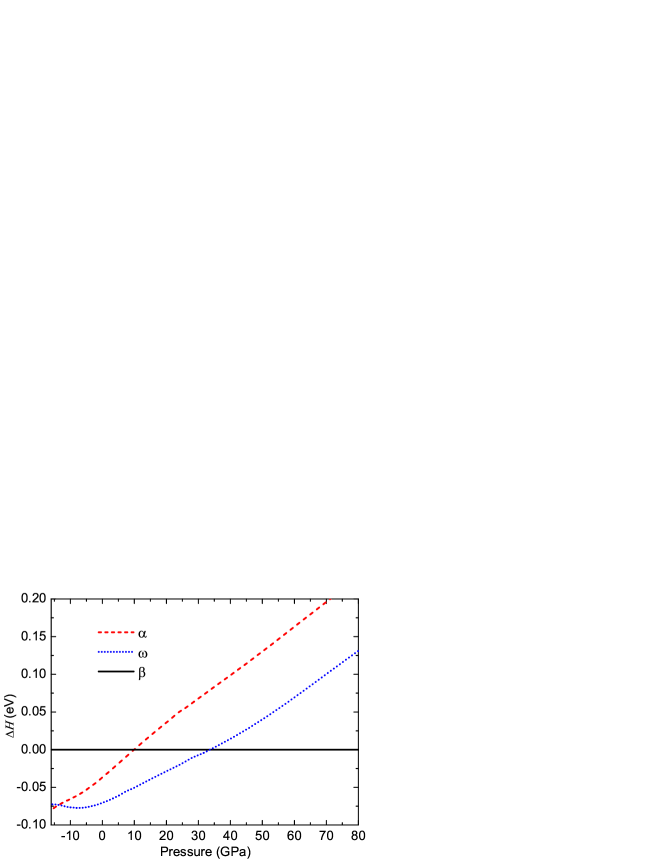
At 0 K, the Gibbs free energy is equal to the enthalpy H. After calculation, we can plot in Fig. 2 the relative enthalpies of the and the phases with respect to the phase as a function of pressure. The crossing between the and enthalpy curves readily gives phase transition pressure of 13.8 GPa, which indicates that at ambient pressure the phase is more stable than the phase. This fact is in disagreement with experiment BashkinPSS2000 ; BashkinPRB ; Aksenenkov , but coincides with recent theoretical calculations Trubitsin . Trubitsin et al. Trubitsin attributed the discrepancy between experiment and theory to the experimental impure samples. They presented detailed explanation for this discrepancy. In our opinion, the imperfect crystals used in experiments may responsible mainly for this discrepancy. After all, the metastable phase was obtained at atmospheric pressure through cooling of the phase under a pressure of 6 GPa with subsequent unloading at room temperature. One other reason may from the temperature contribution. In Table 2, we list the transition pressures for TiZr alloy as well as pure Ti and Zr metals from experiments and theoretical calculations. For the stable phase of metals Ti and Zr at ambient pressure, there exist debates in theoretical studies WangZr ; HaoPRB ; MeiPT ; JomardZr ; LandaZr ; Ostanin ; JonaJPCM ; JonaPSS ; GradPRB ; GreefZr although experiments Vohra ; Xia1 ; Akahama3 ; Sikka ; ZhaoPRB have reported the most stable phase to be phase. For metal Zr, two DFT works JomardZr ; LandaZr using full-potential linear muffin-tin orbital (FPLMTO)-GGA have illustrated the transition for Zr at 4.8 and 3.3 GPa, respectively. However, two other DFT works Ostanin ; JonaJPCM using FPLMTO-GGA and FPLAPW-LDA methods indicated that the most stable phase at 0 K under ambient pressure is , not phase. Two recent DFT-PBE works WangZr ; HaoPRB also support this conclusion. For metal Ti, the debates also exist in DFT calculations MeiPT ; JonaPSS as indicated in Table II. By adding the phonon contribution to the Gibbs energy, recent DFT-PBE HaoPRB ; Mei studies explicitly showed that the transition of for Ti (Zr) occurs at 1.8 (1.7) GPa at room temperature. Thus, the disagreement between some theoretical works and experiments for elemental Ti and Zr mainly originates from temperature effect. The entropy from the thermal population of phonon states will stabilize the phase at room temperature MeiPT . In our present work, we should also consider the temperature effect on the transition pressure for TiZr alloy since the same scheme used with respect to our previous study of Zr WangZr . In addition, Trubitsin et al. Trubitsin observed that TiZr alloy is stable in the temperature range 600 KT900 K after including lattice energy and entropy in the Debye model. Therefore, the disagreement of transition pressure between our calculation and experiment for TiZr alloy can also be attributed mainly to the experimental impure samples and partially to the temperature effect. As for the transition, our calculated transition pressure (33.9 GPa) is in good agreement with experiment BashkinPRB .
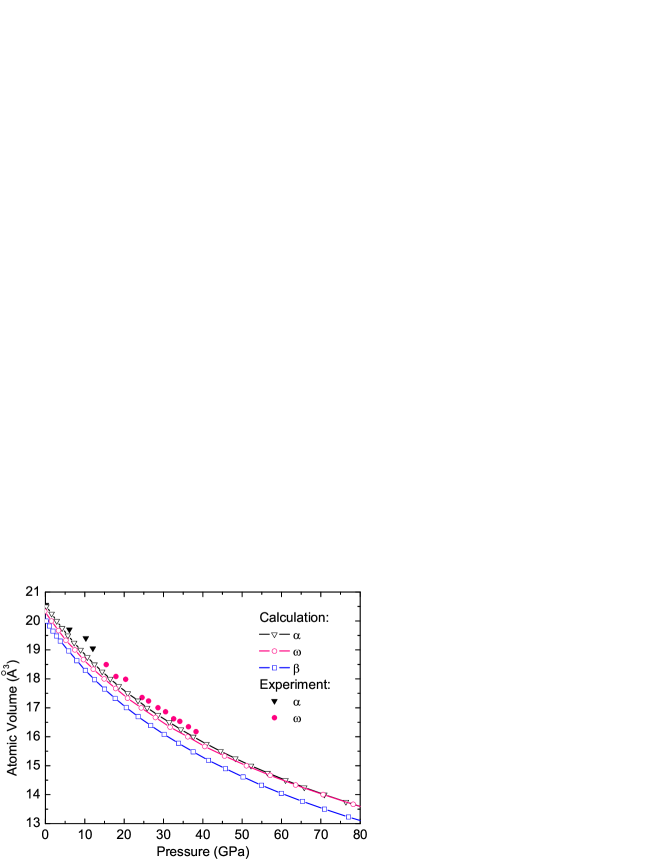
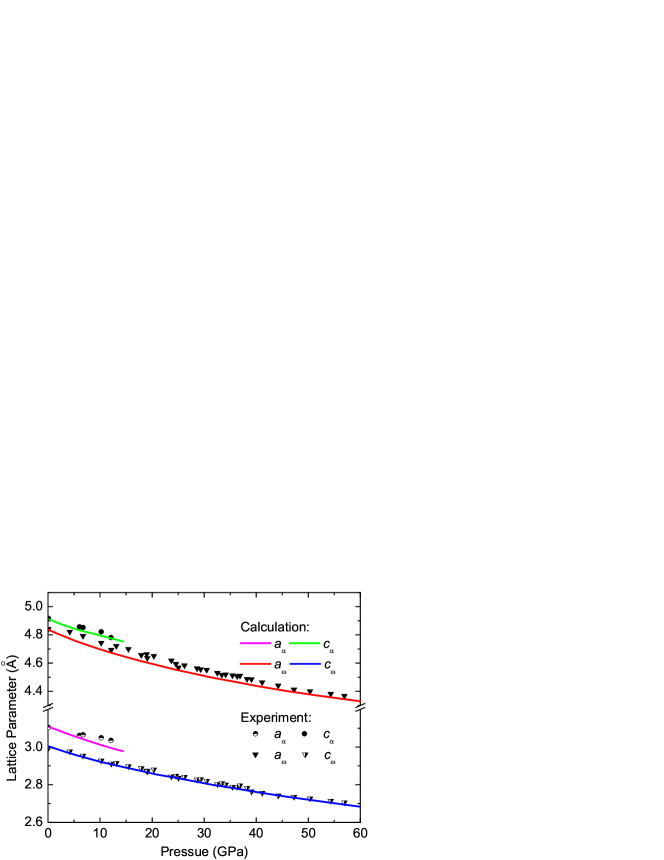
To further analyze the pressure behavior of TiZr alloy, we plot in Fig. 3 the compression curves of , , and phases. For comparison, the experimental data from Ref. BashkinPRB are also shown in the figure. Clearly, our calculated PV equation of states are well consistent with the experimental measurement. The slight smallness of our calculated volumes compared to that of the experimental data can be attributed to the temperature effect. The experiment was performed at room temperature, while our data are valid only at 0 K. In Fig. 4, we compare the calculated lattice parameters of and phases with experimental results BashkinPRB . Table 1 also lists the optimized structural parameters of TiZr alloy at some different pressures. In the whole pressure domain of 060 GPa, the predicted lattice parameters for both and phases compare well with the experimental values, which supplies the safeguard for our following study of mechanical and elastic properties of TiZr alloy under pressure.
III.3 Elasticity
Elastic constants can measure the resistance and mechanical features of crystal to external stress or pressure, thus describing the stability of crystals against elastic deformation. In present work, elastic constants for TiZr alloy in , , and phases at different pressures are calculated through applying stress tensors with various small strains onto the optimized structures. The strain amplitude is varied in steps of 0.006 from =0.036 to 0.036. Results are presented in Table 1. Obviously, the mechanical stability of and TiZr at 0 GPa and at some typical finite pressures can be predicted from the elastic constants data. But the elastic constants of phase at 0 GPa illustrate that the cubic phase is mechanically unstable. We notice that the phase metals Ti and Zr are also mechanically unstable at 0 GPa Hu ; WangZr . Along with the increase of pressure from 0 GPa to 60 GPa, the value of increases near linearly from 5.3 GPa to 146.3 GPa for TiZr. Fitting the curve (not shown) of the pressure behavior of by polynomial function, we find that the value of becomes positive at 2.19 GPa. In fact, at =2.5 GPa our calculated , and equal to 102.9, 101.2, and 25.6 GPa, respectively, which explicitly indicate the elastically stable of bcc TiZr under this pressure.
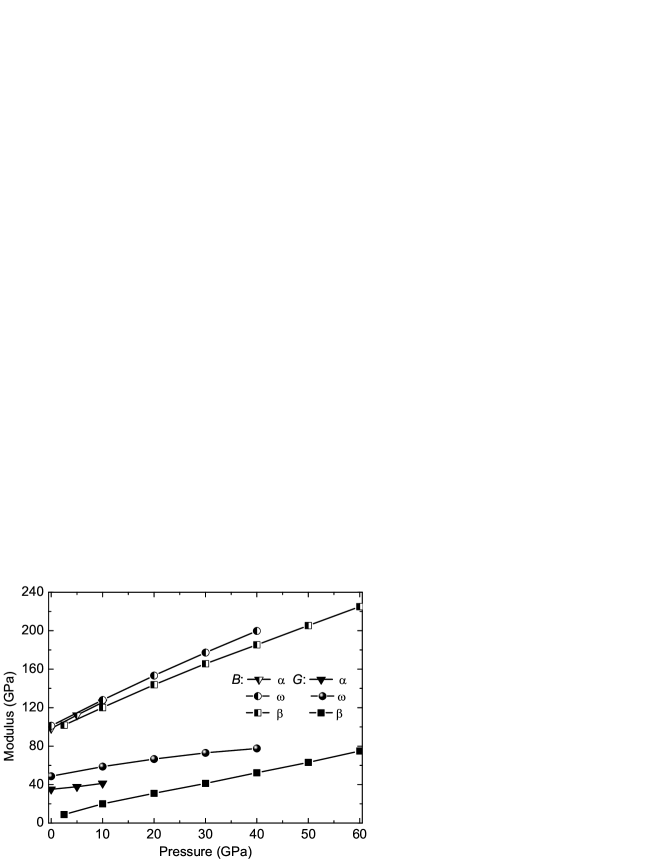
After obtaining elastic constants, the polycrystalline bulk modulus B and shear modulus G are calculated from the Voigt-Reuss-Hill (VRH) approximations Hill . Results of TiZr alloy in , , and phases are shown in Fig. 5. The deduced bulk moduli from VRH approximations for all three phases at 0 GPa turn out to be very close to that obtained from the EOS fitting, which indicates that our calculations are consistent and reliable. Along with the increasing of pressure, both bulk modulus B and shear modulus G increase near linearly for all three phases. The increasing rates of B for all three phases are apparently larger than that of G. It is well known that the shear modulus represents the resistance to plastic deformation, while the bulk modulus can represent the resistance to fracture. A high (low) value is responsible for the ductility (brittleness) of polycrystalline materials. The critical value to separate ductile and brittle materials is about 1.75 Pugh . Using the calculated values of bulk modulus and shear modulus for TiZr alloy, the values for phase increase from 2.80 to 3.04 under pressure from 0 GPa to 10 GPa, for phase increase from 2.08 to 2.57 upon compression from 0 GPa to 40 GPa, and for phase decrease from 11.57 to 3.01 under pressure from 2.5 GPa to 60 GPa. These results indicate that transit to phase will lead to less ductility and further transit to phase will result in more predominance of ductility. Although the large values for TiZr at pressure range of 030 GPa can not be achieved in experiment at room temperature, the value of about 3.5 for phase at 40 GPa indicates that the phase TiZr alloy possess the biggest ductility. For Zr, the value of 2.63 at ambient condition can be derived from the elastic data in Ref. LiuJAP . Therefore, TiZr alloy is rather ductile and its ductility is more predominant than that of element Zr. We hope that our calculated elastic constants and elastic moduli can be illustrative in the realistic application of the mechanical data for TiZr alloy.
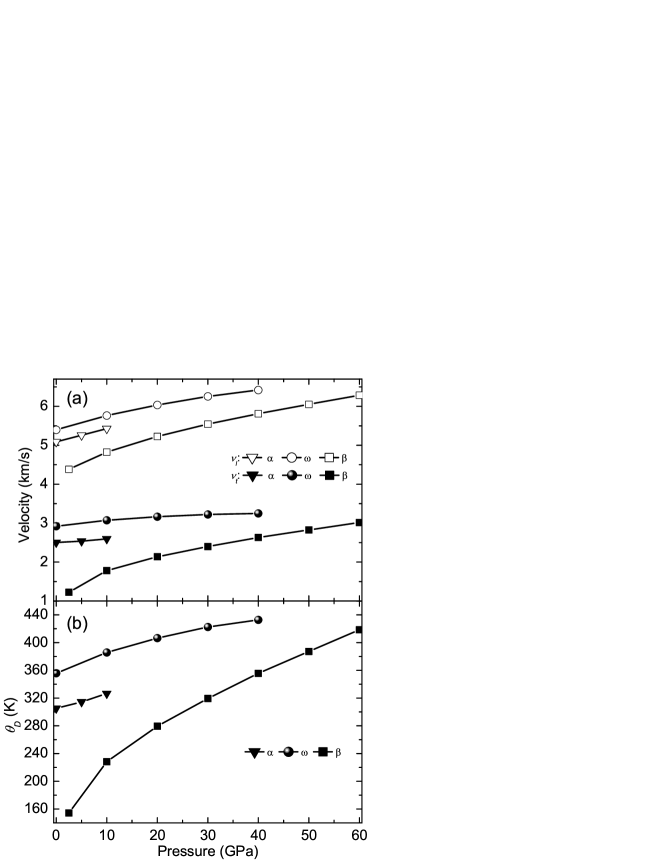
Elastic wave velocities provide important information about the behavior of materials before phase transition. The transverse and longitudinal elastic wave velocities of the polycrystalline materials can be calculated through relations of ( is the density) and , respectively. The average wave velocity in the polycrystalline materials is approximately given as . Using the relation , the Debye temperature () can be obtained. The calculated results of transverse and longitudinal elastic wave velocity are plotted in Fig. 6(a) and the Debye temperature in Fig. 6(b). Increasing behaviors of elastic wave velocities and under pressure are obvious. Transiting from to at around 10 GPa (experimental transition pressure), TiZr alloy exhibit abrupt increasing feature for both transverse and longitudinal elastic wave velocities: from 5.43 to 5.76 km/s for and from 2.60 to 3.07 km/s for . In study of element Zr, Liu et al. LiuJAP observed similar behaviors of elastic wave velocities by using ultrasonic interferometry in conjunction with synchrotron x-ray radiation. From Fig. 6(a), we find that the elastic wave velocities will decrease upon the to transition at high pressure. The Debye temperature also shows this kind of increase first (at to transition) and decrease later (at to transition) behavior upon compression.
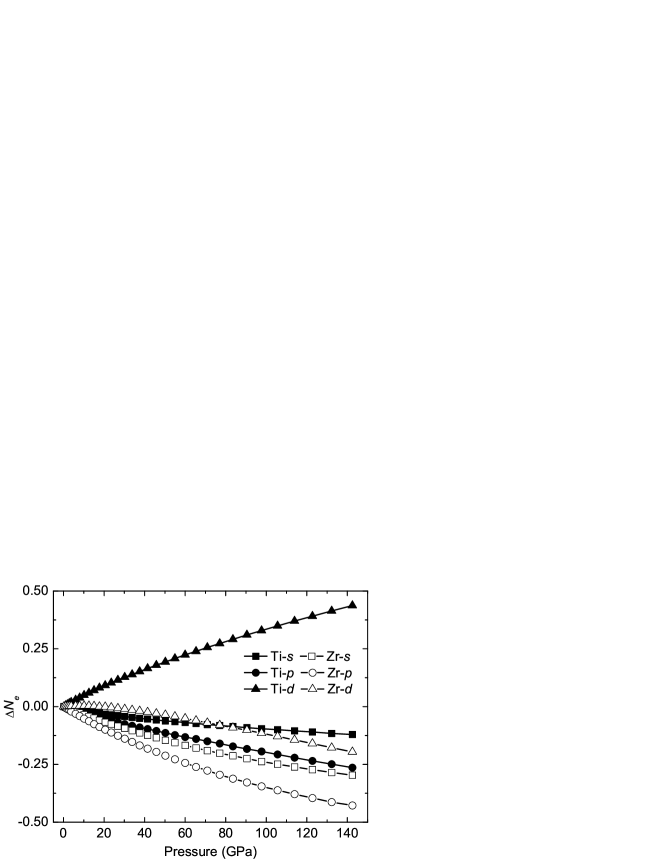
For discussion of pressure induced - electron transfer for TiZr alloy, we have performed Mulliken population analysis Mulliken of its phase and then plot in Fig. 7 the variation of the number of electrons on s, p, and d orbitals with increasing pressure. Clearly, only the of Ti atom increases with pressure. Arithmetic average of for Ti and Zr atoms also possesses obvious pressure-dependent increasing behavior. Increase of d-band occupancy will stabilize phase of TiZr alloy under pressure. However, we find that the sp electrons for Ti atom and the spd electrons for Zr atom all decrease upon compression up to 143 GPa. No increasing behavior of has been observed. This fact is different from Ti Hu and Zr Zhang , where it was found that the in both of these two elemental metals start to increase when the pressure exceeds about 70 and 100 GPa, respectively. Thus, the - electron transfer behaviors for TiZr alloy are different from its archetype metals.
III.4 Phonon dispersion
To our knowledge, although plenty of attentions have been paid on the phonon dispersions, thermodynamics, and phase diagrams of Ti Mei ; Souvatzis and Zr WangZr ; HaoPRB ; Schnell ; Heiming , no experimental and theoretical phonon dispersion results have been published for equiatomic TiZr alloy. In this subsection and the following subsection, we want to present our calculated results of phonon dispersion curves, thermodynamics, and phase diagram for TiZr alloy.
We use the supercell approach Parlinski and the small displacement method as implemented in the FROPHO code fropho to calculate the phonon curves in the BZ and the corresponding phonon density of states (DOS). In the interpolation of the force constants for the phonon dispersion curve calculations, 555, 331, and 555 k-point meshes are used for 333, 333, and 444 supercells, respectively. The forces induced by small displacements are calculated by VASP.
The calculated phonon dispersion curves and the phonon DOS of , , and TiZr alloy at 0 GPa are displayed in Fig. 8. Overall speaking, behaviors of the phonons in the BZ for and TiZr alloy are similar to that of metal Ti Mei and Zr WangZr . Same with Zr, the phonons for TiZr alloy are stiffer along the axis than in the basal plane due to the low ratio. The phonons along [001] direction for TiZr alloy are softer than that of metal Ti and Zr. Compared with Ti and Zr, phonons in the BZ for phase of TiZr alloy exhibit different behaviors. The unstable phonon branch along [110] direction in the two metals transfer to show stable and stiff feature in the alloy. On the contrary, the phonons along [001] direction are stable for metals but unstable for the alloy. These informations are important in analyzing phase transformation. The stable nature of phonon branch along [110] direction for TiZr alloy may responsible for the difficulties of transition under high temperature and the transition under high pressure as indicated in experiments BashkinPSS2000 ; BashkinPRB ; Aksenenkov .

III.5 Thermodynamic properties and phase diagram
Thermodynamic properties of equiatomic TiZr alloy can be determined by phonon calculation using the quasiharmonic approximation (QHA) Siegel ; Zhang2010 or by the quasiharmonic Debye model GIBBS . Within these two models, the Gibbs free energy G(T,P) is written as
| (1) |
Here, F(T,V) is the Helmholtz free energy at temperature T and volume V and can be expressed as
| (2) |
where E(V) is the ground-state total energy, Fvib(T,V) is the vibrational energy of the lattice ions and Fel(T,V) is the thermal electronic contribution.
Under QHA, the Fvib(T,V) can be calculated by
| (3) |
where represents the phonon frequencies and is the phonon DOS. This formula requests positive results of phonon DOS. So it is not suitable for dynamically unstable phases. Instead, the vibration energy for phases with imaginary phonon frequencies can be estimated by the Debye model
| (4) |
where is zero-point energy due to lattice ion vibration at 0 K and the Debye integral written as . Detailed computation scheme of Debye model please see Ref. GIBBS .
in Eq. (2) can be obtained from the energy and entropy contributions, i.e., . The electronic entropy is of the form
| (5) |
where is electronic DOS and is the Fermi-Dirac distribution. The energy due to the electron excitations takes the following form:
| (6) |
where is the Fermi energy.
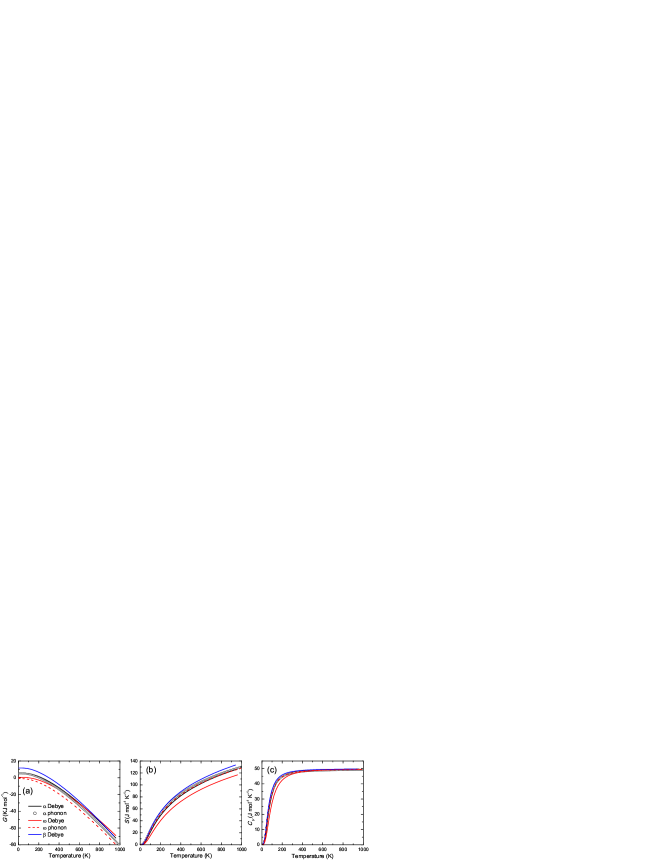
Using QHA and Debye model, we calculated the Gibbs free energy (), entropy (), and specific heat at constant volume () for , , and phases of TiZr alloy at their equilibrium volumes. As shown in Fig. 9, the Gibbs free energy and entropy calculated by QHA are almost identical to those obtained by employing the Debye model for phase, while the differences between these two schemes for phase is slightly large, especially for high-temperature domain. Although the phonon calculation is more reliable in general analysis, some nonharmonic terms, which is important for phase, possibly having been ignored in the QHA method. From Fig. 9(a), cross between and curves by Debye calculations readily gives phase transition temperature of 680 K. A phase transition temperature of 940 K for also can be seen. So, we can use Debye model to obtain the phase diagram by changing the pressure (see Fig. 10). However, there is no cross between and curves using phonon calculations. This need more works to clarify. Figure 9(b) shows the entropy results. While the entropy of phase is lower than phase, the results of phase are higher than phase in all considered temperature domain. The specific heat at constant volume () can be directly calculated by . Results are presented in Fig. 9(c), using which one can estimate the Debye temperature. Actually, our phonon calculations indicate that the zero-point energies for and phases at =0 GPa are 27.02 and 28.00 meV, respectively. So, the Debye temperature values from phonon calculations equal to 278.6 and 288.9 K, respectively. The Debye model gives =303.6 and 369.0 K for and phases, respectively. So, the Debye model gives closer values than the phonon calculations with respect to the Debye temperature values of 305.1 and 355.6 K computed by elastic constants (see Fig. 7).
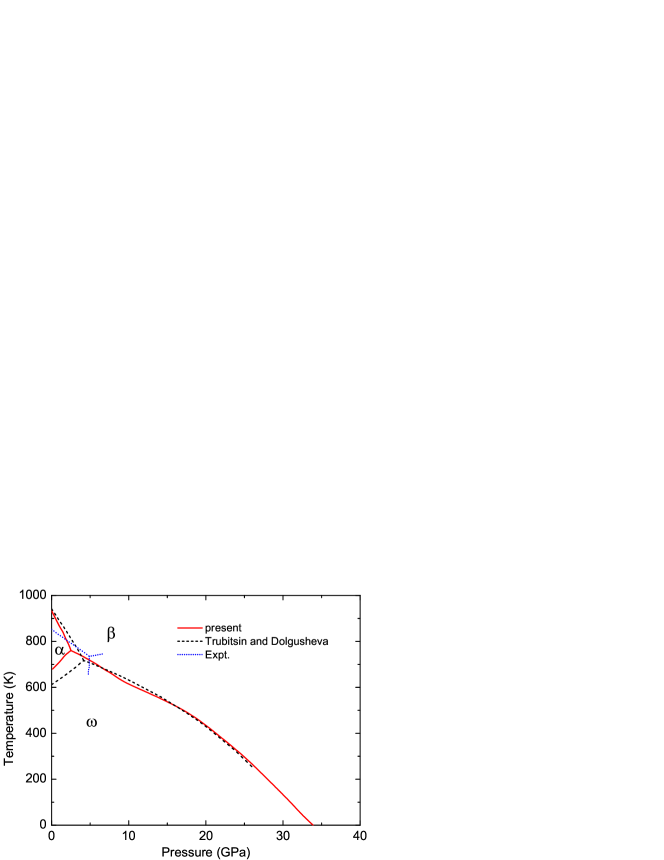
We present in Fig. 10 the phase diagram of equiatomic TiZr alloy calculated by the Debye model. A triple point (=2.5 GPa, =760 K), comparable to experimental results (=4.90.3 GPa, =73330 K) BashkinPSS2000 and previous theoretical values (=4.2 GPa, =720 K) Trubitsin , is predicted. The and transition temperatures of 680 and 940 K are close to previous Debye-Grüneisen values (610 and 943 K, respectively) Trubitsin . Detailed understanding of the phase diagram please see Ref. Trubitsin .
IV CONCLUSION
In summary, structure, phase transition, elasticity, phonon, and thermodynamics of the equiatomic TiZr alloy have been studied by means of the first-principles DFT-PBE method. The calculated lattice parameters and equations of state for and phases are in good agreement with experiments. We have found that the phase is most stable at 0 GPa and the transition was calculated to occur at around 33.9 GPa. The elastic constants of phase TiZr alloy at =0 GPa coincide well with previous calculations. Mechanical stability of and phases were predicted and the phase is mechanically unstable at zero pressure. Our elastic constants indicate that the phase will become mechanically stable upon compression. Under pressure, both bulk modulus B and shear modulus G increase near linearly for all three phases. Increasing behaviors of elastic wave velocities and Debye temperature under pressure have also been predicted. It was found that elastic wave velocities and Debye temperature increase first (at to transition) and decrease later (at to transition) abruptly upon compression. The Mulliken population analysis showed that either sp electrons of Ti atom or spd electrons of Zr atom transfer to the Ti-d orbital with increasing pressure.
In phonon dispersion study, the dynamic stable nature for and phases are observed. The unstable modes of phase TiZr alloy along [001] and [111] directions have been shown and these imaginary vibration branches are different from elemental Ti and Zr. Based on phonon calculations and also the Debye model, thermodynamic properties of Gibbs free energy, entropy, and specific heat at constant volume as well as the phase diagram for TiZr alloy have been presented.
Acknowledgements.
We thank Yu Yang for useful discussion. This work was supported by NSFC under Grant Nos. 11104170, 51071032, and 11074155, the Foundations for Development of Science and Technology of China Academy of Engineering Physics under Grant No. 2009B0301037.References
- (1) H. Ikehata, N. Nagasako, T. Furuta, A. Fukumoto, K. Miwa, T. Saito, Phys. Rev. B 70 (2004) 174113.
- (2) W. Liu, B. Li, L. Wang, J. Zhang, Y. Zhao, Phys. Rev. B 76 (2007) 144107.
- (3) M.T. Pérez-Prado, A.P. Zhilyaev, Phys. Rev. Lett. 102 (2009) 175504.
- (4) Y.K. Vohra, P.T. Spencer, Phys. Rev. Lett. 86 (2001) 3068.
- (5) T.R.G. Kutty, K. Ravi, C. Ganguly, J. Nucl. Mater. 265 (1999) 91.
- (6) J.C. Duthie, D.G. Pettifor, Phys. Rev. Lett. 38 (1977) 564.
- (7) H.L. Skriver, Phys. Rev. B 31 (1985) 1909.
- (8) V.A. Zilbershtein, N.P. Chistotina, A.A. Zharov, N.S. Grishina, E.I. Estrin, Fiz. Met. Metalloved. 39 (1975) 445.
- (9) S.K. Sikka, Y.K. Vohra, R. Chidambaram, Prog. Mater. Sci. 27 (1982) 245.
- (10) H. Xia, S.J. Duclos, A.L. Ruoff, Y.K. Vohra, Phys. Rev. Lett. 64 (1990) 204.
- (11) Y. Zhao, J. Zhang, C. Pantea, J. Qian, L.L. Daemen, P.A. Rigg, R.S. Hixson, G.T. Gray, Y. Yang, L. Wang, Y. Wang, T. Uchida, Phys. Rev. B 71 (2005) 184119.
- (12) H. Xia, A.L. Ruoff, Y.K. Vohra, Phys. Rev. B 44 (1991) 10374.
- (13) Y. Akahama, M. Kobayashi, H. Kawamura, J. Phys. Soc. Jpn. 59 (1990) 3843.
- (14) Y. Akahama, M. Kobayashi, H. Kawamura, J. Phys. Soc. Jpn. 60 (1991) 3211.
- (15) Y.S. Zhao, J.Z. Zhang, Appl. Phys. Lett. 91 (2007) 201907.
- (16) B.T. Wang, P. Zhang, H.Y. Liu, W.D. Li, P. Zhang, J. Appl. Phys. 109 (2011) 063514.
- (17) Y.J. Hao, L. Zhang, X.R. Chen, L.C. Cai, Q. Wu, D. Alfè, Phys. Rev. B 78 (2008) 134101.
- (18) I. Schnell, R.C. Albers, J. Phys.: Condens. Matter 18 (2006) 1483.
- (19) R. Ahuja, J.M. Wills, B. Johansson, O. Eriksson, Phys. Rev. B 48 (1993) 16269.
- (20) Y. Akahama, H. Kawamura, T. LeBihan, Phys. Rev. Lett. 87 (2001) 275503.
- (21) D. Errandonea, Y. Meng, M. Somayazulu, D. Häusermann, Physica B 355 (2005) 116.
- (22) Z.G. Mei, S.L. Shang, Y. Wang, Z.K. Liu, Phys. Rev. B 79 (2009) 134102.
- (23) A.K. Verma, P. Modak, R.S. Rao, B.K. Godwal, R. Jeanloz, Phys. Rev. B 75 (2007) 014109.
- (24) I.O. Bashkin, A.Yu. Pagnuev, A.F. Gurov, V.K. Fedotov, G.E. Abrosimova, E.G. Ponyatovskii, Phys. Solid State 42 (2000) 170.
- (25) I.O. Bashkin, V.G. Tissen, M.V. Nefedova, A. Schiwek, W.B. Holzapfel, E.G. Ponyatovsky, JETP Lett. 73 (2001) 80.
- (26) I.O. Bashkin, V.K. Fedotov, M.V. Nefedova, V.G. Tissen, E.G. Ponyatovsky, A. Schiwek, W.B. Holzapfel, Phys. Rev. B 68 (2003) 054401.
- (27) V.V. Aksenenkov, V.D. Blank, B.A. Kulnitskiy, E.I. Estrin, Phys. Met. Metalloved. 69 (1990) 154.
- (28) V.P. Dmitriev, L. Dubrovinsky, T. Le Bihan, A. Kuznetsov, H.P. Weber, E.G. Poniatovksy, Phys. Rev. B 73 (2006) 094114.
- (29) V.Yu. Trubitsin, E.B. Dolgusheva, J. Phys.: Condens. Matter 22 (2010) 465401; Phys. Solid State 53 (2) (2011) 223.
- (30) P.E. Blöchl, Phys. Rev. B 50 (1994) 17953.
- (31) G. Kresse, J. Furthmüller, Phys. Rev. B 54 (1996) 11169.
- (32) J.P. Perdew, K. Burke, M. Ernzerhof, Phys. Rev. Lett. 77 (1996) 3865.
- (33) H.J. Monkhorst, J.D. Pack, Phys. Rev. B 13 (1972) 5188.
- (34) F. Birch, Phys. Rev. 71 (1947) 809.
- (35) G. Jomard, L. Magaud, A. Pasturel, Phil. Mag. 77 (1998) 67.
- (36) A. Landa, P. Söderlind, P. E. A. Turchi, J. Alloys Compd. 478 (2009) 103.
- (37) S.A. Ostanin, V. Yu. Trubitsin, Phys. Stat. Sol. (b) 201 (1997) R9; Phys. Rev. B 57 (1998) 13485.
- (38) F. Jona, P. M. Marcus, J. Phys.: Condens. Matter 15 (2003) 5009.
- (39) F. Jona, P.M. Markus, Phys. Stat. Sol. (b) 242 (2005) 3077.
- (40) G.B. Grad, P. Blaha, J. Luitz, K. Schwarz, A. Fernández Guillermet, S.J. Sferco, Phys. Rev. B 62 (2000) 12743.
- (41) C.W. Greef, Modelling Simul. Mater. Sci. Eng. 13 (2005) 1015.
- (42) Z.G. Mei, S.L. Shang, Y. Wang, Z.K. Liu, Phys. Rev. B 80 (2009) 104116.
- (43) Q.M. Hu, S. Lu, R. Yang, Phys. Rev. B 78 (2008) 052102.
- (44) R. Hill, Phys. Phys. Soc. London 65, 349 (1952).
- (45) S. F. Pugh, Phil. Mag. 45 (1954) 823.
- (46) W. Liu, B. Li, L. Wang, J. Zhang, Y. Zhao, J. Appl. Phys. 104 (2008) 076102.
- (47) R.S. Mulliken, J. Chem. Phys. 23 (1955) 1833.
- (48) S. Zhang, Y. Zhu, X. Zhang, S. Zhang, L. Qi, R. Liu, Comp. Mater. Sci. 50 (2010) 179.
- (49) P. Souvatzis, O. Eriksson, M. I. Katsnelson, and S. P. Rudin, Phys. Rev. Lett. 100, 095901 (2008).
- (50) A. Heiming, W. Petry, J. Trampenau, M. Alba, C. Herzig, H. R. Schober, and G. Vogl, Phys. Rev. B 43, 10948 (1991).
- (51) K. Parlinski, Z-.Q. Li, and Y. Kawazoe, Phys. Rev. Lett. 78, 4063 (1997).
- (52) A. Togo, F. Oba, and I. Tanaka, Phys. Rev. B 78 (2008) 134106.
- (53) A. Siegel, K. Parlinski, and U. D. Wdowik, Phys. Rev. B 74, 104116 (2006).
- (54) P. Zhang, B.-T. Wang, and X.-G. Zhao, Phys. Rev. B 82, 144110 (2010).
- (55) A. A. Blanco, E. Francisco, and V. Luana, Comput. Phys. Commun. 158 (2004) 57.