Obscured Starburst Activity in High Redshift Clusters and Groups
Abstract
Using Spitzer-MIPS m imaging and extensive Keck spectroscopy we examine the nature of the obscured star forming population in three clusters and three groups at . These six systems are the primary components of the Cl1604 supercluster, the largest structure imaged by Spitzer at redshifts approaching unity. We find that the average density of m-detected galaxies within the Cl1604 clusters is nearly twice that of the surrounding field and that this overdensity scales with the cluster’s dynamical state. The m-bright members often appear optically unremarkable and exhibit only moderate [OII] line emission due to severe obscuration. Their spatial distribution suggests they are an infalling population, but an examination of their spectral properties, morphologies and optical colors indicate they are not simply analogs of the field population that have yet to be quenched. Using stacked composite spectra, we find the m-detected cluster and group galaxies exhibit elevated levels of Balmer absorption compared to galaxies undergoing normal, continuous star formation. A similar excess is not observed in field galaxies with equivalent infrared luminosities, indicating a greater fraction of the detected cluster and group members have experienced a burst of star formation in the recent past compared to their counterparts in the field. Our results suggest that gas-rich galaxies at high redshift experience a temporary increase in their star formation activity as they assemble into denser environments. Using HST-ACS imaging we find that disturbed morphologies are common among the 24m-detected cluster and group members and become more prevalent in regions of higher galaxy density. We conclude that mergers are the dominant triggering mechanism responsible for the enhanced star formation found in the Cl1604 groups, while a mix of harassment and mergers are likely driving the activity of the cluster galaxies.
Subject headings:
galaxies: starburst — galaxies: clusters: general — galaxies: evolution1. Introduction
It is well established that in the local Universe dense environments such as galaxy clusters are generally hostile to star formation as they predominantly contain passively evolving, early-type galaxies. At higher redshifts, though, there is increasing evidence that star formation is far more ubiquitous in such environments. Among the earliest indications was the detection of an increased fraction of blue, late-type galaxies in moderate-redshift clusters, otherwise known as the Butcher-Oemler effect (Butcher & Oemler 1978, 1984; Dressler et al. 1997). More recent observations have revealed this increase to be part of an overall evolution in the morphology-density relationship such that spirals are more common in dense environments at higher redshifts than they are locally, largely at the expense of the S0 population (Postman et al. 2005). In conjunction with this morphological evolution, spectroscopic studies have revealed a large population of post-starburst galaxies in distant clusters that are largely absent at lower redshifts (Dressler & Gunn 1983; Dressler et al. 1999; Poggianti et al. 1999).
These post-starburst systems, also known as k+a galaxies, exhibit Balmer absorption features due to the presence of recently formed (1 Gyr) A-type stars, but lack emission lines that are indicative of ongoing star formation, such as the [OII] doublet at 3727Å. While such features can be produced by the truncation of normal star formation, it has been shown that spectra with strong Balmer absorption lines require a burst of star formation prior to a rapid quenching (Poggianti 2004). The existence of a large population of such systems suggest that galaxies in higher-redshift clusters experience a period of increased star formation activity that is not observed in their low redshift counterparts.
Until recently, efforts to study starburst galaxies within clusters have proven difficult because surveys in the UV and optical failed to detect the starbursting progenitors of the post-starburst population found by Dressler et al. (1999) (e.g. Balogh et al. 1997). It is now well appreciated that dust can heavily obscure such systems (Silva et al. 1998) resulting in severely underestimated star formation rates (SFR) when relying solely on optical line diagnostics (Kennicutt 1998, Kewley et al. 2004). Infrared (IR) observations, on the other hand, are sensitive to stellar radiation reprocessed by dust and therefore provide a means to penetrate this obscuration.
| RA | Dec | ||||||
|---|---|---|---|---|---|---|---|
| ID | Name | (J2000) | (J2000) | (km s-1) | arcmin / ( Mpc) | () | |
| A | Cl1604+4304 | 241.097473 | 43.081150 | 0.898 | 1.969 / 0.92 | 40 | |
| B | Cl1604+4314 | 241.105050 | 43.239611 | 0.865 | 2.261 / 1.05 | 62 | |
| C | Cl1604+4316 | 241.031623 | 43.263130 | 0.935 | 0.824 / 0.39 | 13 | |
| D | Cl1604+4321 | 241.138651 | 43.353430 | 0.923 | 1.594 / 0.75 | 60 | |
| F | Cl1605+4322 | 241.213137 | 43.370908 | 0.936 | 1.470 / 0.70 | 16 | |
| G | Cl1604+4324 | 240.925080 | 43.401718 | 0.901 | 1.143 / 0.53 | 15 |
Early mid-IR studies of galaxy clusters carried out at 15 m with ISOCAM on the Infrared Space Telescope succeeded in detecting a substantial population of IR-luminous and presumably starbursting systems in several clusters out to (see Metcalfe et al. 2005 for a review). More recently, observations at m with the Multiband Imaging Photometer (MIPS) onboard the Spitzer Space Telescope have allowed for detailed studies of star forming galaxies within clusters out to . Several studies have now detected a population of Luminous Infrared Galaxies (LIRGs; ) with unremarkable optical spectra in several distant clusters (Geach et al. 2006; Marcillac et al. 2007; Dressler et al. 2009). These galaxies often show strong Balmer absorption and little or no [OII] emission due to severe dust obscuration and were previously identified as possible buried starbursts by Poggianti et al. (1999) and Dressler et al. (2004).
Despite the identification of this population, the reasons for their increased activity and the mechanisms that may trigger it remain unclear. Since clusters in the early Universe have had less time to dynamically relax, these galaxies may simply be recently accreted field galaxies whose LIRG-level activity has yet to be quenched by the cluster environment. Indeed LIRGs are far more prevalent in the field at than they are locally (Perez-Gonzalez et al. 2005). On the other hand, this activity may be triggered by the physical stresses galaxies experience as they assemble into denser environments. Several mechanisms have been proposed which may prompt starburst activity during cluster infall, including increased galaxy mergers as a result of group compression (Barnes & Hernquist 1991, Struck 2006), tidal interactions (Moore et al. 1996), initial interactions between galaxies and the intracluster medium (ICM; Evrard 1991), and the effects of a varying tidal field (Bekki 1999).
Thus far the study of several individual clusters have produced mixed results regarding the nature of the IR-luminous cluster population. On one hand, multiple studies have found evidence for enhanced star formation in galaxies as they approach the cluster environment for the first time. For example, Geach et al. (2006) detected a sizable population of LIRGs on the outskirts of two clusters and found evidence that the level of obscured activity in each cluster is tied to the system’s dynamical state. In addition, Marcillac et al. (2007) determined that the LIRGs detected in RXJ0152.7-1357 at are associated with infalling galaxies, while Fadda et al. (2008) reached the same conclusion after detecting a starburst population in a filament feeding Abell 1787. On the other hand, Bai et al. (2007) and Oemler et al. (2009) find evidence of triggered activity in galaxies that have recently passed through the center of MS1054 and Abell 851, respectively. The role of galaxy interactions has also been debated, with Oemler et al. (2009) proposing that the merger of bound galaxy pairs as they fall into the cluster core may lead to elevated star formation, while Marcillac et al. (2007) and Bai et al. (2007) find only mild evidence of merger driven activity in RXJ0152.7-1357 and MS1054.
If cluster-related processes play a role in triggering enhanced star formation during cluster assembly, we can better constrain the mechanisms responsible by studying starburst galaxies in clusters with a range of dynamical states, levels of substructure and ICM densities. To this end, we have used m MIPS observations to identify and examine the starburst population of six clusters and groups in the Cl1604 supercluster at . The Cl1604 complex is the largest structure imaged by Spitzer at redshifts approaching unity and its constituent systems are in varying stages of cluster formation and relaxation. These systems provide both a large sample of m-detected galaxies and a diverse set of structures and local environments in which to study them.
In the following sections we make use of an extensive multiwavelength dataset to examine the spatial distribution, IR properties, morphologies and optical spectra of the m-detected galaxies in these systems in an effort to constrain the mechanisms that may have prompted their increased activity. We also perform a detailed comparison between the physical properties of these galaxies and those in lower density environments with similar IR luminosities to determine if they are simply recently accreted field galaxies. We will show that while the m-bright cluster members appear to be an infalling population, they are generally experiencing burstier star formation activity than their counterparts in the field. Furthermore, differences in their morphologies and optical colors preclude them from simply being analogs of the IR-bright field population that have yet to be quenched.
We have organized this paper in the following manner: in §2 we describe the Cl1604 supercluster in greater detail, §3 discusses our multi-wavelength observations of the system, and §4 outlines the details of our sample selection and the method used to determine cluster membership within the supercluster. We then examine various properties of the m-detected population. We discuss their spatial distribution in §5, spectral properties and star formation activity in §6, their morphologies in §7 and their optical colors in §8. We summarize our findings and their implications in §9 and our conclusions are presented in §10.
2. The Cl1604 Supercluster
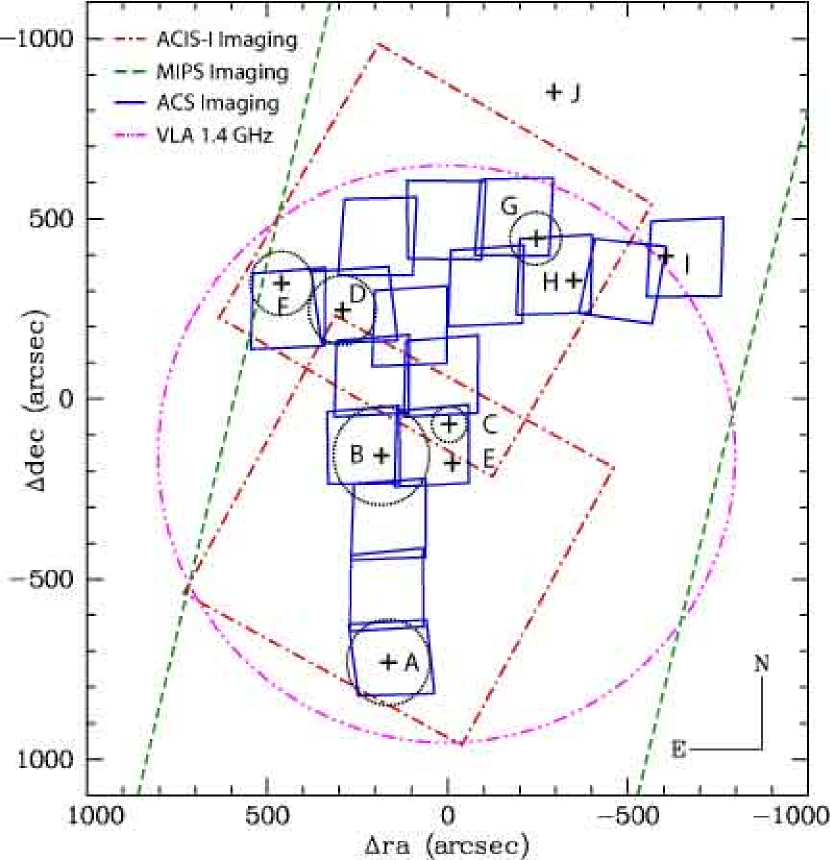
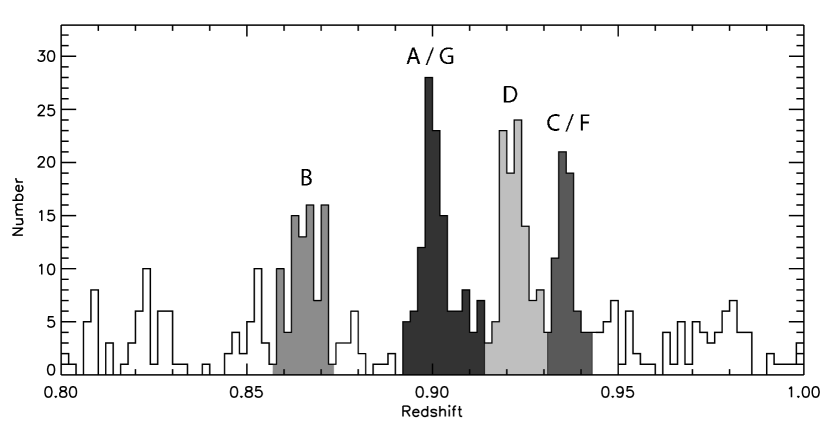
The Cl1604 supercluster is a high redshift, large-scale structure which consists of eight spectroscopically confirmed galaxy clusters and groups, as well as a rich network of filamentary structures. The system spans roughly 10 Mpc on the sky and 100 Mpc in depth, with a median redshift of (Gal & Lubin 2004). The velocity dispersions of the system’s constituent structures range from 300 km s-1 to nearly 800 km s-1 (Gal et al. 2005, 2008) and diffuse emission from the two most massive clusters in the complex has been detected in our X-ray observations of the field (Kocevski et al. 2009a). The spatial distribution of the system’s eight clusters and groups are shown in Figure 1 and the system’s redshift distribution is shown in Figure 2.
In this study we focus on the six best studied clusters and groups in the complex: Cl1604+4304, Cl1604+4314, Cl1604+4321, Cl1604+4316, Cl1605+4322, and Cl1604+4324 (hereafter referred to as clusters A, B, and D and groups C, F, and G, respectively). Various properties of these systems, including redshifts, velocity dispersions, virial radii, and the number of spectroscopically confirmed member galaxies, are listed in Table 1.
Of these systems, cluster A is both the most massive and most relaxed structure in the complex. It has a measured velocity dispersion of 703 km s-1 (Gal et al. 2008) and its ICM is X-ray detected with a bolometric luminosity of erg s-1 (extrapolated to assuming a beta model with ; Kocevski et al. 2009a). The cluster shows no signs of significant substructure and Gal et al. (2008) found no evidence of velocity segregation in its redshift distribution. Cluster B is also X-ray detected with a luminosity slightly lower than that of cluster A ( erg s-1), but the system has a higher measured velocity dispersion (783 km s-1). Kocevski et al. (2009a) found that the cluster departed from the relationship and concluded the system is not fully relaxed. Cluster D has the third highest velocity dispersion in the supercluster (582 km s-1), but is not X-ray detected despite being relatively rich. Gal et al. (2008) found significant levels of velocity segregation in the cluster’s redshift distribution, as well as an elongation of its member galaxies that has been interpreted to be a galaxy filament feeding the cluster. The filament extends out over 2 Mpc from the cluster center. The system is the most dynamically active in the supercluster and is likely in the process of accreting a substantial fraction of its future galaxy population. Finally, groups C, F, and G are poorer systems that are not directly detected in our X-ray observations. Their velocity dispersions range from 304 to 543 km s-1, consistent with rich groups, and each has at least a dozen spectroscopically confirmed member galaxies.
The supercluster has been extensively studied at a variety of wavelengths and thus far over 1400 redshifts have been collected in the region, resulting in spectra for 414 supercluster members (see §3.3). The complex structure of the supercluster, as mapped by our spectroscopic observations, is described in Gal et al. (2008), our X-ray observations of the system are discussed in Kocevski et al. (2009a), and our 20-cm observations of the structure are described in Lubin et al. (2010, in preparation).
3. Observations and Data Reduction
3.1. IRAC and MIPS Imaging
The entire Cl1604 supercluster was imaged at 3.6-8m by IRAC and at 24m by MIPS as part of the Spitzer program GO-30455 (PI Lubin). The area imaged by MIPS covers a region in size and was observed in slow-scan mode with 8 scan legs and half-array () cross-scan steps. We repeated this pattern six times to obtain a total exposure time of 1200 seconds per pixel for all but the very edges of the resulting mosaic. The IRAC observations cover a subset of this area and consist of a grid of pointings with separations. At each pointing we performed 36 medium-dithered, 30 second exposures, resulting in a total exposure time of 1080 seconds per pixel throughout.
The MIPS and IRAC data were processed using the standard Spitzer Science Center (SSC) reduction pipeline into individual Basic Calibrated Data images. The IRAC images were further processed using a modified version of the SWIRE survey pipeline (Surace et al. 2005) to remove various instrumental artifacts. The resulting images were then coadded using the MOPEX software and the final IRAC and MIPS mosaics have pixels scales of 06 pixel-1 and 12 pixel-1, respectively
Object detection on the IRAC imaging was carried out using SExtractor primarily on the 3.6m mosaic, but also on the 4.5 mosaic where the two do not overlap. Sources were selected if they had more than five contiguous pixels above of the background fluctuations. Aperture photometry was carried out in all four IRAC bands using dual-image mode in SExtractor with a fixed 1.9′′ aperture. We applied an aperture correction of 1.2 to account for the flux outside our measurement aperture.
Source detection in the 24m mosaic was performed following the methodology of the COSMOS survey described in Le Floch et al. (2009). Briefly, we use SExtractor to detect all sources at a significance of over an area of at least three pixels. These positions are then used as input to the DAOPHOT package (Stetson 1987) implemented within IRAF (Tody 1986). Bright, isolated sources are used to construct a single empirical point spread function (PSF) for the entire mosaic. Using DAOPHOT, PSF fitting photometry is performed at each detected source position and the flux enclosed within a 6′′ aperture is computed. We then subtract the best-fit, scaled PSFs from the original mosaic, and a second iteration of SExtractor and DAOPHOT is run to detect and characterize any remaining sources. The catalog from this second pass is joined with the original catalog to produce the final source catalog. Finally, we apply an aperture correction of 1.69. With an exposure time of 1200 seconds and a moderate background level of 22.7 MJy/ster, we find our 3 point source sensitivity to be roughly 40Jy, which is in good agreement with estimates from the SSC’s SENS-PET online tool.
3.2. Optical Imaging
The optical imaging of the supercluster used in this study consists of 17 pointings of the Advanced Camera for Surveys (ACS) on the Hubble Space Telescope (HST). The ACS camera consists of two CCDs with a pixel scale of 005 pixel-1, resulting in a FOV. The 17 pointing mosaic was designed to image nine of the ten galaxy density peaks observed in the field of the supercluster by Gal et al. (2005, 2008). Observations were taken in both the F606W and F814W bands and consist of 15 pointings from GO-11003 (PI Lubin) with effective exposure times of 1998 sec111With the exception of one pointing which lost guiding due to an incorrect attitude, resulting in a usable exposure time of 1505 sec and a gap in the mosaic. and 2 GTO pointings from G0-9919 (PI Ford) centered on clusters A and D with effective exposure time of 4840 sec. Our average integration time of 1998 sec resulted in completeness depths of mag in each band.
The ACS data were reduced using the pipeline developed by the HST Archive Galaxy Gravitational Lens Survey (HAGGLES) team. The pipeline processing consists of calibrating the raw data using the best reference files provided by the Hubble Space Telescope archive, subtracting the background on each chip, iteratively determining the best shifts between the dithered exposures using multiple calls to SExtractor (Bertin & Arnouts 1996) and multidrizzle (Koekemoer et al. 2002), aligning the final drizzled image to the USNO-B1 catalog (Monet et al. 2002) and resampling the images to a pixel scale of 0.03′′ pixel-1. Object detection and photometry was carried out using SExtractor in dual-image mode, with the detection image being a weighted average of the F606W and F814W images. Detection parameters DETECT_MINAREA and DETECT_THRESH were set to three pixels above , while the deblending parameters DEBLEND_NTHRESH and DEBLEND_MINCONT were set to 32 and 0.03, respectively. An outline of the region covered by the ACS mosaic relative to the MIPS observations is shown in Figure 1. Full details of the HAGGLES pipeline can be found in Marshall et al. (2010, in preparation).
3.3. Optical Spectroscopy
The Cl1604 supercluster has been extensively mapped using the Low-Resolution Imaging Spectrograph (LRIS; Oke et al. 1995) and the Deep Imaging Multi-object Spectrograph (DEIMOS; Faber et al. 2003) on the Keck 10-m telescopes (Oke, Postman, & Lubin 1998; Postman, Lubin, & Oke 1998; Lubin et al. 1998; Gal & Lubin 2004; Gal et al. 2008). The target selection, spectral reduction, and redshift measurements are described in detail in Section 3 of Gal et al. (2008). The resulting DEIMOS spectra have a resolution of (68 km s-1) and typical spectral coverage from to , while the LRIS resolution is (330 km s-1) with spectral coverage from to .
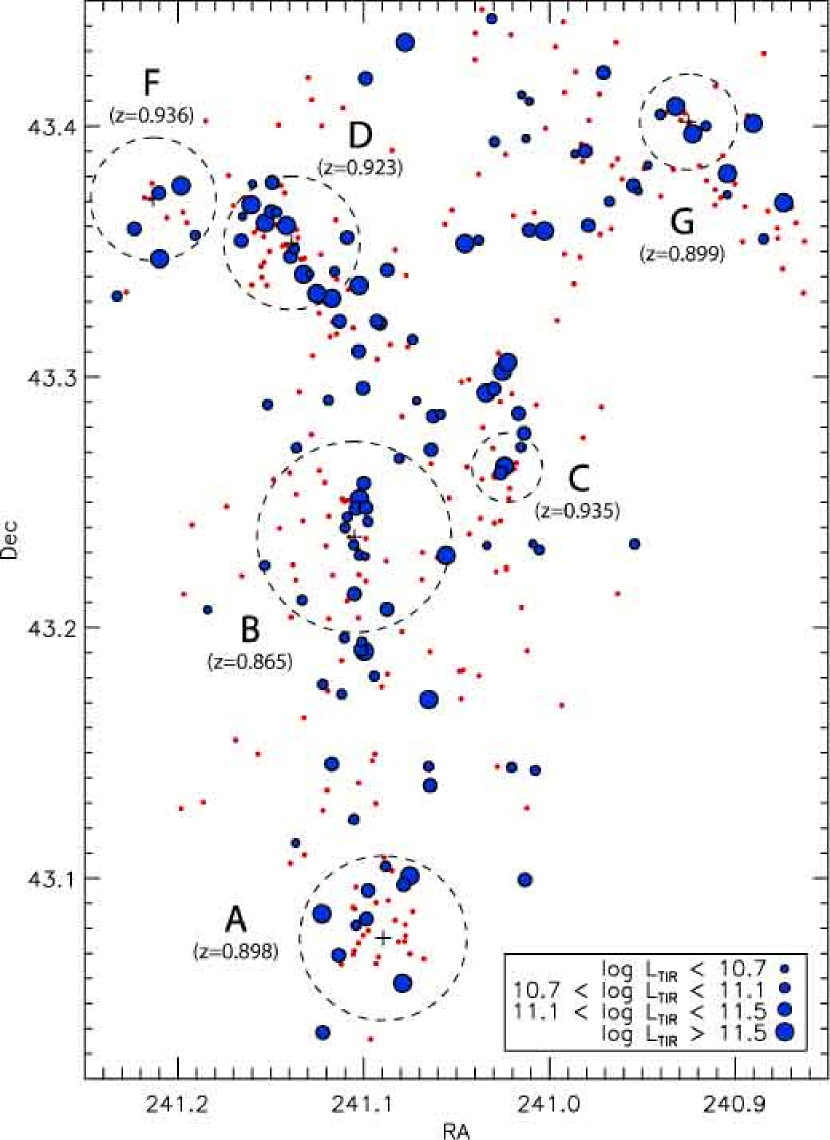
Our final spectroscopic catalog contains 1,638 unique objects. Redshifts derived for these objects are given a spectroscopic quality, , between 1 and 4, where 1 indicates that a secure redshift could not be determined, 2 is a redshift obtained from a single feature, 3 is a redshift derived from at least one secure and one marginal feature, and 4 is assigned to spectra with redshifts obtained from several high signal-to-noise features. is used for sources securely identified as stars. In this sample, we find 140 stars and 1,138 extragalactic objects with . A total of 414 galaxies are in the nominal redshift range of the supercluster, . The spatial distribution of these galaxies is shown in Figure 3.
In addition to redshifts, we also use our optical spectra to measure the equivalent widths (EW) of the [OII] and H features for spectral classifications and to calculate SFRs from the [OII] line luminosity. Due to the relatively low S/N of a single DEIMOS spectrum, bandpass techniques are used for the EW measurements of individual galaxies. For consistency, we also adopt bandpass techniques to measure the absolute luminosity of the [OII] emission line, making no corrections for the internal extinction of each galaxy. Measurements are made adopting the standard bandpasses of Fisher et al. (1998) and calculated using the methodology described in Lemaux et al. (2010). For flux measurements, absolute spectrophotometric calibration is achieved by using the methods described in Lemaux et al. (2010), adopting slit throughput of for all supercluster members. Star formation rates are derived from [OII] line luminosities following the prescription of Kennicutt (1998).
4. Identifying Supercluster Starbursts
In order to find optical counterparts and assign redshifts to the 24m sources in the Cl1604 field, we performed a cross-correlation between our ACS and MIPS selected samples using a nearest neighbor matching. Employing a match radius of , we found 283 MIPS sources matched to galaxies with redshifts. Of these, 126 have redshifts between and fall within the boundaries of the supercluster. The location of these galaxies within the supercluster is shown in Figure 3. Using the average surface density of 24m sources with Jy (measured throughout the supercluster) and a match radius of , we calculate a spurious match probability of 1.3% from the P-statistic (Lilly et al. 1999). We therefore expect 2 of 126 matches between a supercluster member and a 24m source to be spurious.
4.1. Determining Cluster Membership
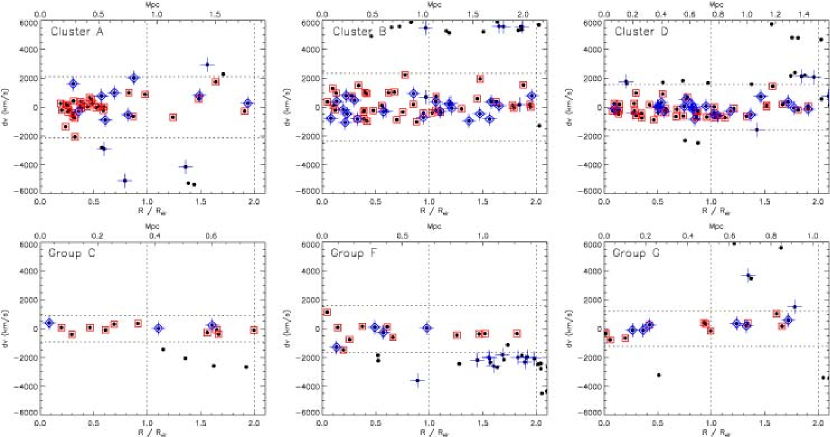
To determine the host cluster or group of each 24m-detected galaxy within the complex structure of the supercluster, we use the galaxy’s position and velocity offset relative to the systemic position and redshift of each cluster/group. Creating cluster and group specific subsamples in this manner will allow us to examine the large-scale environments of the starburst population in terms of the properties of their host systems. We consider a galaxy associated to a specific cluster or group if i.) its comoving velocity relative to the median cluster/group redshift is less than three times the system’s velocity dispersion, , and ii.) it is located within two projected virial radii, , of the cluster/group center. This latter constraint is motivated not only by a desire to sample a full range of environments around each system, but also due to a large population of infalling galaxies observed near multiple Cl1604 clusters that extend beyond ; this is discussed further below.
We determined for each cluster and group using the system’s measured and the relation (Biviano et al. 2006; Poggianti et al. 2009), where is the radius at which the density of the cluster is 200 times that of the critical density of the Universe. We measured for each system using an iterative clipping procedure that is described in detail in Gal et al. (2008), while was in turn calculated using the equation
| (1) |
The derived values of and for the Cl1604 clusters and groups are listed in Table 1.
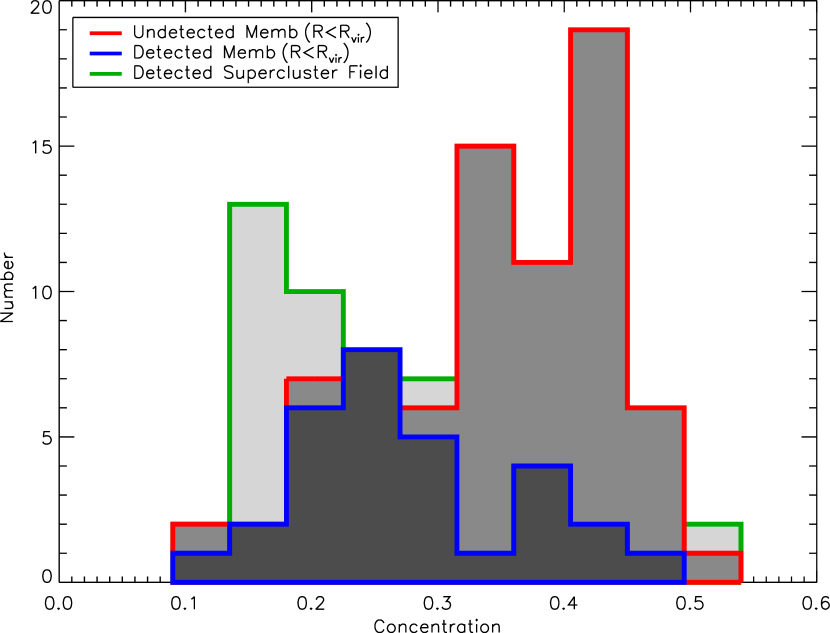
The result of applying the two conditions and for both 24m-detected and undetected galaxies near clusters A, B, and D and groups C, F, and G are shown on the top and bottom panels of Figure 4, respectively. The differing dynamical states of these clusters is readily apparent. In the case of the relaxed cluster A, a large majority of the system’s spectroscopically confirmed members fall within , while in the dynamically unrelaxed clusters B and D, a substantial population are found at greater radii. We interpret this as evidence that both systems are actively accreting a considerable fraction of their galaxy populations.
Using the above selection criteria, we have associated a total of 71 of the 126 24m detected supercluster members with a specific cluster or group in the Cl1604 complex. The remaining galaxies that fall within the redshift boundaries of the supercluster are found in loose groups, filamentary or sheet-like structures near these systems. For the remainder of the paper, we will refer to galaxies associated with clusters A, B, and D as cluster members and those associated with groups C, F, and G as group members, while the remaining galaxies will be referred to as the supercluster field sample (or simply the superfield population for short).
4.2. Total IR Luminosity & SFRs
To determine the level of obscured activity occurring in each 24m source with a measured redshift, we calculate the galaxy’s total IR luminosity (; 8-1000 m) from its monochromatic 24m flux density using the recipe of Chary & Elbaz (2001) and the synthetic spectra of Chary & Elbaz (2001) and Dale & Helou (2002). These spectral templates model the 8-1000 m spectral energy distribution (SEDs) of galaxies with a wide range of IR luminosities and by determining which template best reproduces the 24m flux of a given galaxy at a given redshift, we can establish the galaxy’s . This was done for each galaxy by redshifting the templates to the galaxy redshift, converting them from luminosity to flux per unit wavelength, and convolving the SED with the MIPS 24m response curve. The template that best reproduced the 24m flux of the galaxy was then normalized to this flux and integrated to obtain .
We used the derived values to obtain the level of star formation occurring in each galaxy by way of the -SFR relation from Kennicutt (1998):
| (2) |
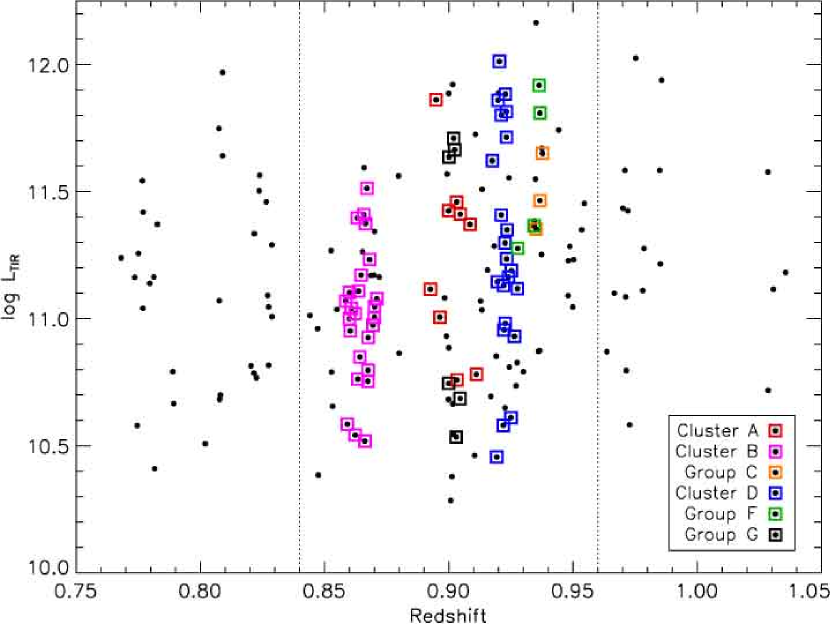
The distribution of as a function of redshift for supercluster members is shown in Figure 5. Our flux limit of 40 Jy corresponds to a luminosity of at , the median redshift of the supercluster. This luminosity in turn corresponds to a SFR of 5.2 M⊙ yr-1. Therefore our MIPS observations allow us to sample the luminous end of the IR normal ( ), LIRG ( ), and Ultra LIRG (ULIRG; ) populations in the Cl1604 systems. Only two supercluster members have luminosities consistent with ULIRGs, while the majority (64.3%) have LIRG-like luminosities. The remaining 34.1% fall in the IR normal regime. For simplicity we will often refer to galaxies in all three luminosity classes collectively as the starburst population. In §6 we justify this by demonstrating that a significant fraction of these galaxies are experiencing bursty episodes of star formation activity, especially those within the cluster and group environments.
4.3. AGN Contamination
The mid-IR flux of galaxies can originate from both obscured star formation and the reprocessing of AGN related emission by dust. In this section we discuss the identification of galaxies whose mid-IR flux is dominated by the latter in order to exclude them from any analysis of the supercluster’s starburst population. To do this, we have fit starburst and AGN spectral templates to our ground-based optical, IRAC and MIPS photometry using the Hyperz photometric redshift software (Bolzonella et al. 2000). The templates we use for these fits are a subset of the SWIRE template library (e.g. Polletta et al. 2007) and include five spiral (S0, Sa-Sd), three starburst and four AGN templates. The starburst SEDs are those of NGC 6090, M82 and Arp200, while the AGN templates are a combination of models, broadband photometry and composite spectra of local AGN and correspond to Seyfert 1.8, Seyfert 2, QSO1 and QSO2 SEDs. We adopt a Calzetti reddening prescription (Calzetti et al. 2000) with up to a magnitude of optical extinction to account for heavily obscured sources.
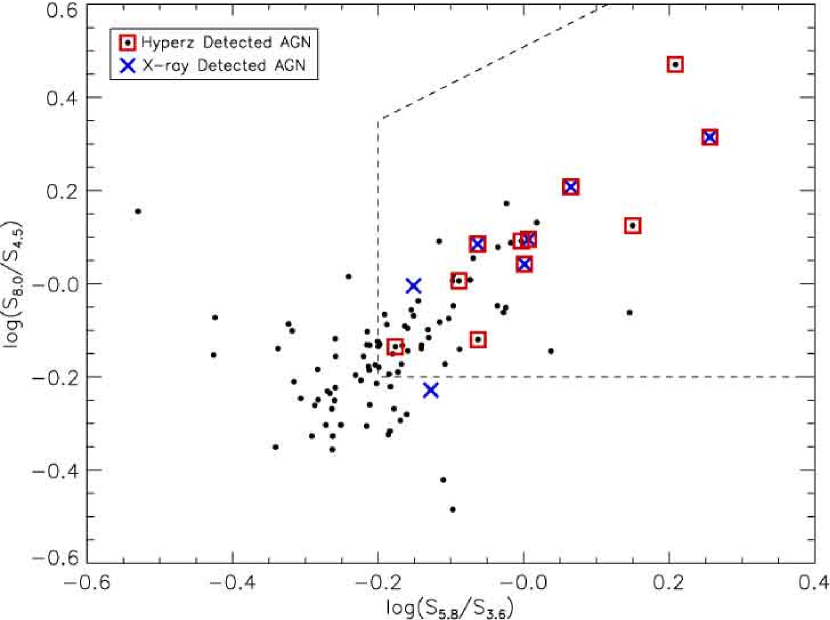
We carried out the Hyperz SEDs fitting on 98 supercluster members detected at 24m and all four IRAC bands (out of a total 126 detected at 24m). Of this sample, three were best fit by QSO SEDs and another eight were well matched to Seyfert SEDs. The location of these galaxies in IRAC color-color space is shown in Figure 6. All of the Hyperz selected AGN fall within the color selection wedge of Lacy et al. (2004) and they generally follow the color trend expected for sources with a negative power-law spectral slope (i.e., Donely et al. 2008). Also shown in Figure 6 are the colors of X-ray luminous AGN found in the supercluster through our Chandra observations of the system (Kocevski et al. 2009a,b). There are a total of nine X-ray detected AGN in the supercluster with Seyfert-like luminosities. Seven of these are detected at 24m and in all four IRAC bands, of which five were selected as AGN by our Hyperz fitting. The outstanding two were found to have a significant starburst component and are most likely starburst/AGN blends. In order to be conservative in our AGN selection, we have not employed hybrid starburst-AGN templates which would have selected these sources as AGN, but plan to in a future study of the obscured AGN population within the supercluster.
The final sample of AGN excluded from our analysis consists of 13 sources (five IR/X-ray selected, six IR selected, and two X-ray selected) out of 98 potential hosts, resulting in a roughly 13% contamination. An additional 28 sources were not screened using Hyperz because they lacked a detection in one or more of the IRAC bands. Given our contamination rate, we expect 4 of these galaxies to host an AGN. Since these make up less than 4% of our final sample, we do not believe their presence will significantly alter our results.
Of the 13 AGN found using Hyperz, 7 galaxies are part of our cluster/group sample, while the remaining 6 are part of the supercluster field. The only two cluster/group members with ULIRG-level luminosities are among the three galaxies best-fit by the QSO SEDs and are located near the center of Cluster D. With these AGN excluded, our final sample of 24m sources consists of 50 cluster, 13 group and 50 field galaxies. In the following sections we take a detailed look at the various properties of these galaxies.
5. Spatial Distribution
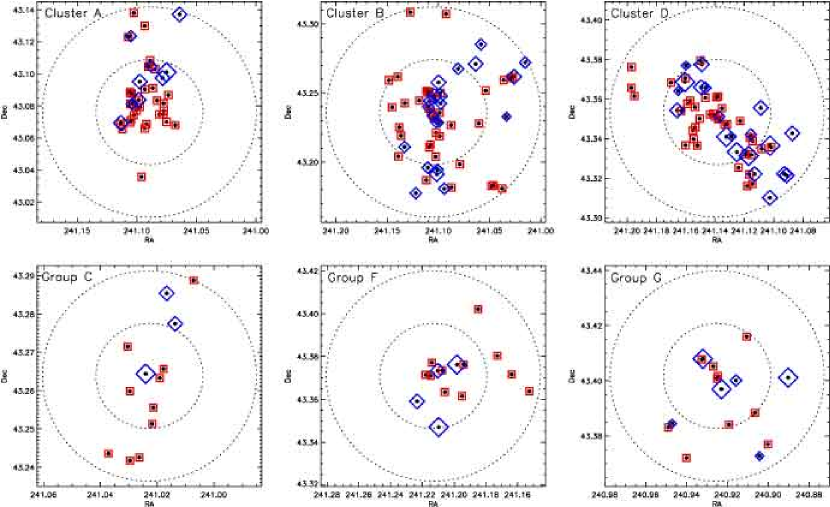
The spatial distribution of 24m-detected galaxies over the entire Cl1604 supercluster is shown Figure 3, while those associated with specific clusters and groups in the complex are shown in Figure 7. The distribution of these galaxies provides several immediate insights.
| Region | Corrected | (gal/arcmin2) | |
|---|---|---|---|
| Cluster A | 9 | 15.0 | 1.235 |
| Cluster B | 15 | 25.7 | 1.568 |
| Cluster D | 14 | 18.7 | 2.338 |
| Cl1604 Field 1 | 9 | 15.2 | |
| Cl1604 Field 2 | 13 | 26.5 | |
| Avg Cluster | 38 | 59.4 | 1.625 |
| Avg Field | 33 | 63.5 | 0.881 |
Note. — Density of sources with F814W and in the redshift range .
5.1. Increased Activity in Unrelaxed Clusters
First, we find increased activity in the dynamically unrelaxed clusters B and D relative to the more massive and relaxed cluster A. The fraction of cluster members detected at 24m in the latter is 22.5%, while in cluster B and D this increases to 36.2% and 34.5%, respectively. These increased fractions are inconsistent with the cluster A fraction at roughly the 90% level. This finding suggests that the dynamical state of these clusters is directly related to the level of dust-enshrouded star formation occurring in their member galaxies.
In the case of cluster D, the 24m-detected galaxies are preferentially located either within the filament connected to the system or aligned with its infall direction. This is one of the clearest indications from our data that enhanced star formation within these systems is associated with actively infalling or recently accreted galaxies. This finding is similar to the results of Fadda et al. (2008), who detected an overdensity of starburst galaxies in two filaments feeding Abell 1763. The authors suggest the filament environment is a favorable setting for the onset of starburst activity; a conclusion that our observations support.
We have performed an extensive test to confirm that the increased activity we find among the unrelaxed clusters is not due to variations in our spectroscopic sampling. After carefully correcting for our spectroscopic incompleteness, we find the density of 24m sources in the redshift range is significantly greater near clusters B and D relative to both cluster A and the general field population. We performed this calculation in the following manner. To correct for our spectroscopic incompleteness, we binned our spectroscopic sample of 1278 objects in observed color (F606W-F814W) and magnitude (F814W) space and calculated the ratio of galaxies confirmed to lie within to those outside this range for each color-magnitude bin. We then used these ratios to determine the probability that a given 24m source without a redshift would fall within the supercluster redshift range had it been targeted for spectroscopic observations. These probabilities are then used as weights, which are summed to estimate the number of 24m-detected members missed in any given region within the supercluster. In carrying out this analysis we chose our color and magnitude bins to be 0.5 and 1.0 magnitudes wide, respectively, in order to ensure adequate number statistics in each bin and we have adopted a magnitude limit of F814W.
With an estimate of our spectroscopic incompleteness, we chose three cluster environments ( in systems A, B, and D) and two field environments in which to compare the number density of 24m sources. The field regions have been chosen to avoid the cluster and group cores, but to remain within our ACS imaging and the regions well sampled by our spectroscopy. Although these regions will undoubtedly be denser than the nominal field well outside the Cl1604 supercluster, we have decided to compare against them as opposed to field surveys since the 24m flux limit and our spectroscopic and ACS coverage in these regions are identical to that of the cluster cores. This allows for a fairly straightforward comparison of the source densities in these different environments.
The corrected number density of 24m sources in each region, integrated over the redshift range of are listed in Table 2. We find an excess of 24m sources within the virial radius of each cluster relative to the supercluster field. In the three regions encompassing the cluster centers, the average projected density of dusty, star forming galaxies is nearly twice that of the adjacent field. This overdensity is detected with a statistical significance of just over . Furthermore, the excess of 24m-detected galaxies in each cluster appears well correlated with the system’s dynamical state. We find a nearly two-fold increase in the density of sources in the dynamically unrelaxed cluster D relative to the more relaxed cluster A. This is consistent with our earlier finding that the two dynamically disturbed clusters have a greater fraction of 24m-detected members.
It is important to note that the overdensity of 24m sources found in clusters B and D cannot simply be a result of the higher overall density of galaxies in these systems as a similar excess is not observed in cluster A. In fact, cluster A is more massive and optically richer than either of its counterparts. We would have, therefore, expected to find a greater excess in that system if the density of 24m sources simply scaled with the general galaxy population and this is not the case.
Our findings are similar to those of Geach et al. (2006), who detected a substantial population of 24m-detected galaxies in Cl0024+16 and relatively few in the more massive and relaxed cluster MS0451-03. Given that dynamically unrelaxed clusters are typically undergoing active assembly, the increased activity observed in these systems further suggests that the starburst population consists of recently accreted field galaxies whose activity is either triggered directly prior to cluster infall or by cluster-specific processes during infall.

5.2. Radial Distribution
The second insight provided by the spatial distribution of the 24m population is that they are less centrally concentrated than their undetected counterparts when summed over all of the Cl1604 clusters and groups (systems A through G). This can be seen in Figure 8, which shows the cumulative distribution of 24m-detected and undetected member galaxies as a function of cluster/group-centric distance. The distribution is shown both in terms of arcminutes to the center of each galaxy’s host system and distances normalized to each system’s . Employing a KS test on the normalized distribution, we calculate only a 14.3% probability that the 24m detected sample is drawn from the same parent distribution as the undetected population222This decreases to 7.9% if we do not normalize the cluster-centric distances.. When we split the 24m sample into cluster (A, B, and D) and group (C, F, and G) subsamples, we find that this result is largely driven by the cluster population. This can be seen in Figure 9, which shows the same cumulative distribution, but for the cluster and group subsamples separately. While the 24m cluster members are less centrally concentrated than the undetected cluster members, this is not the case with the group population. A KS test on each distribution separately confirms this dichotomy. We find an 87.4% chance that the 24m group members are drawn from the same distribution as the undetected group members and only a 3.5% probability of this being true for the 24m cluster population. Undoubtedly the radial distribution of the cluster members is heavily influenced by the large number of 24m-bright galaxies in the filament extending outward from cluster D.

This difference in the spatial concentration of group and cluster 24m galaxies was also recently observed by Krick et al. (2009), who measured a less concentrated distribution of star forming galaxies in a massive, evolved cluster at than in two dynamically younger systems at the same redshift. These results imply that while starburst activity is found throughout the group population, it is predominantly found among infalling galaxies in the cluster environments.
6. Spectral Properties and Star Formation Activity
6.1. Spectral Classification
At the redshift of the Cl1604 systems the spectral window of our DEIMOS observations encompass the [OII] doublet at Å and the H absorption line at Å, which we can use to probe the dominant mode of star formation activity (i.e., bursty versus continuous) occurring in the 24m-detected galaxies. Much has been written in the literature regarding the ability of these features to provide insight into the recent star formation histories of galaxies (see Oemler et al. 2009 for a recent review). We briefly discuss the utility of these lines below, before presenting our spectral classification of the 24m-bright population.
Due to the lifetime of the stars that give rise to each feature, namely O and B-type stars for [OII] and longer-lived A-type stars for H, these lines provide a measure of the average SFR of a galaxy over different timescales, with [OII] measuring current activity ( yr) and H reflecting more extended activity ( yr). As a result, the strengths of these lines, in the absence of significant dust extinction, are well understood for different types of activity. In galaxies undergoing normal, continuous star formation, the EW of both [OII] and H increases with increasing activity until the SFR is high enough that H emission from new stars begins to infill the H absorption line, leading to a overall decrease in the line’s EW. On the other hand, in bursty conditions, when an epoch of high star formation activity is followed by one with significantly less, the EW of H increases dramatically as there is insufficient H emission from the current generation of stars to infill the H absorption produced by the previous generation. Galaxies that have experienced a rapid reduction in their activity, i.e., post-quenched systems, show strong H absorption for the same reasons, except that they also have little or no [OII] emission.
| Spectral | Cluster/Group | Superfield | |
|---|---|---|---|
| Class | () | () | Comment |
| e(a) | 28 (47.5%) | 13 (32.5%) | Obscured Starburst |
| e(b) | 10 (17.0%) | 04 (10.3%) | Starburst |
| e(c) | 19 (32.2%) | 23 (57.5%) | Continuous SFR |
| k+a | 02 (03.4%) | 00 (00.0%) | Post-Starburst |
Using these characteristics, Dressler et al. (1999) devised a set of spectral classes based on the EW of [OII] emission and H absorption that reflect different modes of star formation activity. In this classification scheme e(a) and e(b) galaxies are ongoing starbursts with varying levels of dust obscuration. While both classes exhibit strong Balmer absorption [EW(H) 4Å], only moderate [OII] emission (EW[OII] -40 Å) is visible in e(a)’s, while e(b)’s show strong [OII] emission (EW[OII] -40 Å). On the other hand, the spectra of e(c) galaxies are consistent with normal star formation, having moderate levels of both [OII] emission (EW[OII] -40 Å) and Balmer absorption [EW(H) 4Å]. Finally k+a, or post-starburst systems, are characterized as having strong Balmer absorption features superimposed on an older K-star spectrum and lacking [OII] emission.
Using this spectral classification scheme we have classified the 24m-detected cluster, group and field galaxies based on the EW of [OII] emission and H absorption measured in their spectra. Out of the 113 non-AGN, 24m-bright supercluster members, 101 have spectra with adequate S/N for this analysis. The EWs were measured as described in §3.4 and a line was considered detected if its measured EW is greater than three times the error associated with that measurement. The results of our analysis are listed in Table 3. In general we find that the 24m-detected cluster and group members predominantly have e(a) and e(c) type spectra, which indicates they are comprised of a mix of obscured starbursts and galaxies undergoing normal, continuous star formation. We find similar results in the superfield sample, with the notable difference being a reversal in the e(a) to e(c) ratio. A greater fraction of the cluster and group galaxies appear to be undergoing dusty starburst activity compared to the field sample (47.5% versus 32.5%), where a majority have spectra consistent with normal star formation (57.5%). The reversal in the e(a) to e(c) ratio indicates that star forming galaxies in these denser environments are, on average, experiencing burstier activity than their counterparts in the field.
6.2. An Excess of Starburst Activity
Since this result is based on measurements taken from individual spectra that typically have only moderate-S/N, we have stacked the spectra of the 24m-detected galaxies as a function of environment to produce high-S/N composite spectra in order to confirm our findings. These co-added spectra can be used to gauge the average spectral properties of the stacked subsamples to greater accuracy than is possible using single galaxy spectra (e.g. Dressler et al. 2004). We will use these properties to compare the dominant mode of star formation (i.e., bursty versus continuous) occurring in the cluster, group and superfield populations.
To produce the composites, the spectra of galaxies in each region are normalized and averaged using an inverse variance weighting. We find that the resulting spectra do not vary significantly depending on whether we use a unit- or (optical) luminosity- weighted average, especially for the most luminous 24m sources.
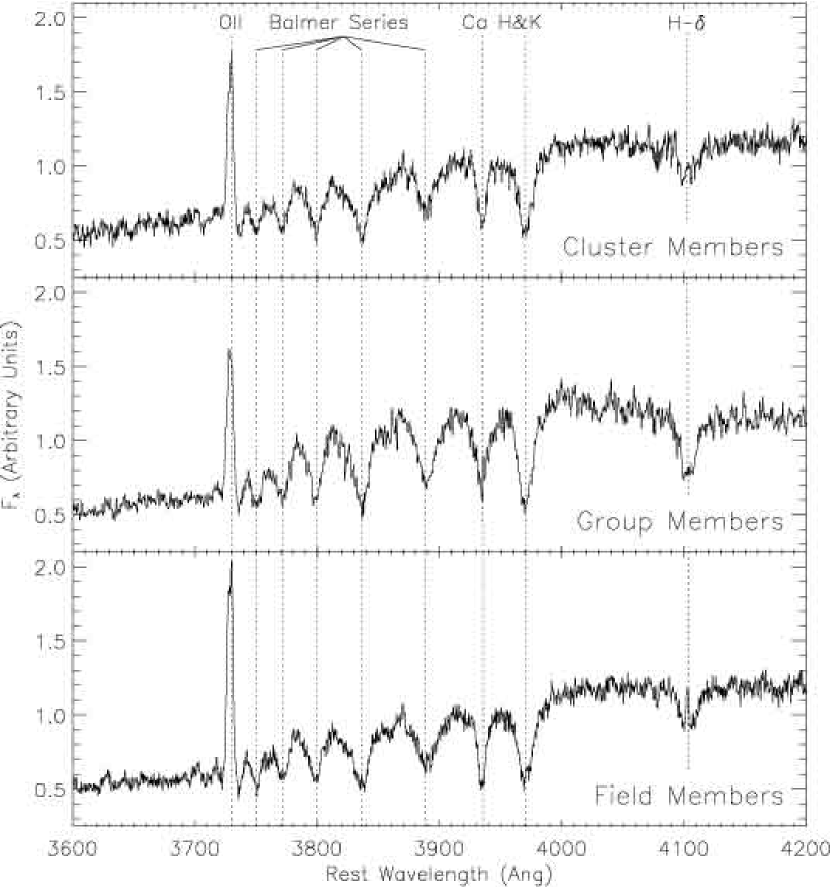
In total the group, cluster, superfield subsamples included 8, 30, and 47 24m-detected galaxies, respectively. These totals decrease to 7, 20, and 28, respectively, when we only consider galaxies with LIRG-level luminosities ( ). For each stack, the cluster and group samples were restricted to galaxies within the virial radius of each system. The resulting composite spectra for the 24m population of each region are shown in Figure 10.
For the higher S/N composite spectra, fitting techniques were used to determine the EW of the [OII] and H features. The [OII] doublet was fit using a double Gaussian model at fixed wavelength separation (2.8 Å) plus a linear continuum. The H line was also fit with a two Gaussian model plus a linear continuum, the two Gaussians characterizing the absorption and emission component of the feature.
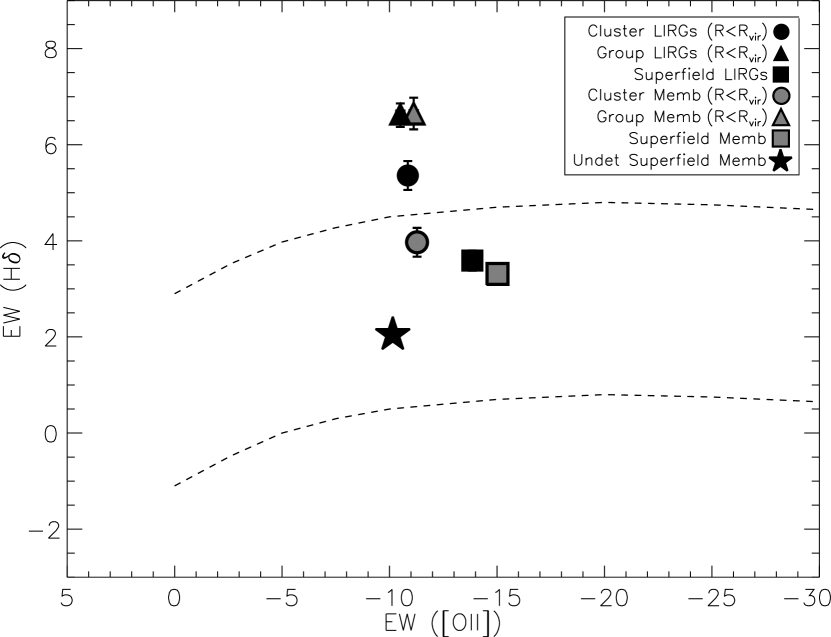
In Figure 11 we plot the EW of [OII] against that of H measured in the composite spectra of the 24m-detected cluster, group and superfield galaxies. Also shown is the parameter space that Dressler et al. (2009) calculate should encompass 95% of all normal star-forming galaxies based on the mean relationship between EW([OII]) and EW(H) observed in the Sloan Digital Sky Survey and from the analysis of Goto et al. (2003)333Since the EW(H) measurements used by Dressler et al. (2009) for this calculation were not infill corrected, our values shown in Figure 11 are similarly not corrected for emission infill.. We find that the detected superfield galaxies have on average moderate [OII] and H line strengths, placing them well within the region where we expect to find galaxies undergoing continuous star formation. This is not the case for the 24m-detected group galaxies, which show an excess of Balmer absorption indicating a greater incidence of bursty activity. The detected cluster members exhibit a similar excess, but only among the more luminous galaxies which have at least LIRG-level luminosities ( ). When considering all detected cluster members (with all IR luminosities), the average EW(H) is elevated compared to the superfield sample, but consistent with normal star formation. When we average only the more luminous members, we find a substantial increase in EW(H) that is not seen in the field population with equivalent luminosities.
The different spectral properties we find as a function of IR luminosity suggests the lower luminosity cluster members are undergoing high levels of continuous star formation, while the cluster LIRGs are experiencing more bursty activity. The reason we do not find a substantial change in the EW(H) in the group sample when we cut on IR luminosity is because almost all of the detected group galaxies (7/8) are LIRGs and show strong Balmer absorption.
It is important to note that we do not find a similar increase in Balmer absorption among the LIRGs in the field. Both the superfield LIRG sample and the entire superfield sample have average spectral properties consistent with normal, continuous star formation. This is largely due to H emission infill that is absent in the spectra of galaxies in the denser environments. This indicates the cluster and group galaxies are either affected by more dust obscuration, experiencing burstier activity, or both, as the two are known to be correlated (Dopita et al. 2002; Kewley et al. 2004).
Although a Balmer excess can be produced through the rapid truncation of normal star formation, all of the galaxies considered here have high IR luminosities and inferred SFRs. It is more likely that this excess is the result of a temporary increase in activity experienced within the cluster and group environments. This finding has important ramifications as it indicates the star forming cluster and group galaxies are not simply analogs of the field population that have yet to be quenched. A greater fraction of the galaxies in the denser environments are experiencing a burst of star formation compared to field galaxies at the same redshift.
6.3. Optical vs IR SFRs
A final noteworthy point regarding the spectra of the 24m-detected sample is the small fraction of galaxies that have [OII] emission lines strong enough to be classified as e(b) galaxies. This lack of strong [OII] emission has previously been noted for IR-luminous cluster galaxies (Marcillac et al. 2007; Dressler et al. 2008) and is thought to be the result of selective dust extinction, where younger stellar populations that produce the [OII] doublet are more heavily obscured than the older A-type stars that give rise to Balmer absorption features (Poggianti & Wu 2000). Poggianti et al. (1999) previously proposed that due to such extinction, e(a) galaxies in higher redshift clusters could be the dusty, starbursting progenitors of the k+a population observed in these systems, a scenario that our observations support.
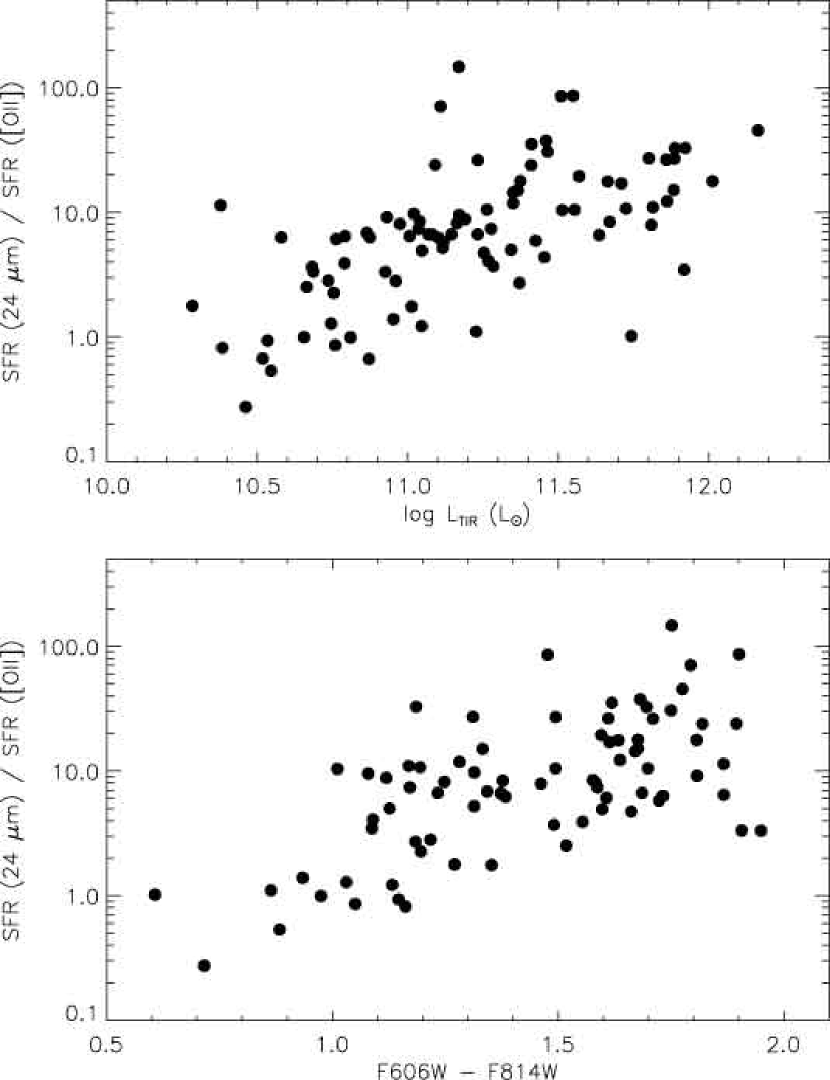
We can gauge the level of dust obscuration affecting the 24m-bright members by comparing their optically-derived SFRs (determined from their [OII] line luminosities) to the more dust-insensitive rates obtained from their IR emission. To estimate these rates we employed the and relationships of Kennicutt (1998) as described in §3.4 and §4.2. The results are shown in Figure 12, where we plot the ratio of optical to IR-derived SFRs as a function of IR luminosity (and optical color, see §5.4). For any given galaxy several factors may offset the optically-derived SFR from its IR counterpart in addition to extinction, including variations in metallicity and ionization parameter, which likely contribute to the significant scatter seen in Figure 12. Nonetheless, the overall trend is apparent: an increasing disparity between the [OII] and 24m-derived SFRs with increasing IR luminosity. This reflects the well known result that the severity of dust extinction scales with star formation activity in IR-luminous systems (Dopita et al. 2002; Kewley et al. 2004). For the most IR luminous galaxies () the discrepancy between the optical and IR-derived rates is roughly one order of magnitude. Although the star formation activity of these galaxies is not completely hidden by dust at optical wavelengths, the use of optical-line diagnostics would severely underestimate the level of ongoing activity in these systems.
7. Morphologies
Thus far we have found an overdensity of 24m-bright galaxies in the Cl1604 systems and have determined that their star formation activity is burstier in nature than their counterparts in the field. In this section we use our ACS imaging of these galaxies to investigate whether galaxy interactions play a significant role in triggering their activity. All of the 24m-detected cluster and group members and 95% of the undetected members are covered by this high-resolution imaging, allowing us to compare the morphological mix and merger fraction of the two populations. We classified the galaxy morphologies using both visual and automated techniques. The manual classification was carried out via visual inspection of each galaxy by one of the authors (L.M.L.), while the automated classification was carried out using the MORPHEUS software444http://odysseus.astro.utoronto.ca/abraham/Morpheus/, which we used to calculate the Gini coefficient, , and the parameter for each galaxy. The former is a measure of the symmetry in a galaxy’s flux distribution (Abraham et al. 2003), while the latter is the second-order moment of the brightest 20% of a galaxy’s flux and a measure of central concentration (Lotz et al. 2004).
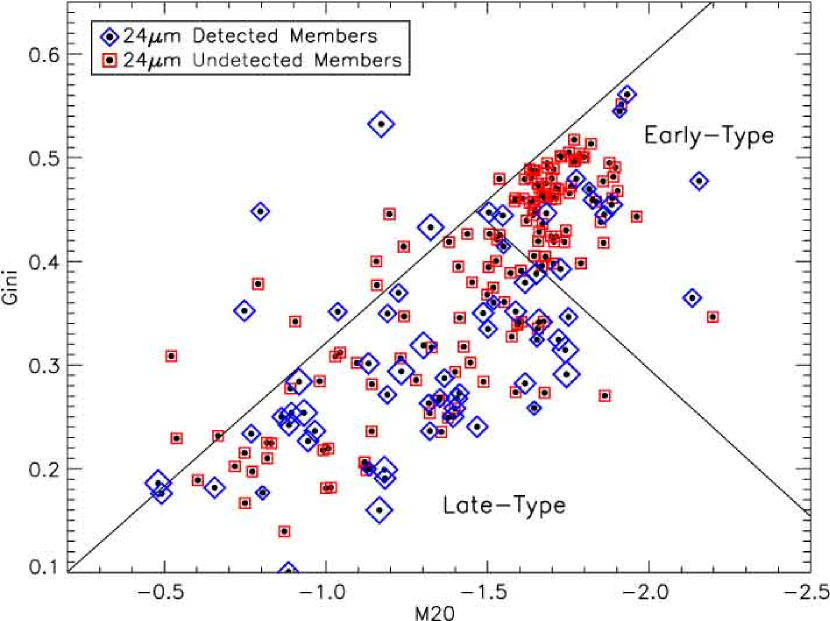
Both our visual and automated classifications find that the 24m-detected cluster members are predominantly late-type galaxies. This can be seen in Figure 13, which shows the distribution for the 24m-detected and undetected cluster members. Only a small fraction of the IR-bright galaxies are found in the early-type region of the parameter space and these tend to have lower IR luminosities than their late-type counterparts ( is indicated by symbol size in Figure 13). The opposite trend is clearly visible for the undetected member galaxies, which largely cluster in the early-type region.
There are several scenarios that may explain the presence of early-type systems among the IR-bright cluster members, including the possibility that their 24m emission is due to AGN activity missed by our SED fitting. That said, the supercluster AGN that were detected tend to have among the highest IR luminosities in the cluster sample, whereas the detected early-type galaxies have among the the lowest, making this scenario unlikely.
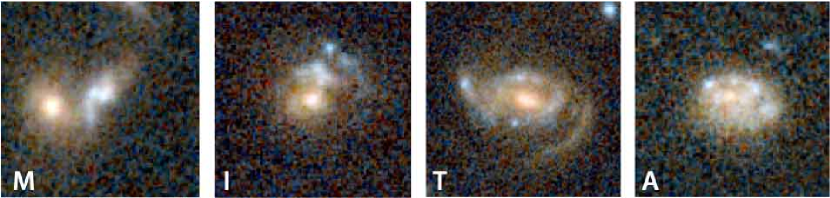
To better quantify the morphological mix and the incidence of merger and/or interaction signatures among the cluster members, we have decided to rely primarily on our visual classifications as opposed to our calculated and parameters555This is largely because our experiments with MORPHEUS have found that the ability of the G and parameters to detect interacting galaxies depends heavily on the deblending parameters used to separate objects during the detection process.. Upon inspection, each galaxy was assigned an early-type (E or S0), late-type (Sa through Sd) or merger/irregular morphology, the latter of which was given to disturbed or interacting systems that could not be assigned a standard morphology, as well as ring galaxies. In addition each galaxy was given an interaction classification that represents the likelihood that the system has experienced a recent merger or interaction event. These classifications consist of ongoing mergers or those likely to merge (M; typically disturbed with an irregular companion), interaction (I; these often exhibit tidal features and have a nearby companion), tidal disruption (T; these exhibit tidal features and do not have an obvious companion), or asymmetric morphology (A; possibly disturbed, these have asymmetric light distributions). While an asymmetric disk is by no means a clear indication of a recent interaction, we have included this classification in case the activity of the 24m-bright galaxies is triggered by minor interactions that do not significantly disrupt their morphologies. We present our results below both with and without this classification. An example of each of our four interaction classifications is shown in Figure 14.
| Morph | (Det / Undet) | (Det / Undet) | (Det / Undet) |
|---|---|---|---|
| E/S0 | 30.3% / 66.7% | 34.2% / 76.6% | 25.0% / 43.9% |
| Late-Type | 62.1% / 28.9% | 52.6% / 21.3% | 75.0% / 46.3% |
| Irregular | 07.6% / 04.4% | 13.2% / 02.2% | 00.0% / 09.8% |
Note. — Det = 24m Detected, Undet = 24m Undetected
Our findings on the morphological mix of the cluster members is summarized in Table 4, where morphological fractions are listed for both 24m-detected and undetected galaxies and as a function of cluster/group-centric distance. In general agreement with our calculated distribution, we find that the IR-bright systems in the Cl1604 systems are predominantly late-type galaxies (62.1%), while the opposite is true of the undetected population, (67.2% of which have E or S0 morphologies). We find that the IR-bright population becomes slightly more bulge dominated within the cluster/group virial radii as the late-type fraction drops to 52.6%, while beyond this distance the spiral fraction rises to 75%. A similar trend is observed for the undetected population, whose early-type fraction increases to 76.6% within the virial radii and drops to 45% in the cluster outskirts.
These fractions are similar when considering the cluster and group subsamples separately, with the notable exception being the irregular morphologies. In both the three clusters and three groups, all of the 24m-detected irregulars are found within the virial radius, but in the case of the groups, the irregular fraction is equal to that of the late-type morphologies, comprising 37.5% of the IR-bright sample. If these morphologies are due to disruptive mergers, it would seem the group environments, with their lower relative galaxy velocities, are highly conducive to such activity. We elaborate on this below when we discuss the merger fraction in these systems.
In Table 5 we present statistics on the interaction classifications assigned to the cluster and group members, again for both 24m-detected and undetected galaxies and as a function of cluster/group-centric distance. The first row of Table 5 presents the fraction of galaxies with either irregular morphologies or an M classification. The second row includes these as well as I and T galaxies, while the third also includes galaxies with an A classification. We find that regardless of which of these three schemes we adopt to identify possible interactions, the 24m-detected members are twice as likely to exhibit merger or interaction signatures than their undetected counterparts. The fraction of detected cluster and group members within with an irregular morphology or an M, I, or T classification is 53.0%, while only 25.9% of the undetected members have similar properties666These fractions increase to 68.2% and 32.6%, respectively, if we include the A classification.. Interestingly, this difference is largely due to an increase in the fraction of disturbed 24m members within the cluster and group virial radii. Outside the virial radii the detected and undetected populations have similar disturbed fractions (35.7% versus 39.0%, respectively), while within the virial radius the 24m-bright population is three times as likely to exhibit a disturbance or merger signature (65.8% versus 20.2%). We have confirmed that this is not solely due to an increased rate of interactions in the groups, as we find similar results when we examine the cluster and group subsamples separately.
| Interaction | |||
|---|---|---|---|
| Class. | (Det / Undet) | (Det / Undet) | (Det / Undet) |
| Irr+M | 34.9% / 18.5% | 42.1% / 13.8% | 25.0% / 29.3% |
| Irr+MIT | 53.0% / 25.9% | 65.8% / 20.2% | 35.7% / 39.0% |
| Irr+MITA | 68.2% / 32.6% | 78.9% / 26.6% | 53.6% / 46.3% |
Note. — Det = 24m Detected, Undet = 24m Undetected
A graphical representation of our morphological analysis can be seen in Figure 15, which shows the spatial distribution of the disturbed 24m population within each cluster and group. In this figure each galaxy has been color coded based on its morphology and/or interaction classification. This plot highlights three notable aspects of our findings. First, we find that nearly all (7/8) of the detected group members within exhibit merger or interaction features. Keeping in mind the low number statistics, this suggests that among the group members that are experiencing high levels of current star formation, a vast majority have experienced a merger or interaction in the recent past. This agrees with our earlier assessment, based on the fraction of irregular morphologies, that the groups systems appear conducive to such activity.
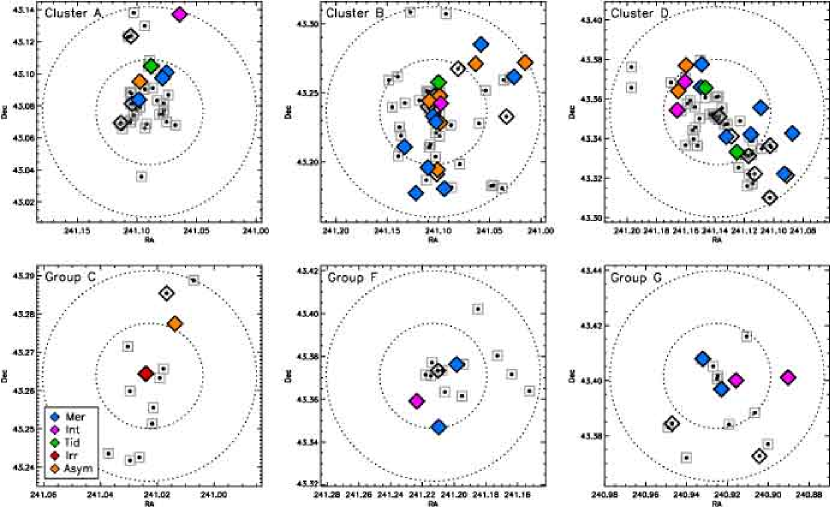
Second, although we find several galaxies with merger signatures in the filament connected to Cluster D, many other galaxies in this region exhibit no such features. This includes galaxies with some of the highest SFRs detected in the supercluster. Therefore we must conclude that the high level of activity seen in the filament is not solely a result of disruptive galaxy interactions as systems infall toward the cluster environment.
Third, there are indications that many of the disturbed 24m-bright cluster members have interacted with the core of their host clusters. For example, in Cluster D, all of the 24m detected members to the northeast of the cluster center show some form of morphological disturbance. Given the alignment of these galaxies with the infall direction of the filament, we have interpreted these systems to be galaxies that have already passed through the cluster core. Likewise in Cluster B, a substantial fraction of the 24m detected galaxies located at low cluster-centric distances exhibit disturbed morphologies. This may be due to increased tidal interactions as galaxies move through the cluster centers.
In summary, we find that i.) the 24m-detected supercluster members are primarily late-type galaxies, however in the group environment irregular morphologies are as prevalent as spirals, ii.) the fraction of 24m-detected cluster and group members that exhibit disturbed morphologies or merger signatures is 65.8% within and 35.7% outside . The former is three times the fraction observed in the undetected population, while the latter is roughly equal to it. iii.) Most detected galaxies near the cluster cores have disturbed morphologies, while many in the filament extending from Cluster D show no such disturbances.
8. Optical Colors
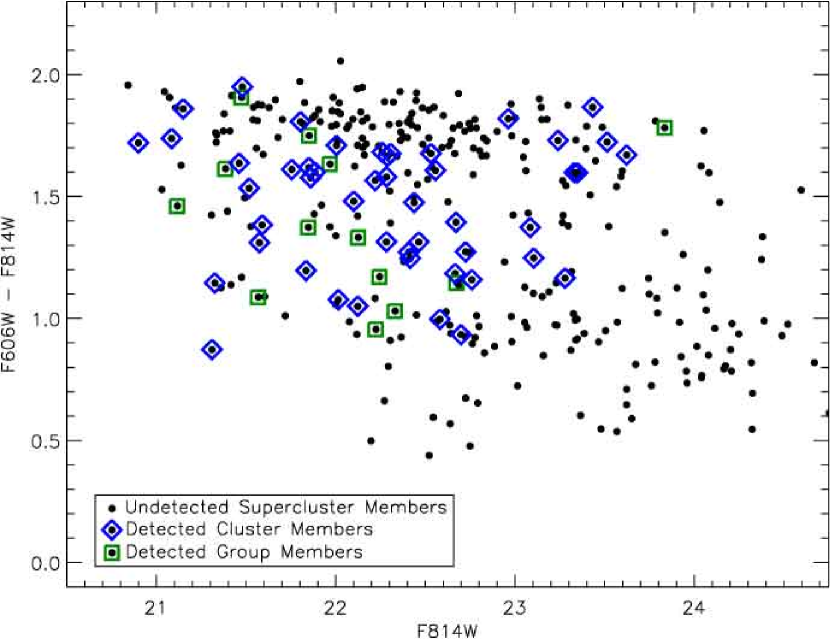
In addition to our morphological analysis, we have used our dual-band ACS imaging of the Cl1604 systems to examine the integrated optical colors of the IR-bright cluster population. A color-magnitude diagram containing both 24m-detected and undetected cluster and group members is shown in Figure 16 in the F606W and F814W bands. At the cluster redshifts, these ACS filters sample the rest-frame U and B bands, respectively. In general we find that the 24m-detected galaxies tend to be redder than their undetected counterparts in the blue cloud and yet slightly bluer than the supercluster red sequence. This color distribution, peaking in the so-called green valley, has been previously observed for 24m-selected galaxies in both cluster and field environments (Geach et al. 2006; Cowie et al. 2008; Krick et al. 2009) and has been shown to be largely the result of severe dust extinction in otherwise blue, star forming systems. We discuss the effects of dust on the colors of these galaxies in greater detail at the end of this section.
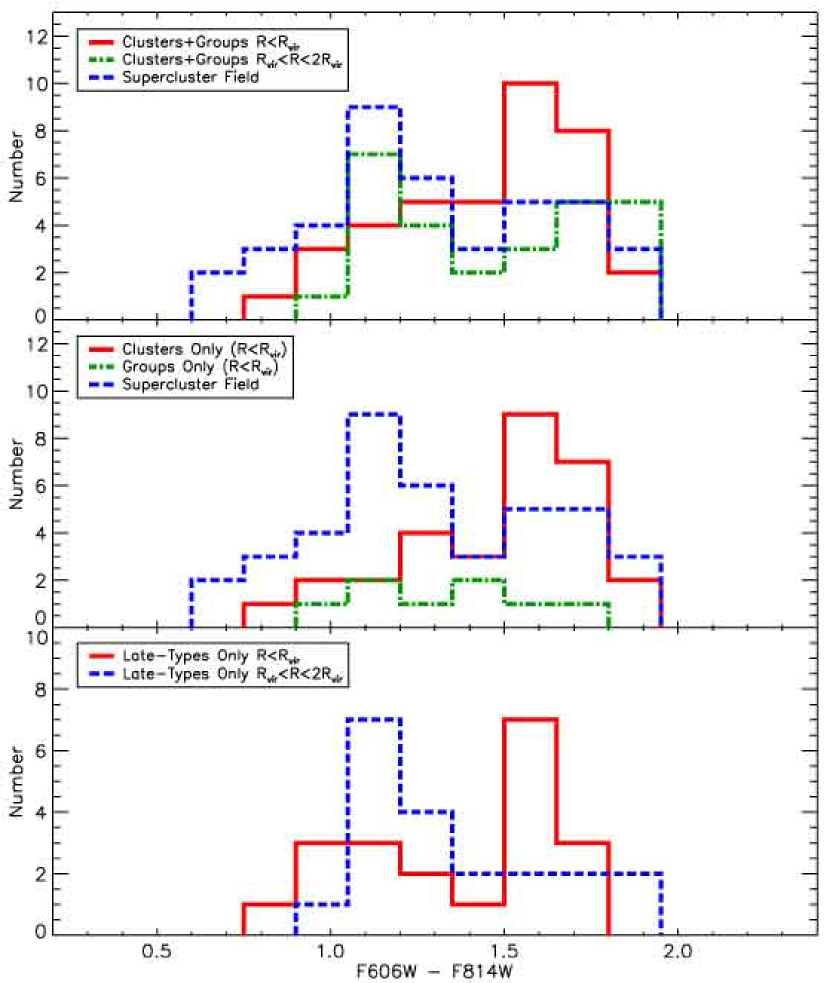
Interestingly, when we split the 24m-detected sample by cluster/group-centric distance we find a pronounced segregation in optical color. Figure 17 shows the color distribution of 24m-bright cluster and group galaxies located within the virial radius (), on the cluster and group outskirts (), and galaxies in the supercluster field () . We find that in the field, the 24m-detected galaxies have colors that peak near the blue cloud, with a smaller subset exhibiting relatively red colors. On the cluster and group outskirts () the color distribution is fairly even, but within the distribution has reversed and the 24m galaxies become predominantly redder, with a smaller subset of blue systems. As the middle panel of Figure 17 shows, this blue tail is largely due to galaxies in the Cl1604 groups. When we split the sample into group and cluster subsamples, we find a pronounced dichotomy between the cluster and field galaxy colors.
We have confirmed that this color difference is not due to an increase in the early-type fraction of 24m sources within , as the disparity remains when we consider only galaxies securely identified as Sa-Sd by visual inspection. The color difference between confirmed late-type cluster and group members within and those outside this distance can be seen in the bottom panel of Figure 17. This difference is significant as it suggests the 24m-detected galaxies found near the cluster centers cannot simply be infalling, IR-bright field galaxies that have yet to be quenched. Either the cluster members are affected by significantly more dust extinction or these galaxies have already experienced a degree of color transformation.
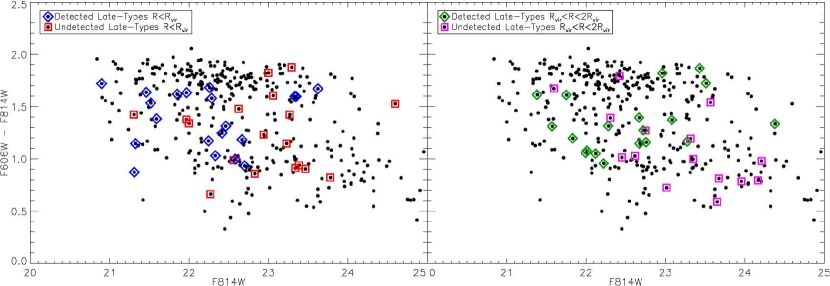
Redder colors for late-type cluster members relative to the field were previously observed by Homeier et al. (2006) in several high-redshift systems (including two of the Cl1604 clusters). They also conclude that such cluster spirals could not be a pristine infall population due to this color difference. However this has been challenged by Marcillac et al. (2007) who note that the optical colors of 24m-detected, late-type galaxies in RX J0152.7-1357 appear to be unaffected by their starburst activity as they have the same colors as undetected spirals in the system. Contrary to their result, we find that the undetected late-type members in the Cl1604 systems are substantially bluer and fainter than the 24m-detected members. This can be seen in Figure 18, which shows the color-magnitude distribution of both samples. Whether it be within the virial radius or on the cluster outskirts, the detected members tend to be redder than their undetected spiral counterparts.
It is well known that starburst activity is associated with significant levels of dust extinction which could explain the color differences observed for the detected and undetected populations. For example, Cowie et al. (2008) demonstrate that when corrected for extinction, the bulk of the 24m sources in the GOODS-North field out to move from the green valley back onto the blue cloud. We explored this possibility by comparing the optical and IR-derived SFRs of the 24m population as a function of color in the bottom panel of Figure 12. We find a clear correlation between optical obscuration and observed color, with the reddest sources consistently showing the largest offset between the two SFR measures. The severe obscuration indicated in Figure 12 could easily explain the color difference found in the two populations. This result suggests that the 24m-detected cluster members are experiencing dustier star formation activity relative to the field population with similar IR luminosities. This result is consistent with our spectroscopic analysis which found burstier activity occurring in the cluster and group members. These findings strongly suggest the starburst population within the clusters and groups are not simply infalling field galaxies as they are experiencing a markedly different type of star formation activity.
The redder colors and increased extinction of the IR-bright members within the virial radius could be explained if they were experiencing more centrally concentrated bursts of star formation, which tend to be buried beneath higher column densities of obscuring dust. Evidence for such activity has been observed in other IR-bright cluster galaxies. For example, Geach et al. (2009), using the Spitzer Infrared Spectrograph, find that the integrated spectra of LIRGs in Cl0024+16 resemble those of local nuclear starbursts. If such activity is responsible for the redder colors we observe among the Cl1604 galaxies, we may expect to find a more centrally concentrated distribution of light in these galaxies. To test this, we measured the concentration parameter for each 24m-detected galaxy using the MORPHEUS software and indeed we find a higher concentration for galaxies within versus those in the supercluster field, as well as for the redder 24m-detected population in general. This can be seen in Figure 19, which shows the measured concentration parameter for various subsamples within the Cl1604 system. While all of the detected galaxies in general have low concentrations, we find the cluster/group distribution peaks at higher concentrations than that of the field galaxies.
Although there is a correlation between concentration and Sersic index, we have confirmed that the higher concentration parameters found for the redder populations are not simply due to more early-type galaxies associated with the 24m-sources within . While the IR-bright members within have higher concentrations than those in the field, their concentrations fall far below that of the undetected, early-type cluster and group members, indicating that this result is not due to a preponderance of early-type morphologies.
In summary, we find that i.) the 24m-detected cluster members within have considerably redder optical colors than their IR-bright counterparts in the field, ii.) the reddest of these sources exhibit the largest offset between their optically- and IR-derived SFRs, indicating a greater level of optical obscuration, and iii.) the 24m-detected cluster and group members have higher central concentration of rest-frame B-band light compared to detected field galaxies.
9. Discussion
9.1. Infalling Field Galaxies or Triggered Activity?
One of the central issues debated since the initial detection of the Butcher-Oemler effect is whether galaxies experience a period of enhanced star formation during cluster assembly. Despite spectroscopic evidence for starburst activity in distant clusters, the answer to this question has remained elusive since the evolution of the star forming properties of cluster galaxies often mimics the evolution found in the field (e.g. Bai et al. 2007). In our study of the Cl1604 clusters we have found evidence that the elevated star formation activity in these systems is not simply a reflection of the increased field activity at . In summary, we find an overdensity of IR-bright galaxies in the Cl1604 clusters relative to the coeval field and that this excess scales with a system’s dynamical state. These galaxies exhibit elevated levels of Balmer absorption and increased levels of obscuration which suggests their star formation activity is burstier than that of field galaxies with similar IR luminosities.
Our findings regarding the excess of 24m-bright galaxies in dynamically active systems is consistent with several previous studies that have reported source overdensities in unrelaxed or merging clusters (Geach et al. 2006, Marcillac et al. 2007). Recently Saintonge, Tran, & Holden (2008), using MIPS observations of eight clusters, found that while the fraction of galaxies undergoing dust-obscured star formation steadily increases with cluster redshift, dynamically unrelaxed systems exhibit an excess of sources beyond the nominal redshift trend. The authors attribute this increase to a higher galaxy accretion rate in unrelaxed clusters. Our results generally agree with this assessment given that the 24m detected galaxies appear to be an infalling population. This is especially apparent in Cluster D, where we find dust-obscured activity associated with galaxies streaming along a large-scale filament connected to the system.
That being said, the differences we observe in the IR-bright cluster members relative to the field indicate that their star formation activity cannot simply be residual field activity that has yet to be quenched. Their optical colors are generally redder (which we have shown correlates well with extinction in this sample), their morphologies are more centrally concentrated, and their spectra show signs of elevated starburst activity relative to the field. Dressler et al. (2004) previously demonstrated that the average spectral properties of moderate-redshift clusters could not be accounted for through a mix of passive and continuously star-forming galaxies and that starburst activity must play a larger role at higher redshifts. However, they found this to be true of the field population as well. In our study, we find that the composite spectra of the cluster and group members show a greater contribution from starburst galaxies than we see in the field population. When one further considers that the lifetime of a burst ( Myr) is far shorter than the time required for an infalling galaxy to reach the cluster core (1260 Myr in cluster D for a galaxy infalling from the virial radius at 582 km s-1), it becomes evident that the elevated starburst activity we observe must be triggered, to some extent, by processes related to the cluster environment. This finding is at odds with scenarios that simply rely on an increased rate of passive accretion to explain the greater incidence of star forming galaxies in higher redshift clusters (e.g. Ellingson et al. 2001, Loh et al. 2008).
9.2. Triggering Mechanisms
We have presented three observational clues that can help shed light on the mechanism responsible for initiating the elevated starburst activity we observe: i.) the fraction of 24m-detected galaxies showing signs of a recent merger or tidal interaction is nearly twice as high within the cluster/group virial radius (65.8%) than it is outside this distance (35.7%), ii.) interaction signatures are three times as common among the detected members than the undetected members, iii.) the 24m-detected sample within the virial radius exhibit a higher central concentration of rest-frame B-band light than coeval field galaxies with equivalent IR luminosities.
Galaxy mergers and weak tidal interactions (i.e. harassment) are two mechanisms that can both produce the disturbed morphologies we observe and trigger episodes of enhanced star formation (Barnes & Hernquist 1991, Moore et al. 1996; Barton et al. 2007). Given the increased frequency of disturbed morphologies among the 24m-detected members, it is likely interactions play a role in triggering the increased activity we observe. This cannot be said of the IR-luminous field population at similar redshifts. While LIRG-level activity at low redshifts is predominantly associated with galaxy interactions (Ishida et al. 2004), this is not the case at the redshift of the Cl1604 systems. For example, Melbourne et al. (2005) report that a majority of LIRGs in the field at appear to be undisturbed late-type systems rather than galaxies with peculiar or irregular morphologies. We also observe this for galaxies on the cluster/group outskirts and in the supercluster field, but find the opposite result within the cluster/group centers, where a majority of the 24m-detected galaxies exhibit morphological disturbances. If continuous, LIRG-level activity is the normal mode of star formation for gas-rich field galaxies at and triggered starburst activity more prevalent in denser environments, then this could explain many of the physical differences we observe in our 24m-detected sample as a function of cluster/group-centric distance.
Can interactions explain our third point: higher central concentrations for the 24m-detected galaxies in the cluster and group centers? Simulations have shown that both numerous tidal interactions and mergers can funnel material to the center of a galaxy and trigger a circumnuclear starburst (e.g. Noguchi 1988; Hernquist 1989; Mihos & Hernquist 1996). Observationally, this effect has been detected in several low redshift clusters. In a survey of H emission from late-type galaxies in eight Abell clusters, Moss & Whittle (2000) found that circumnuclear starburst activity is preferentially found in regions of high galaxy densities and associated with galaxies that have peculiar or distorted morphologies. They conclude that tidal interactions, working more efficiently near the cluster centers, are responsible for both the disturbed morphologies and the compact star formation. This is in excellent agreement with our findings as we observe both an increase in starburst activity and interaction signatures at low cluster-centric radii.
Since both mergers and harassment can give rise to many of the morphological disturbances we find, our observations cannot rule out either mechanism as the starburst catalyst. Although major mergers are not expected to be common within the cluster environment given the high relative velocities of cluster galaxies, Oemler et al. (2009) recently found evidence for merger activity associated with 24m-detected galaxies near the core of Abell 851. Citing Struck (2006), they proposed that the compression of recently accreted groups and bound galaxy pairs could lead to an increased merger rate and elevated SFRs among infalling galaxies. In the Cl1604 clusters we do observe signatures of galaxy-galaxy mergers that could not originate from harassment alone, such as interacting pairs and ring galaxies, indicating that merger activity is present to some extent in these high density environments. That being said, the increase in disturbed morphologies we find within the cluster centers is largely driven by an increase in galaxies exhibiting tidal features and not those involved in obvious mergers. The fraction of 24m-detected cluster members that have either an irregular morphology or M interaction classification is the same within the cluster cores as it is on the cluster outskirts777This is in contrast to the Cl1604 groups, where such morphologies are found in excess.. On the other hand, the fraction of detected galaxies showing tidal features (both with and without a nearby companion) is substantially higher within the cluster centers. This is not to say harassment is the dominate mechanism affecting these galaxies since bone-fide mergers may also be responsible for generating many of the tidal features we observe. Considering further that mergers are not always obvious in optical imaging, it is difficult to judge the relative importance of the two mechanisms other than to say signatures of both are common among our 24m-detected cluster sample.
In the case of the Cl1604 group sample, the picture is a bit clearer. Among the IR-bright group galaxies we find that irregular morphologies are as common as late-type morphologies and that almost all detected galaxies within (7/8) show clear signs of ongoing mergers or interactions. These interactions appear to be having a substantial effect on the star formation activity of the detected group galaxies, as they have among the highest IR luminosities in the supercluster sample and exhibit a large Balmer excess relative to both IR-bright field galaxies and the detected cluster population. Therefore, while a mix of harassment and mergers are likely driving the enhanced star formation found in the Cl1604 clusters, mergers appear to be the dominate triggering mechanism in the group environment, where the lower relative velocity of galaxies is much more conducive to such activity.
10. Conclusions
We have used Spitzer-MIPS m imaging, Keck spectroscopy and HST-ACS observations to study the obscured star forming population in and around three clusters and three groups at . These six systems are components of the Cl1604 supercluster, the largest structure imaged by Spitzer at redshifts approaching unity. Our analysis has found that the average density of 24um-detected galaxies within the virial radius of the three Cl1604 clusters is nearly twice that of the surrounding field and that this overdensity scales with the cluster’s dynamical state. These galaxies often appear optically unremarkable and exhibit only moderate [OII] line emission due to severe obscuration. Their spatial distribution suggests they are an infalling population, but an examination of their spectral properties, morphologies and optical colors indicate they are not simply analogs of the field population that have yet to be quenched. Using stacked composite spectra, we find the m-detected cluster and group galaxies exhibit elevated levels of Balmer absorption compared to what is expected from normal, continuous star formation activity. A similar excess is not observed in field galaxies with equivalent IR luminosities. In addition, these galaxies have redder optical colors and a more centrally concentrated light distribution.
Our interpretation of these findings is that a greater fraction of the detected cluster and group members are experiencing nuclear starburst activity compared to their counterparts in the field. Since the cluster members appear to be an infalling population, this would suggest gas-rich galaxies at high redshift experience a temporary increase in their star formation activity as they assemble into denser environments.
Using HST-ACS imaging we find that disturbed morphologies are common among the 24m-detected cluster and group members and become more prevalent in regions of higher galaxy density. Detected members within the virial radius of these systems show signs of recent interactions three times more often than undetected members and twice as often as detected galaxies on the cluster/group outskirts. This is true for both the cluster and group subsamples. Nearly all of the detected group members show signs of clear merger activity, while an excess of tidal features is observed among the cluster galaxies. We conclude that mergers are the dominate triggering mechanism responsible for the enhanced star formation found in the Cl1604 groups, while a mix of harassment and mergers are likely driving the activity of the cluster galaxies, although we cannot conclusively determine the relative importance of the two mechanisms.
We are continuing our spectroscopic observations of the Cl1604 systems with the goal of compiling a highly complete redshift sample for galaxies in and around the dynamically unrelaxed Cluster D. Using this sample, we plan to study both the obscured star formation - density relationship in this system and whether the descendent of the cluster’s 24m-bright population are the bulge-dominated lenticular galaxies found in local clusters. We expect to complete both studies in the near future.
References
- Abraham, van den Bergh, & Nair (2003) Abraham, R. G., van den Bergh, S., & Nair, P. 2003, ApJ, 588, 218
- Bai, Marcillac, Rieke, Rieke, Tran, Hinz, Rudnick, Kelly, & Blaylock (2007) Bai, L., Marcillac, D., Rieke, G. H., Rieke, M. J., Tran, K., Hinz, J. L., Rudnick, G., Kelly, D. M., et al. 2007, ApJ, 664, 181
- Balogh, Morris, Yee, Carlberg, & Ellingson (1997) Balogh, M. L., Morris, S. L., Yee, H. K. C., Carlberg, R. G., & Ellingson, E. 1997, ApJ, 488, L75+
- Barnes & Hernquist (1991) Barnes, J. E. & Hernquist, L. E. 1991, ApJ, 370, L65
- Barton, Arnold, Zentner, Bullock, & Wechsler (2007) Barton, E. J., Arnold, J. A., Zentner, A. R., Bullock, J. S., & Wechsler, R. H. 2007, ApJ, 671, 1538
- Bekki (1999) Bekki, K. 1999, ApJ, 510, L15
- Bertin & Arnouts (1996) Bertin, E. & Arnouts, S. 1996, A&AS, 117, 393
- Biviano, Murante, Borgani, Diaferio, Dolag, & Girardi (2006) Biviano, A., Murante, G., Borgani, S., Diaferio, A., Dolag, K., & Girardi, M. 2006, A&A, 456, 23
- Bolzonella, Miralles, & Pelló (2000) Bolzonella, M., Miralles, J., & Pelló, R. 2000, A&A, 363, 476
- Butcher & Oemler (1978) Butcher, H. & Oemler, Jr., A. 1978, ApJ, 226, 559
- Calzetti, Armus, Bohlin, Kinney, Koornneef, & Storchi-Bergmann (2000) Calzetti, D., Armus, L., Bohlin, R. C., Kinney, A. L., Koornneef, J., & Storchi-Bergmann, T. 2000, ApJ, 533, 682
- Chary & Elbaz (2001) Chary, R. & Elbaz, D. 2001, ApJ, 556, 562
- Cowie & Barger (2008) Cowie, L. L. & Barger, A. J. 2008, ApJ, 686, 72
- Dale & Helou (2002) Dale, D. A. & Helou, G. 2002, ApJ, 576, 159
- Donley, Rieke, Pérez-González, & Barro (2008) Donley, J. L., Rieke, G. H., Pérez-González, P. G., & Barro, G. 2008, ApJ, 687, 111
- Dopita, Pereira, Kewley, & Capaccioli (2002) Dopita, M. A., Pereira, M., Kewley, L. J., & Capaccioli, M. 2002, ApJS, 143, 47
- Dressler & Gunn (1983) Dressler, A. & Gunn, J. E. 1983, ApJ, 270, 7
- Dressler, Oemler, Couch, Smail, Ellis, Barger, Butcher, Poggianti, & Sharples (1997) Dressler, A., Oemler, Jr., A., Couch, W. J., Smail, I., Ellis, R. S., Barger, A., Butcher, H., Poggianti, et al. 1997, ApJ, 490, 577
- Dressler, Oemler, Poggianti, Smail, Trager, Shectman, Couch, & Ellis (2004) Dressler, A., Oemler, Jr., A., Poggianti, B. M., Smail, I., Trager, S., Shectman, S. A., Couch, W. J., & Ellis, R. S. 2004, ApJ, 617, 867
- Dressler, Rigby, Oemler, Fritz, Poggianti, Rieke, & Bai (2009) Dressler, A., Rigby, J., Oemler, A., Fritz, J., Poggianti, B. M., Rieke, G., & Bai, L. 2009, ApJ, 693, 140
- Dressler, Smail, Poggianti, Butcher, Couch, Ellis, & Oemler (1999) Dressler, A., Smail, I., Poggianti, B. M., Butcher, H., Couch, W. J., Ellis, R. S., & Oemler, Jr., A. 1999, ApJS, 122, 51
- Ellingson, Lin, Yee, & Carlberg (2001) Ellingson, E., Lin, H., Yee, H. K. C., & Carlberg, R. G. 2001, ApJ, 547, 609
- Evrard (1991) Evrard, A. E. 1991, MNRAS, 248, 8P
- Faber, Phillips, Kibrick, Alcott, Allen, Burrous, Cantrall, Clarke, Coil, Cowley, Davis, Deich, Dietsch, Gilmore, Harper, Hilyard, Lewis, McVeigh, Newman, Osborne, Schiavon, Stover, Tucker, Wallace, Wei, Wirth, & Wright (2003) Faber, S. M., Phillips, A. C., Kibrick, R. I., Alcott, B., Allen, S. L., Burrous, J., Cantrall, T., Clarke, D., et al. 2003, in Presented at the Society of Photo-Optical Instrumentation Engineers (SPIE) Conference, Vol. 4841, Instrument Design and Performance for Optical/Infrared Ground-based Telescopes. Edited by Iye, Masanori; Moorwood, Alan F. M. Proceedings of the SPIE, Volume 4841, pp. 1657-1669 (2003)., ed. M. Iye & A. F. M. Moorwood, 1657–1669
- Fadda, Biviano, Marleau, Storrie-Lombardi, & Durret (2008) Fadda, D., Biviano, A., Marleau, F. R., Storrie-Lombardi, L. J., & Durret, F. 2008, ApJ, 672, L9
- Fisher, Fabricant, Franx, & van Dokkum (1998) Fisher, D., Fabricant, D., Franx, M., & van Dokkum, P. 1998, ApJ, 498, 195
- Gal, Lemaux, Lubin, Kocevksi, & Squires (2008) Gal, R. R., Lemaux, B. C., Lubin, L. M., Kocevksi, D., & Squires, G. K. 2008, ArXiv e-prints, 803
- Gal & Lubin (2004) Gal, R. R. & Lubin, L. M. 2004, ApJ, 607, L1
- Gal, Lubin, & Squires (2005) Gal, R. R., Lubin, L. M., & Squires, G. K. 2005, AJ, 129, 1827
- Geach, Smail, Ellis, Moran, Smith, Treu, Kneib, Edge, & Kodama (2006) Geach, J. E., Smail, I., Ellis, R. S., Moran, S. M., Smith, G. P., Treu, T., Kneib, J., Edge, A. C., et al. 2006, ApJ, 649, 661
- Geach, Smail, Moran, Treu, & Ellis (2009) Geach, J. E., Smail, I., Moran, S. M., Treu, T., & Ellis, R. S. 2009, ApJ, 691, 783
- Goto (2003) Goto, T. 2003, PhD thesis, The University of Tokyo
- Hernquist (1989) Hernquist, L. 1989, Nature, 340, 687
- Homeier, Postman, Menanteau, Blakeslee, Mei, Demarco, Ford, Illingworth, & Zirm (2006) Homeier, N. L., Postman, M., Menanteau, F., Blakeslee, J. P., Mei, S., Demarco, R., Ford, H. C., Illingworth, G. D., et al. 2006, AJ, 131, 143
- Ishida (2004) Ishida, C. M. 2004, PhD thesis, UNIVERSITY OF HAWAI’I
- Kennicutt (1998) Kennicutt, Jr., R. C. 1998, ARA&A, 36, 189
- Kewley, Geller, & Jansen (2004) Kewley, L. J., Geller, M. J., & Jansen, R. A. 2004, AJ, 127, 2002
- (38) Kocevski, D. D., Lubin, L. M., Gal, R., Lemaux, B. C., Fassnacht, C. D., & Squires, G. K. 2009a, ApJ, 690, 295
- (39) Kocevski, D. D., Lubin, L. M., Lemaux, B. C., Gal, R. R., Fassnacht, C. D., Lin, R., & Squires, G. K. 2009b, ApJ, 700, 901
- Koekemoer, Fruchter, Hook, & Hack (2002) Koekemoer, A. M., Fruchter, A. S., Hook, R. N., & Hack, W. 2002, in The 2002 HST Calibration Workshop : Hubble after the Installation of the ACS and the NICMOS Cooling System, ed. S. Arribas, A. Koekemoer, & B. Whitmore, 337–+
- Krick, Surace, Thompson, Ashby, Hora, Gorjian, & Yan (2009) Krick, J. E., Surace, J. A., Thompson, D., Ashby, M. L. N., Hora, J. L., Gorjian, V., & Yan, L. 2009, ApJ, 700, 123
- Lacy, Storrie-Lombardi, Sajina, Appleton, Armus, Chapman, Choi, Fadda, Fang, Frayer, Heinrichsen, Helou, Im, Marleau, Masci, Shupe, Soifer, Surace, Teplitz, Wilson, & Yan (2004) Lacy, M., Storrie-Lombardi, L. J., Sajina, A., Appleton, P. N., Armus, L., Chapman, S. C., Choi, P. I., Fadda, D., et al. 2004, ApJS, 154, 166
- Lemaux, Lubin, Shapley, Kocevski, Gal, & Squires (2010) Lemaux, B. C., Lubin, L. M., Shapley, A., Kocevski, D., Gal, R. R., & Squires, G. K. 2010, ApJ, 716, 970
- Lilly, Eales, Gear, Webb, Bond, & Dunne (1999) Lilly, S., Eales, S. A., Gear, W. K., Webb, T. M., Bond, J. R., & Dunne, L. 1999, in The Formation of Galactic Bulges, ed. C. M. Carollo, H. C. Ferguson, & R. F. G. Wyse, 26–+
- Loh, Ellingson, Yee, Gilbank, Gladders, & Barrientos (2008) Loh, Y., Ellingson, E., Yee, H. K. C., Gilbank, D. G., Gladders, M. D., & Barrientos, L. F. 2008, ApJ, 680, 214
- Lotz, Primack, & Madau (2004) Lotz, J. M., Primack, J., & Madau, P. 2004, AJ, 128, 163
- Lubin, Postman, Oke, Ratnatunga, Gunn, Hoessel, & Schneider (1998) Lubin, L. M., Postman, M., Oke, J. B., Ratnatunga, K. U., Gunn, J. E., Hoessel, J. G., & Schneider, D. P. 1998, AJ, 116, 584
- Marcillac, Rigby, Rieke, & Kelly (2007) Marcillac, D., Rigby, J. R., Rieke, G. H., & Kelly, D. M. 2007, ApJ, 654, 825
- Melbourne, Koo, & Le Floc’h (2005) Melbourne, J., Koo, D. C., & Le Floc’h, E. 2005, ApJ, 632, L65
- Metcalfe, Fadda, & Biviano (2005) Metcalfe, L., Fadda, D., & Biviano, A. 2005, Space Science Reviews, 119, 425
- Mihos & Hernquist (1996) Mihos, J. C. & Hernquist, L. 1996, ApJ, 464, 641
- Monet, Levine, Casian, & et al. (2002) Monet, D. G., Levine, S. E., Casian, B., & et al. 2002, VizieR Online Data Catalog, 1284, 0
- Moore, Katz, Lake, Dressler, & Oemler (1996) Moore, B., Katz, N., Lake, G., Dressler, A., & Oemler, A. 1996, Nature, 379, 613
- Moss & Whittle (2000) Moss, C. & Whittle, M. 2000, MNRAS, 317, 667
- Noguchi (1988) Noguchi, M. 1988, A&A, 203, 259
- Oemler, Dressler, Kelson, Rigby, Poggianti, Fritz, Morrison, & Smail (2009) Oemler, A., Dressler, A., Kelson, D., Rigby, J., Poggianti, B. M., Fritz, J., Morrison, G., & Smail, I. 2009, ApJ, 693, 152
- Oke, Cohen, Carr, Cromer, Dingizian, Harris, Labrecque, Lucinio, Schaal, Epps, & Miller (1995) Oke, J. B., Cohen, J. G., Carr, M., Cromer, J., Dingizian, A., Harris, F. H., Labrecque, S., Lucinio, R., et al. 1995, PASP, 107, 375
- Oke, Postman, & Lubin (1998) Oke, J. B., Postman, M., & Lubin, L. M. 1998, AJ, 116, 549
- Pérez-González, Rieke, Egami, Alonso-Herrero, Dole, Papovich, Blaylock, Jones, Rieke, Rigby, Barmby, Fazio, Huang, & Martin (2005) Pérez-González, P. G., Rieke, G. H., Egami, E., Alonso-Herrero, A., Dole, H., Papovich, C., Blaylock, M., Jones, J., et al. 2005, ApJ, 630, 82
- Poggianti, Bridges, Komiyama, Yagi, Carter, Mobasher, Okamura, & Kashikawa (2004) Poggianti, B. M., Bridges, T. J., Komiyama, Y., Yagi, M., Carter, D., Mobasher, B., Okamura, S., & Kashikawa, N. 2004, ApJ, 601, 197
- Poggianti, Smail, Dressler, Couch, Barger, Butcher, Ellis, & Oemler (1999) Poggianti, B. M., Smail, I., Dressler, A., Couch, W. J., Barger, A. J., Butcher, H., Ellis, R. S., & Oemler, A. J. 1999, ApJ, 518, 576
- Poggianti & Wu (2000) Poggianti, B. M. & Wu, H. 2000, ApJ, 529, 157
- Polletta, Tajer, Maraschi, Trinchieri, Lonsdale, Chiappetti, Andreon, Pierre, Le Fèvre, Zamorani, Maccagni, Garcet, Surdej, Franceschini, Alloin, Shupe, Surace, Fang, Rowan-Robinson, Smith, & Tresse (2007) Polletta, M., Tajer, M., Maraschi, L., Trinchieri, G., Lonsdale, C. J., Chiappetti, L., Andreon, S., Pierre, M., et al. 2007, ApJ, 663, 81
- Postman, Franx, Cross, Holden, Ford, Illingworth, Goto, Demarco, Rosati, Blakeslee, Tran, Benítez, Clampin, Hartig, Homeier, Ardila, Bartko, Bouwens, Bradley, Broadhurst, Brown, Burrows, Cheng, Feldman, Golimowski, Gronwall, Infante, Kimble, Krist, Lesser, Martel, Mei, Menanteau, Meurer, Miley, Motta, Sirianni, Sparks, Tran, Tsvetanov, White, & Zheng (2005) Postman, M., Franx, M., Cross, N. J. G., Holden, B., Ford, H. C., Illingworth, G. D., Goto, T., Demarco, R., et al. 2005, ApJ, 623, 721
- Postman, Lubin, & Oke (1998) Postman, M., Lubin, L. M., & Oke, J. B. 1998, AJ, 116, 560
- Saintonge, Tran, & Holden (2008) Saintonge, A., Tran, K., & Holden, B. P. 2008, ApJ, 685, L113
- Silva, Granato, Bressan, & Danese (1998) Silva, L., Granato, G. L., Bressan, A., & Danese, L. 1998, ApJ, 509, 103
- Struck (2006) Struck, C. 2006, Galaxy Collisions - Dawn of a New Era, ed. Mason, J. W. (Springer Verlag), 115–+