Galactic center at very high-energies.
Abstract
Employing data collected during the first 25 months’ observations by the Fermi -LAT, we describe and subsequently seek to model the very high energy ( MeV) emission from the central few parsecs of our Galaxy. We analyse, in particular, the morphological, spectral and temporal characteristics of the central source, 1FGL J1745.6-2900. Remarkably, the data show a clear, statistically significant signal at energies above 10 GeV, where the Fermi -LAT has an excellent angular resolution comparable to the angular resolution of HESS at TeV energies. This not only reduces dramatically the contamination both from the diffuse background and the nearby gamma-ray sources, but also makes meaningful the joint analysis of the Fermi and HESS data. Our analysis does not show statistically significant variability of 1FGL J1745.6-2900. Using the combination of Fermi data on 1FGL J1745.6-2900 and HESS data on the coincident, TeV source HESS J1745-290, we show that the spectrum of the central -ray source is inflected with a relatively steep spectral region matching between the flatter spectrum found at both low and high energies. We seek to model the gamma-ray production in the inner 10 pc of the Galaxy and examine, in particular, cosmic ray (CR) proton propagation scenarios that reproduce the observed spectrum of the central source. We show that a model that instantiates a transition from diffusive propagation of the CR protons at low energy to almost rectilinear propagation at high energies (given a reasonable energy-dependence of the assumed diffusion coefficient) can well explain the spectral phenomenology. In general, however, we find considerable degeneracy between different parameter choices which will only be broken with the addition of morphological information that -ray telescopes cannot deliver given current angular resolution limits. We argue that a future analysis done in combination with higher-resolution radio continuum data holds out the promise of breaking this degeneracy.
Subject headings:
Galaxy: center — synchrotron radiation: cosmic rays — molecular clouds: general1. Introduction
Over the past decade-and-a-half since the discovery by EGRET of a very high energy (VHE) gamma-ray source near the Galactic center (GC), there has been intense speculation as to what mechanism(s) are producing the observed emission. The subsequent discovery of TeV gamma-ray emission from the Sgr A* region by the ground-based gamma-ray instruments, in particular by the HESS array of atmospheric Cherenkov telescopes (Aharonian et al. 2004), has generated further theoretical activity. Of general interest and import – given the GC constitutes the nearest example of a galactic nucleus – is the question concerning the sites and mechanism(s) by which particles are accelerated to TeV energies and beyond in the dynamical center of our Galaxy.
Despite the fact that the GC TeV gamma-ray source is a point-like object for HESS, the PSF of the instrument and the extremely crowded and complex nature of the region (as evidenced by the complex radio morphology (Law et al. 2008)) do not allow the unambiguous identification of the source(s) of gamma-ray emission. With the latest data, however, it is possible to place the center-of-gravity of the TeV point source within the central of the Galaxy (Acero et al. 2010), leaving only a handful of possible sources. These include the central black hole itself, Sgr A* (Aharonian & Neronov 2005a; Liu et al. 2006); a plerion discovered within the central few arcseconds of the Galaxy (Wang et al. 2006; Hinton & Aharonian 2007), a putative ”black hole plerion” produced by the wind from Sgr A* (Atoyan & Dermer 2004), and the diffuse pc region surrounding Sgr A* (Aharonian & Neronov 2005b; Ballantyne et al. 2007, 2010).
Given the above background, we consider here the further insights now possible in light of the Fermi -LAT observations of the GC region. In particular, since the PSF of Fermi above GeV is similar to that of HESS, it is possible to explore a quite broad energy interval of relativistic particles localized in this region.
First 11 months of Fermi observations of the GC were presented by J.Cohen-Tanugi on behalf of Fermi LAT collaboration during the 2009 Fermi Symposium. In this work, the authors argued that the Fermi source 1FGL J1745.6-2900 and the HESS source J1745-290 are spatially coincident. Also, they derived an energy spectrum of the Fermi source till 100 GeV and concluded that to match the HESS spectrum either a high-energy break or a cut-off is required.
In this work we analyze 25 months of Fermi LAT data. In addition to the central GeV source and other reported sources, our analysis reveals four new sources of GeV gamma-rays located in this region. With the spectral information from both Fermi and HESS in hand, we model below the production of gamma-rays from the inner GC due to hadronic interactions of protons accelerated within the central black hole and diffusing into the surrounding interstellar medium.
2. Data Analysis and Results.
The large area telescope (LAT) on board the Fermi satellite is a pair-conversion gamma-ray detector operating between 20 MeV and 300 GeV. The LAT has a wide field of view of 2.4 sr at 1 GeV, and observes the entire sky every two orbits (3 hr for a Fermi orbit at an altitude of 565 km; full details of the instrumentation are given in Atwood et al. (2009)). The data used for our analysis are based on the first 25 months of observations (August 4, 2008 – August 18, 2010).
The data analysis was performed using the LAT Science Tools package with the P6_V3 post-launch instrument response function (Rando & et al. 2009). The standard event selection for source analysis, resulting in the strongest background-rejection power (diffuse event class) was applied. In addition, photons coming from zenith angles larger than were rejected to reduce the background from gamma rays produced in the atmosphere of the Earth. The analysis was further restricted to the energy range above 100 MeV, because below this energy effective area becomes very small and the residual uncertainty in the instrumental response is significant.
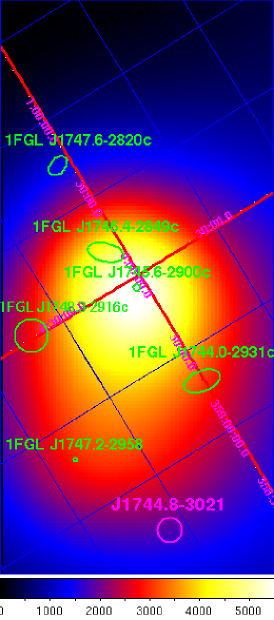
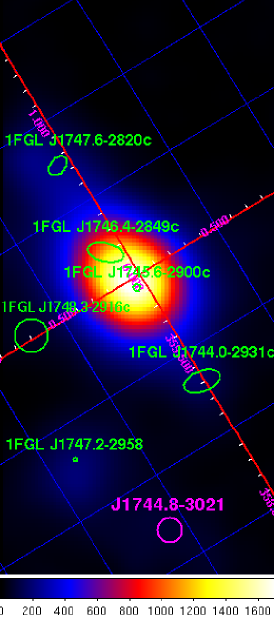
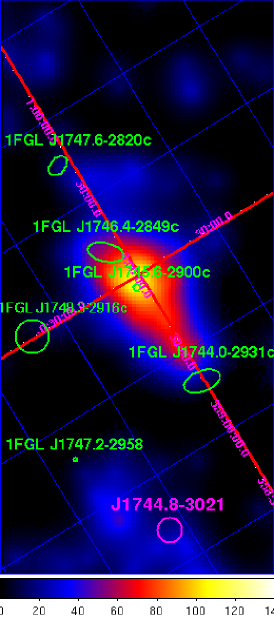
In order to take into account the broad point spread function (PSF) at low ( MeV) energies, we constructed a sequence of test statistic (TS) images of the region around the Sgr A*. In producing TS images, we used the gttsmap tool with a tolerance parameter of and a bin size in each map of . Finally, after subtracting the 19 known sources from the one year Fermi catalogue (1FGL) which happen to be within the selected region, we found four new sources, which are listed in the Table 1, in the residual images. One of these sources (indicated as J1744.8-3021) – shown in magenta in Figure 1 – lie within the area around the GC. This source coincides spatially with known HESS source HESS J1745-303 and EGRET source 3EGJ1744-3011.
| RA | Dec | TS |
|---|---|---|
| (J2000.0) | (J2000.0) | |
| 264.906 | -28.555 | 331 |
| 266.210 | -30.360 | 424 |
| 270.060 | -30.091 | 189 |
| 270.697 | -30.626 | 192 |
In order to construct a light-curve for 1FGL J1745.6-2900, we used a spectral method by selecting data in 300 MeV–100 GeV energy range and fitting all known sources, selected as above, with a single power law model. Afterwards, we split the whole time interval into 25 equal time bins and fit source spectra by fixing their slopes to the best-fit value obtained over the entire time period, leaving the source normalization as a free parameter. The normalization of the Galactic and extra-galactic background was also left as a free parameter. The resulting light-curve is shown in Figure 2 and is relatively stable and does not show any statistically significant variation. The averaged flux is equal to counts cm-2 s-1, with a reduced for 24 degrees of freedom.

Spectral fitting was performed within 100 MeV–300 GeV energy range with the gtlike tool. The spectrum in 100 MeV–300 GeV energy range can be fitted by a power law with a slope of and a flux normalization of cm-2 s-1 MeV-1 at 100 MeV. We also attempted to split the spectrum into two different energy bands, and found that the fitted slope is equal to in 300 MeV–5 GeV energy range, and in 5 – 100 GeV energy range. The errors given above are statistical errors and represent the 1 deviation. Thus the slope of the Fermi spectrum above several GeV is significantly steeper than the spectrum reported by the HESS collaboration at TeV energies (, (Aharonian et al. 2009). Note that at low energies, Fermi has a very broad PSF, rapidly moving from 4∘ at 100 MeV to 2∘ at 300 MeV. Thus, taking into account the possible source confusion in the region, one should treat the first point in the spectrum (100–300 MeV) with caution.
3. Modeling
As proposed in Aharonian & Neronov (2005b), a significant fraction of the protons accelerated near the black hole may enter the surrounding gaseous environment and initiate VHE gamma-ray emission through neutral pion production and subsequent decay. The efficiency of the process, and the energy spectrum of resulting gamma-rays depends not only on the protons’ injection rate and the ambient gas density, but also on the speed of proton transport into the surrounding medium (Aharonian & Neronov 2005b; Ballantyne et al. 2007, 2010). To explain the gamma-ray spectrum reported by the HESS collaboration, Aharonian & Neronov (2005b) assumed that relativistic protons with a power-law spectrum possessing a spectral index of are injected into the dense gaseous environment surrounding the central black hole. The diffusion coefficient, , was assumed to have a power-law dependence on energy of the form GeV cm2 s-1. For the cosmic ray diffusion in the Galactic disk and , but of course the diffusion coefficient in the GC could be quite different. In Aharonian & Neronov (2005b) the parameter was assumed to be in the range of 0.5–1. In the model of Ballantyne et al. (2007, 2010) the propagation is treated using the ray-tracing technique. They found that in order to reproduce in their model the reported energy distribution of TeV gamma-rays, the spectrum of protons should be hard with a spectral index . Such an exceptionally hard injection spectrum of protons implies a very strong energy dependence of the character of propagation of protons which, within the formalism of diffusion, would require a diffusion coefficient with .
Given that the VHE emission detected by HESS and Fermi can be localized to within the central several arcminutes then, for a GC distance of 8 kpc, the linear size of the production region of VHE gamma-rays can be as large as 10 pc. Continuum X-ray and radio observations of the central 10 pc region of the Galaxy show a complex environment with many unique structures (Law et al. 2008; Crocker et al. 2010). For simplicity in this paper we assume that the supermassive black hole in the center of our Galaxy is surrounded by a shell of a dense matter with a density, normalized to cm-3 at 1 pc radius, with either constant or radial dependence. The inner and outer radii of this shell are parameters in our model. Another relevant parameter is the time evolution of the proton injection. Although one can treat it as a quasi-stationary process, in fact the proton injection can be dominated by one or several flares that occurred in the past in Sgr A*. In this context, one should mention the morphological interpretation of the diffuse gamma-ray emission observed by HESS from the central 200 pc region of GC, which relates the positive detections of gamma-rays from giant molecular clouds in GC to a putative ”proton” flare that occurred in Sgr A* in the past, 10,000 years ago or so (Aharonian et al. 2006). The detection of reflected X-ray emission from the Sgr B2 cloud is another, more direct piece of evidence about the short flaring activity of Sgr A* a few hundred years ago (Sunyaev et al. 1993; Koyama et al. 1996, 2008; Revnivtsev et al. 2004; Terrier et al. 2010).
In the standard diffusion approximation the propagation of particles is described by the diffusion equation (Ginzburg & Syrovatskii 1964) which, in the spherically symmetric case, reduces to the form:
| (1) |
where is the space density of relativistic particles with energy , at instant being a distance from the source; is the continuous energy loss rate; is the injection rate; and is the energy-dependent diffusion coefficient. We have assumed here, for simplicity, that is independent of and has a power-law dependence on energy as stated above. The solution of equation (1) can be written as (Syrovatskii 1959):
| (2) |
where the propagator, , is defined as:
| (3) |
and
| (4) |
In equation (4) is the energy that a cooled particle has at time , if its initial energy was .
Formally, the diffusion equation does not contain information on how fast a particle may propagate. Since Eq.(1) does not prevent an artificial ”superluminal motion” (), we follow the phenomenological approach proposed by Aloisio et al. (2009) who introduced a propagator, in the form:
| (5) |
where is the Heaviside step function, , is modified Bessel function of the second kind, and is defined as:
| (6) |
In the low-energy regime (i.e., ), the propagator given by Eq.(5) reproduces the standard treatment of diffusion, whilst in the high-energy regime () it describes particles that move in a rectilinear fashion. Here is the energy at which Eq. (1) allows diffusion with the speed of light
| (7) |
Due to the energy dependence of the diffusion coefficient, proton propagation will be quite different at low as compared to high energies. We have explored how this plays out in the GC environment. The result presented in Figure 3 shows the change of the radial distribution of protons as a function of energy. We have determined the proton distribution after 300 years of continuous injection into the interstellar medium of density cm-3 within a region of radius pc. The initial spectrum of protons was assumed to have a power-law distribution with an exponential cutoff, TeV.
It can be clearly seen from Figure 3 that, whilst at 10 TeV the particles pass through the region in an almost rectilinear fashion, at lower energies, protons propagate diffusively. An explanation for the lack of low-energy protons at high radii can be found in the fact that these particles have too low an escape velocity to travel that far in a given time.
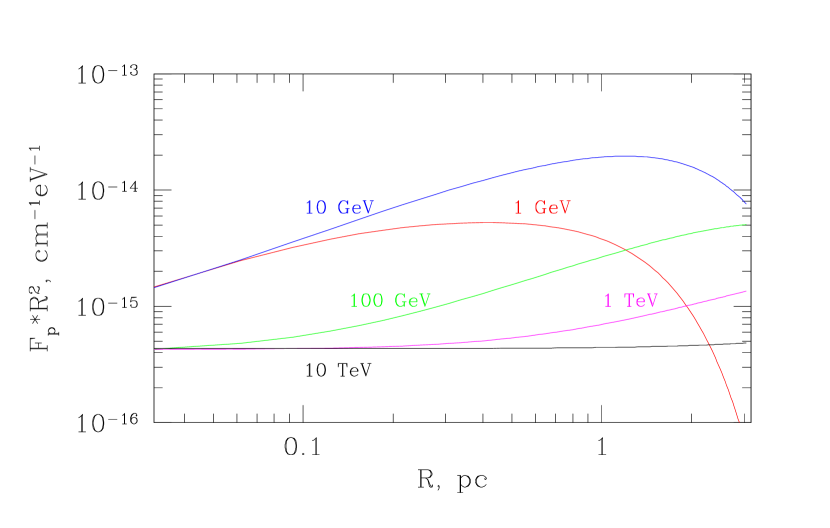
The spectrum of the protons integrated over the gamma-ray production region (see Figure 3) is shown in Figure 4. Photons produced by the interaction of relativistic protons with such an energy distribution fit both Fermi and HESS data well. At low (GeV) energies, the diffusion radius is smaller than the region so that protons are accumulated within the region and, given the almost energy-independent cross-section, mirror the spectrum of the injected protons. On the other hand, at TeV energies protons begin to propagate in a rectilinear mode and will have again the form of the injected spectrum, albeit at a lower flux level. Protons with an intermediate energy have a much steeper, diffusion-processed spectrum representing the transition between the two extremes. The spectral shape of the highest energy gamma-rays is not affected by the propagation effects. Therefore in order to match the spectrum at highest energies reported by HESS (Aharonian et al. 2009), we assumed an exponential cut-off in the proton spectrum and fix its position at 100 TeV.

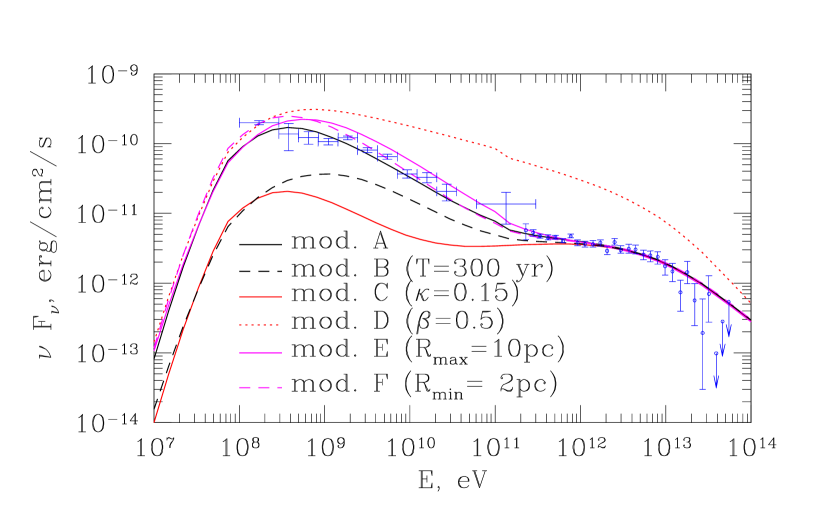
Below, we fit parameters which represent the particle injection spectrum, the propagation of the injected protons, and the geometry of the interstellar medium. It is instructive to systematically examine the influence of these model parameters on the resulting spectrum. To do this we begin with years of injection of relativistic protons with a spectrum of the form TeV into a 3 pc radius region filled by an interstellar gas of constant density, cm-3. The injection rate was taken equal to erg/sec. The diffusion parameters were chosen as , in order to reproduce the combined Fermi and HESS spectrum. The photon spectrum resulting from this parameter set (model A) is shown in Figure 5. The other curves in Figure 5 illustrate the effect of change of a single parameter, while all others are fixed to the values used in model A.
Figure 5 corresponds to the case of a source active for only 300 years (model B). This change does not affect high energy particles, traveling rectilinearly, because their escape time is years, much shorter then the injection time. These particles fully fill the region and their density is the same as in the case of model A. The diffusion time at low energies (1 TeV in this case), however, is much longer (viz. years at 1GeV). Thus, 300 years will be not enough for low-energy particles to travel to the outer regions of the shell, and the total spectrum is expected to be harder with respect to model A. Thus, in this parameter set, whilst the radiation does not differ from our heuristic case at high energies, at lower energies there are necessarily fewer gamma-rays.
Models C and D in Figure 5 show what occurs when the diffusion parameters and are changed. If one increases the diffusion coefficient by a factor of 10, then by the same factor, the diffusion time of the low-energy particles is decreased, leading to a corresponding reduction in the intensity of the gamma-ray emission. If one changes the energy dependence of the diffusion by decreasing by a factor of two, then the transition of the particles propagation from diffusion to rectilinear propagation occurs at much higher energies ( has dependance, see equation (7), and reaches PeV energy in this case). Thus the emission increases at all energies and the spectral form changes due to a larger influence of high energy particles.
Models E and F in Figure 5 show the change of the photon spectrum due to the change of the geometry of the region. The corresponding curve in figure corresponds to a shell geometry with an outer radius of pc (as compared to the 3 pc radius considered in the other models). Using this particular geometry causes the overall normalization of the resulting spectrum to increase (a factor of 0.25 was applied to this spectrum for easier comparison in the production of Figure 5) due to the increase in size of the gamma-ray production region. Additionally, the ‘bump’ at lower energies becomes wider, since the energy at which particles transition from the diffuse to the rectilinear propagation regimes increases as , and thus the larger the radius, the larger the number of ’intermediate’, GeV, energy particles that can be accumulated.
The effect of the shell volume is clearly seen in the case when the value of the inner radius of the disk is changed. Model F in Figure 5 is for a shell with inner radius pc and outer radius pc. In this case the overall normalization of the resulting spectrum decreases (in Figure 5 a factor of 3.3 has been applied to this spectrum in order to more easily aid the comparison to other models), but the low-energy bump is still wider than in the case of a shell with no hole (i.e. an oblate spheroid). This is due to the fact that removing the inner part of the shell mostly diminishes the soft photon emission, effectively increasing the relative number of more energetic ones.
Finally note that the sharp drop of gamma-ray spectra below 1 GeV is the result of the kinematics of pion production at p-p interactions, and therefore does not depend on the model parameters.
| model | nH | Q0 | Rmin | Qf | ||
|---|---|---|---|---|---|---|
| 1039erg/s | pc | 1039erg/s | ||||
| const | const | 0.02 | 0.95 | 6 | 0 | 0 |
| 0.002 | 0.75 | 0.1 | 0 | 0 | ||
| flare | const | 0.7 | 0.5 | 8 | 0 | 8000 |
| shell | const | 0.02 | 0.95 | 8 | 1 | 0 |
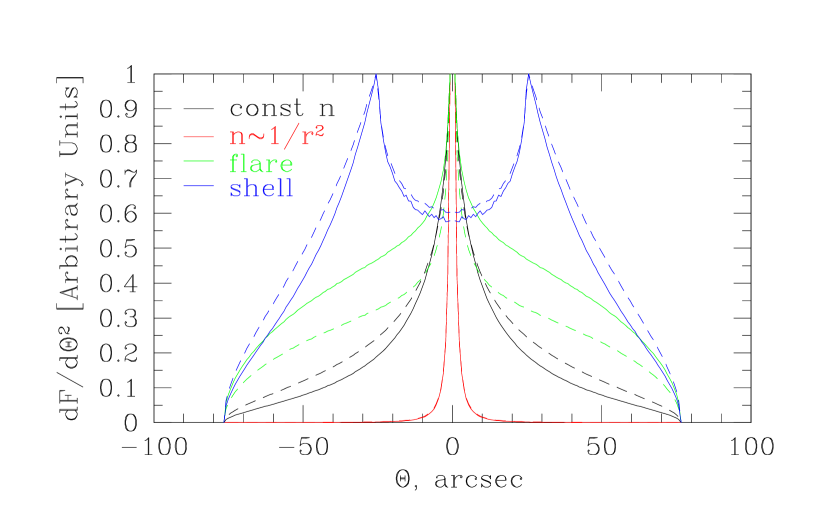
The radial distribution of photons is also highly dependent on the model parameters. Figure 6 shows the brightness profile of the inner 3 pc after years of the constant injection at energies between 100 MeV–1 GeV (solid lines) and 1 GeV–10 GeV (dashed lines). For all models the constant source was active for 104 years. The initial spectrum of protons is assumed to be a power-law with an exponential cutoff, TeV. The medium density at R=1pc was assumed to be equal to cm-3.At higher energies particles pass through the region almost rectilinearly and the region will appear as a point-like source of gamma-rays to Fermi . As labeled in Figure 6, different curves correspond to different model parameter sets in terms of the ambient matter distribution and injection. For all models in Figure 6, parameters, given in Table 2, were chosen so that the resulting integrated emission accurately reproduces the Fermi and HESS data, and the resulted profiles were normalized to the maximum value to aid comparison.
Geometrically, the solid line represents the case of constant density and exhibits a broader profile at higher energies (line). If instead, one models the region with a density falling off proportional to a profile, the resulting profiles are thinner and are represented by the red solid and dashed lines, which almost coincide on the figure. The profile is more centrally peaked in the latter case, since the matter is more concentrated in the center and so the photon flux will originate mostly from this region.
The green solid and dashed lines show the profile created if, in addition to a constant source, there was also a flare which occurred 300 years ago (the injection rate in the Table 2 corresponds to a flare of length 10 years). In order to match observational data in this case, a larger diffusion coefficient had to be assumed, which inevitability leads to a larger diffusion radius and – correspondingly – to a wider profile. Finally in Figure 6 we show the brightness profiles corresponding to a shell geometry. In this case the profile has a maximum at a radius of the inner shell.
4. Discussion
The spectral properties of the very high energy emission from the GC differs considerably from that at lower energies: whilst the GC is known to be variable at X-rays and near-IR wavelengths, no variability has been detected either by HESS, or by Fermi. This seeming duality has a natural explanation if the low energy emission is generated very close to the central black hole, while the gamma-ray emission originates from a much larger region and is emitted during the diffusion of the relativistic protons through the interstellar medium surrounding the central black hole. In such a case, the very high energy emission would only reflect (with a delay) major flares originating from the central source. As remarked above, one interpretation of the distribution of the diffuse, TeV -ray emission relative to the molecular clouds in the central pc of our Galaxy, is that a central CR proton source flared about years ago (Aharonian et al. 2006). In the previous section we showed that our model is able to reconstruct data if we assume a constant injection of relativistic protons for years (see Figure 5). This time is higher than the diffusion time for the used set of parameters and thus the obtained photon energy spectrum is effectively steady state.
The observations of reflected X-radiation from the cloud Sgr B2 located at a distance of 100 pc from Sgr A* suggests that a few hundred years ago there was an increase of X-ray luminosity of Sgr A* (Sunyaev et al. 1993; Koyama et al. 1996, 2008; Revnivtsev et al. 2004; Terrier et al. 2010). In our modeling, we checked that we are able to explain the data as a result of a constant injection of protons over three hundreds years. We found that if one assumes an injection rate of protons of erg/s, and takes , (the resulting radial distribution of protons for this model is shown in Figure 3), then the resulting emission is in good agreement with the observations. Our model is able to self-consistently explain different spectral indices at GeV and TeV energies by the different effective escape velocities of the protons. While high energy protons, producing TeV photons, escape quasi-rectilinearly without spectral deformation, as, indeed, do the particles fully trapped at the lowest energies, the particles with intermediate energies are affected by diffusion, but not fully trapped and their spectrum becomes much steeper providing the transition between two extreme cases.
Recent monitoring of the Sgr B2 cloud with X-ray instruments shows flux variability on time scales of 10 years (Terrier et al. 2010). This variability can be naturally interpreted as a measure of the flare duration. Although the X-ray luminosity and proton acceleration in Sgr A* should not necessarily correlate, it is interesting to explore also the scenario when we deal with a flare of proton acceleration and injection into the interstellar medium on timescales of years.
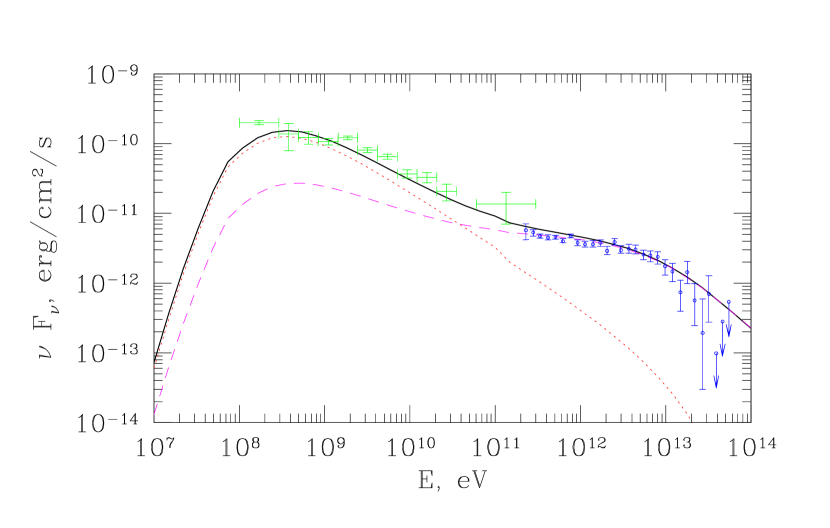
In Figure 7 we compare the spectra of gamma-ray emission resulting from realization of three different scenarios: (i) a proton flare of 10 years duration that occurred 300 years ago, (ii) a constant source that switched on years ago, and (iii) a proton flare on top of the constant source, namely the superposition of (i) and (ii). To fit the data, we took the size of the gamma-ray emission region to be pc, parameters of the diffusion coefficient , , and initial proton spectrum of TeV, with the proton injection rate of erg/s for the constant source and erg/s for the flare.
For this parameter set, the 300 year old flare cannot have a strong impact on the observed TeV spectrum at this point in time, since most of the high energy protons from the flare have already escaped. On the other hand, the emission at GeV energies is produced by protons from the flare which are still trapped by diffusion in the gamma-ray production region. To explain the TeV data we need much slower diffusion or a fresh injection of protons, for example contributed from a very recent flare, or by the quasi-steady component of protons. Actually the form of TeV emission doesn’t depend on the age of the source if it exceeds years. The case of superposition (solid line) of the flare (dashed line) and persistent (dotted line) components of protons is shown in Figure 7. For the chosen parameters, the GeV energy range of gamma-rays is dominated by the flare component of protons, while the TeV gamma-rays are contributed mainly by protons from the persistent component.
Thus, we are able to reproduce the observed broad-band spectrum of gamma-rays in different ways. In all cases the required injection rate is well below the Eddington limit of the black hole in GC, erg/s. The total energy required in relativistic protons currently trapped in the gamma-ray production region varies from to erg for different models. This energy can be injected in very different ways: in reality there has probably been a series of flares with different energetic signatures occurring throughout the life-time of the central source.
The observed spectral and temporal properties of the GC at various wavebands are not enough to constraint all the parameters in our model. Additional information can be extracted, in principle, from the gamma-ray morphology of the inner arcminute region: above, we showed that different set of parameters describing the observed spectral properties result in very different radial profiles (e.g., Figure 6). However, with the angular resolutions of the current space- and ground-based detectors, we cannot distinguish between the different radial profiles. Fortunately, such information can be recovered by observations of synchrotron emission of secondary electrons from decays of charged pions, accompanying the production of gamma-rays from decays of neutral muons. Since through this channel the electrons and gamma-rays are produced with similar energy distributions, we can connect directly the frequency of synchrotron photons of secondary electrons with the energy of the “genetically” connected gamma-rays:
| (8) |
where the magnetic field is normalized to the probable minimum value expected in the region (Crocker et al. 2010).
Thus, in the first approximation, the morphology of the synchrotron radiation of ”hadronic” origin should be similar to the morphology of GeV gamma-rays. While at sub-GHz frequencies, GC radio photons are attenuated by free-free absorption in dense Hii regions between the GC and the Earth (see Crocker et al. 2010), the synchrotron emission at GHz frequencies arrives without significant attenuation. The emissivity of synchrotron radiation of secondary electrons in the inner few pc of the Galaxy has been studied by Crocker et al. (2007) , based on a model where the interactions of protons, diffusing away from an assumed central source, supply the observed, point-like TeV signal (Ballantyne et al. 2007). They then compared the predicted synchrotron emission to the GHz radio frequency spectrum, and found that essentially all the diffuse non-thermal GHz radio emission from the central parsecs of the Galaxy could be explained as due to emission of secondary electrons (and positrons). Therefore we anticipate that the new Fermi data combined with available radio measurements, should allow us to constrain significantly the parameter space of models positing that the GeV and TeV gamma-ray emission of the GC is due to hadronic interactions in the central few parsecs of GC. Analysis of the morphology of radio emission holds out particular promise here. The results of such an analysis are beyond the scope of this paper and will be presented elsewhere.
It should be noted that cosmic ray electrons produce photons not only in the radio domain; their bremsstrahlung emission can be an important source of high energy gamma-rays. Comparing the synchrotron and bremsstrahlung cooling times:
| (9) | |||
| (10) |
we conclude that bremsstrahlung losses dominates at energies below:
| (11) |
This suggests that bremsstrahlung will dominate at energies less than GeV for fiducial and values.
The relative importance of electron bremsstrahlung in producing the observed gamma-ray emission, is characterized by the ratio of cooling times of electrons and protons associated with the bremsstrahlung and neutral pion production, respectively: , where is the electron to proton energy density ratio (Aharonian 2004). Hence, if the ratio of protons to electrons is , then -decay gamma-rays dominate over bremsstrahlung. The contribution of electron bremsstrahlung to TeV gamma-rays is quite limited because of the severe energy losses of very high energy electrons due to the synchrotron and IC losses.
Finally, we note that the Fermi data presented here can not be explained by IC models proposed by Atoyan & Dermer (2004) and Hinton & Aharonian (2007). While these models are in a good agreement with HESS data, they predict that the energy flux in the GeV part of the spectrum should be smaller than in TeV range, apparently contrary to the Fermi observations.
5. Summary
We have analyzed 25 months of Fermi data on the GC region. The Fermi LAT source 1FGL J1745.6-2900 lies within the error box of HESS source J1745-290. We found that, while below 5 GeV, the spectrum of 1FGL J1745.6-2900 has a photon spectral index similar to the HESS source, the spectrum at higher energies is better described by a steeper spectral index. We have formulated a model which produces a photon spectrum that can naturally explain the observed broad-band gamma-ray emission. This model considers the hadronic interactions of relativistic protons which, having diffused away from a central source, presumably the central black hole, fill the inner few parsecs of our Galaxy. We have explored the parameter space of our model, in terms of the geometry, characteristics of the diffusion coefficient, and injection rate history.
We have shown that the available spectral information can be well described with different sets of model parameters and that additional information is required to distinguish model scenarios. Such information could be obtained from the spatial distribution of the observed gamma-ray emission; however, the required arc-second resolution cannot be reached by gamma-ray telescopes. Luckily, synchrotron emission from the secondary electrons and positrons expected in our model may be detected by radio telescopes which possess an angular resolution high enough for the purposes of distinguishing between model parameters.
References
- Acero et al. (2010) Acero, F., Aharonian, F., Akhperjanian, A. G., et al. 2010, MNRAS, 402, 1877
- Aharonian et al. (2009) Aharonian, F., Akhperjanian, A. G., Anton, G., et al. 2009, A&A, 503, 817
- Aharonian et al. (2004) Aharonian, F., Akhperjanian, A. G., Aye, K., et al. 2004, A&A, 425, L13
- Aharonian et al. (2006) Aharonian, F., Akhperjanian, A. G., Bazer-Bachi, A. R., et al. 2006, Nature, 439, 695
- Aharonian & Neronov (2005a) Aharonian, F. & Neronov, A. 2005a, ApJ, 619, 306
- Aharonian & Neronov (2005b) Aharonian, F. & Neronov, A. 2005b, Ap&SS, 300, 255
- Aharonian (2004) Aharonian, F. A. 2004, Very high energy cosmic gamma radiation : a crucial window on the extreme Universe (River Edge, NJ: World Scientific Publishing)
- Aloisio et al. (2009) Aloisio, R., Berezinsky, V., & Gazizov, A. 2009, ApJ, 693, 1275
- Atoyan & Dermer (2004) Atoyan, A. & Dermer, C. D. 2004, ApJ, 617, L123
- Atwood et al. (2009) Atwood, W. B., Abdo, A. A., Ackermann, M., et al. 2009, ApJ, 697, 1071
- Ballantyne et al. (2007) Ballantyne, D. R., Melia, F., Liu, S., & Crocker, R. M. 2007, ApJ, 657, L13
- Ballantyne et al. (2010) Ballantyne, D. R., Schumann, M., & Ford, B. 2010, ArXiv e-prints
- Crocker et al. (2007) Crocker, R. M., Jones, D., Ballantyne, D. R., & Melia, F. 2007, ApJ, 664, L95
- Crocker et al. (2010) Crocker, R. M., Jones, D. I., Melia, F., Ott, J., & Protheroe, R. J. 2010, Nature, 463, 65
- Ginzburg & Syrovatskii (1964) Ginzburg, V. L. & Syrovatskii, S. I. 1964, The origin of the Cosmic Rays (Pergamon, Oxford)
- Hinton & Aharonian (2007) Hinton, J. A. & Aharonian, F. A. 2007, ApJ, 657, 302
- Koyama et al. (2008) Koyama, K., Inui, T., Matsumoto, H., & Tsuru, T. G. 2008, PASJ, 60, 201
- Koyama et al. (1996) Koyama, K., Maeda, Y., Sonobe, T., et al. 1996, PASJ, 48, 249
- Law et al. (2008) Law, C. J., Yusef-Zadeh, F., Cotton, W. D., & Maddalena, R. J. 2008, ApJS, 177, 255
- Liu et al. (2006) Liu, S., Melia, F., Petrosian, V., & Fatuzzo, M. 2006, ApJ, 647, 1099
- Rando & et al. (2009) Rando, R. & et al. 2009, ArXiv e-prints
- Revnivtsev et al. (2004) Revnivtsev, M. G., Churazov, E. M., Sazonov, S. Y., et al. 2004, A&A, 425, L49
- Sunyaev et al. (1993) Sunyaev, R. A., Markevitch, M., & Pavlinsky, M. 1993, ApJ, 407, 606
- Syrovatskii (1959) Syrovatskii, S. I. 1959, Astron. Zh., 36, 17
- Terrier et al. (2010) Terrier, R., Ponti, G., Bélanger, G., et al. 2010, ApJ, 719, 143
- Wang et al. (2006) Wang, Q. D., Lu, F. J., & Gotthelf, E. V. 2006, MNRAS, 367, 937