Evidence for Evolution Among Primordial Disks in the 5 Myr Old Upper Scorpius OB Association
Abstract
Moderate-resolution, near-infrared spectra between 0.8 and 5.2 m were obtained for 12 late-type (K0–M3) disk-bearing members of the 5 Myr old Upper Scorpius OB association using SpeX on the NASA Infrared Telescope Facility. For most sources, continuum excess emission first becomes apparent between 2.2 and 4.5 m and is consistent with that produced by single-temperature blackbodies having characteristic temperatures ranging from 500 to 1300 K. The near-infrared spectra for 5 of 12 Upper Scorpius sources exhibit Pa, Pa and Br emission, indicators of disk accretion. Using a correlation between Pa and Br emission line luminosity and accretion luminosity, mass accretion rates () are derived for these sources that range from to 1.5 M⊙ yr-1. Merging the SpeX observations with Spitzer Space Telescope mid-infrared (5.4–37.0 m) spectroscopy and 24 and 70 m broadband photometry, the observed spectral energy distributions are compared with those predicted by two-dimensional, radiative transfer accretion disk models. Of the 9 Upper Scorpius sources examined in this analysis, 3 exhibit spectral energy distributions that are most consistent with models having inner disk radii that substantially exceed their respective dust sublimation radii. The remaining Upper Scorpius members possess spectral energy distributions that either show significant dispersion among predicted inner disk radii or are best described by models having inner disk rims coincident with the dust sublimation radius.
1 Introduction
A fundamental consequence of protostellar collapse is the formation of a viscous accretion disk that transfers gas onto the stellar photosphere. Such disks are the progenitors of planetary systems and their subsequent evolution and ultimate dispersal have extraordinary implications for the formation of planets, orbital dynamics of planetary mass bodies, and the processing of dust grains and volatiles within the disk. The timescale of disk dissipation within the terrestrial region has been reasonably well-established by ground-based (Haisch et al. 2001; Mamajek et al. 2004) and Spitzer Space Telescope (Uchida et al. 2004; Silverstone et al. 2006) observations to be 10 Myr. By inference, planetary systems must be in an advanced evolutionary stage within this period, before significant quantities of gas and dust are depleted from the disk. Disk evolution is expected to proceed from the interior outward (Dullemond & Dominik 2005), however, sub-millimeter and mid-infrared observations by Cieza et al. (2008) suggest that inner disks only begin to dissipate after the outer disk has been significantly depleted of mass.
Pre-main sequence stars exhibiting spectral energy distributions (SED) that are indicative of an optically thin disk interior surrounded by an optically thick outer disk are referred to as transition disk objects (Strom et al. 1989; Najita et al. 2007; Muzerolle et al. 2010). Such disks are suggestive of having experienced significant evolution from the continuous disk structures that are associated with classical T Tauri stars (CTTS). The duration of this transitional phase has been inferred from population statistics of star forming regions to be only of order 105 yr (Hartmann 2009; Luhman et al. 2010). Transition-like SEDs, however, can arise from various pathways and may not be representative of a direct evolutionary sequence from primordial disk to debris disk (Najita et al. 2007). Dust grain growth and mid-plane settling (Dullemond & Dominik 2005), giant planet formation and dynamical clearing (Calvet et al. 2002), disk photoevaporation (Alexander et al. 2006), and the presence of a stellar companion (Ireland & Kraus 2009) have been suggested as disk clearing mechanisms capable of producing transition-like SEDs. An alternate evolutionary path from primordial disk to debris disk has been proposed by Currie et al. (2009), who suggest that disks exhibiting reduced levels of near- and mid-infrared excess emission are indicative of reduced masses of small dust grains at all disk radii. Such homologously depleted disks counter the canonical inside-out disk evolutionary scenario.
The Upper Scorpius OB association is a critically important region for studies of disk evolution. At 145 pc distant, it is among the nearest OB associations to the Sun (Blaauw 1991; de Zeeuw et al. 1999) and has a well-established age of 5 Myr (Preibisch & Zinnecker 1999; Preibisch et al. 2002), when most (80%) optically thick, protoplanetary disks have dissipated (Haisch et al. 2001; Hernandez et al. 2007). Carpenter et al. (2006) conducted a Spitzer 4.5–16.0 m photometric survey of 218 confirmed association members. These sources were compiled from Hipparcos astrometry (de Zeeuw et al. 1999), color-magnitude diagrams and Li I 6708 follow-up observations (Preibisch & Zinnecker 1999; Preibisch et al. 2002), and X-ray detected late-type stars with Li I 6708 follow-up (Walter et al. 1994; Kunkel 1999; Köhler et al. 2000). Given that the membership selection criteria were based upon stellar properties unrelated to circumstellar material, the sample is considered to be unbiassed toward the presence or absence of disks. Carpenter et al. (2006) found that 24 of 127 (19%) K- and M-type stars in their sample exhibit infrared excesses similar to Class II sources in the Taurus-Auriga star forming region. For comparison, Luhman et al. (2010) carried out a comparable Spitzer IRAC and MIPS survey of 348 Taurus-Auriga members, finding that the disk fraction steadily declines from 75% for solar mass stars to 45% for low-mass stars and brown dwarfs (0.3–0.01 M⊙).
To better characterize disk emission among the Upper Scorpius infrared excess stars identified by Carpenter et al. (2006), Dahm & Carpenter (2009) examined Spitzer mid-infrared spectra for a substantial fraction (26 of 35) of these sources: 8 early-type (B+A) stars and 18 late-type (K+M) stars. In general, excess emission among the late-type Upper Scorpius population becomes apparent between 2.2 and 4.5 m, a region sampled only by Two-Micron All Sky Survey (2MASS) band photometry and the Spitzer Infrared Array Camera (IRAC) [4.5] fluxes. Compared to Class II sources in Taurus-Auriga, Dahm & Carpenter (2009) found the disk population in Upper Scorpius to exhibit reduced levels of near- and mid-infrared excess emission and an order of magnitude lower mass accretion rates. The apparent abundance of depleted inner disk systems in Upper Scorpius relative to the number of such objects in Taurus-Auriga led Dahm & Carpenter (2009) to suggest that such disks represent a common evolutionary pathway. Near-infrared spectra spanning the 2.2–4.5 m region, however, were needed to complement the Spitzer IRAC and Infrared Spectrograph (IRS) observations and to isolate the onset of continuum excess emission from the terrestrial disk regions.
To further examine emission arising from the depleted disk interiors of the Upper Scorpius sample, 0.8–5.2 m moderate-resolution spectra for 12 of 18 late-type disk-bearing stars from Dahm & Carpenter (2009) were obtained using SpeX on the NASA Infrared Telescope Facility (IRTF) on Mauna Kea. The SpeX spectroscopy permits the unambiguous detection of continuum excess emission arising from hot dust in the disk interiors of the Upper Scorpius sample. Merging these observations with Spitzer IRS spectra and Multi-band Imaging Photometer for Spitzer (MIPS) 24 and 70 m photometry from Carpenter et al. (2009), the resulting 0.8–70 m SEDs are compared with the two-dimensional, radiative transfer accretion disk models of Robitaille et al. (2006). These models are used to constrain inner disk radii for the observed Upper Scorpius excess sources and to examine their SEDs for evidence of inner disk evolution.
In Section 2 the observed Upper Scorpius sample is described and placed into context with the greater late-type stellar population of the association. Details of the SpeX observations and analysis are also provided. The near-infrared continuum excess spectra and blackbody fits to these spectra are discussed in Section 3. Next (Section 4) accretion luminosities and mass accretion rates are derived for suspected accretors using Pa and Br emission line luminosities. The merged 0.8–70 m SEDs are then compared in Section 5 with the accretion disk models of Robitaille et al. (2006). Constraints for inner disk radii are derived and the effects of mid-plane settling are discussed using the best-fitting accretion disk models. Finally the results of this paper are summarized in Section 6.
2 Observations and Analysis
2.1 The Upper Scorpius Membership Sample
The 12 Upper Scorpius infrared excess sources observed with SpeX were selected from the mid-infrared photometric and spectroscopic surveys of Carpenter et al. (2006) and Dahm & Carpenter (2009), respectively. These sources represent half of the late-type, disk-bearing stars identified by Carpenter et al. (2006) and include all K-type and all M0 through M2-type excess sources. To further place this sample into context with the low-mass stellar population of Upper Scorpius, there are 250 known pre-main sequence stars in the mass range from 0.1 to 2.0 M⊙ (Preibisch & Mamajek 2008; Preibisch et al. 2002). If the infrared excess fraction for late-type stars (19%) derived by Carpenter et al. (2006) is assumed, 48 of these should host primordial disks. The SpeX sample therefore represents 25% of all disk-bearing stars expected among the known late-type association members. Integrating the best-fitting mass function for Upper Scorpius, Preibisch & Mamajek (2008) estimate that the total low-mass (0.1–2.0 M⊙) stellar population of the association exceeds 2400 stars, corresponding to a total disk-bearing population of 450 late-type stars. While the SpeX sample considered here does represent a substantial fraction of the late-type, disk-bearing stars identified by Carpenter et al. (2006), it cannot be considered a statistically significant representation of the total low-mass stellar population of the association.
Given that unresolved companions could provide an explanation for transition-like SEDs (Ireland & Kraus 2008), some knowledge of the binary frequency of the Upper Scorpius late-type stellar population is warranted. Köhler et al. (2000) used speckle interferometry and direct imaging for 118 X-ray selected T Tauri stars in the greater Scorpius-Centaurus OB association to identify companions with separations ranging from 0.13″ to 6.0″. They found a multiplicity fraction of 32.6%, which exceeds the binary fraction of main sequence stars by a factor 1.6, but is slightly lower than that observed in Taurus-Auriga (Köhler et al. 2000). Kraus et al. (2008) found a similar frequency of binary companions among 82 late-type (G0–M4) Upper Scorpius members, 355%. Two of the disk candidates observed with SpeX are established binaries, [PZ99]J161411.1-230536 and ScoPMS 31, resolved by high angular resolution imaging. With projected separations of 32 and 84 AU, respectively (Metchev & Hillenbrand 2009; Köhler et al. 2000), it is unlikely that these stellar companions have significantly influenced the inner disk evolutionary timescales of their primaries. Kraus et al. (2008) observed J160823.2-193001 and J160900.7-190852 using an aperture mask interferometry technique, placing firm upper limits that preclude the possibility of an undetected stellar companion within 5 AU of these stars. The multiplicity fraction among the remaining Upper Scorpius disk-bearing sample is relatively unexplored, but is not expected to deviate significantly from that derived by Köhler et al. (2000) and Kraus et al. (2008) for the pre-main sequence population as a whole.
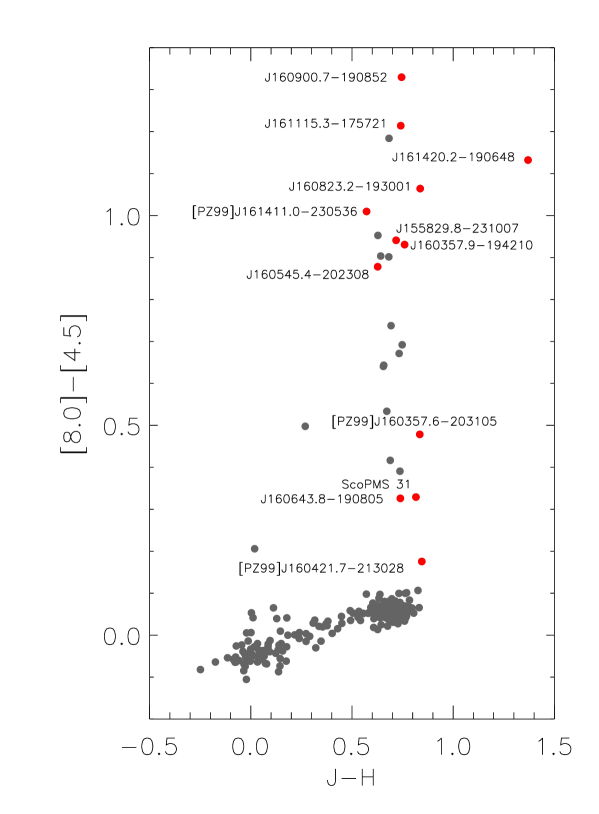
Shown in Figure 1 is the , [8.0][4.5] color-color diagram for the 218 Upper Scorpius members included in the Carpenter et al. (2006) Spitzer IRAC and IRS survey. The 12 sources observed with SpeX span the full range of the 8.0 m excess distribution, from moderate excess (e.g. J160643.8-190805, ScoPMS 31) to significant (e.g. J160900.7-190852). Their masses, derived using the pre-main sequence models of Siess et al. (2000) and assuming a distance of 145 pc, range from 0.25 to 2.0 M⊙. General properties of the stellar sample including spectral type, extinction (), mass, radius, luminosity, and effective temperature are presented in Table 1.
2.2 SpeX Observations
The SpeX (Rayner et al. 2003) observations were made on the nights of 2009 May 20–23 under variable cirrus and seeing conditions (0.6–0.9”). The Upper Scorpius members were observed in the short cross-dispersed SXD (0.84–2.4 m) and long cross-dispersed LXD (2.2–5.2 m) modes for complete near-infrared wavelength coverage. Bright A0 V stars were observed at similar airmasses ( 0.1) and within short periods of time of the program stars for telluric correction. Arc-lamps and internal flat-field exposures were obtained for each set of observations to account for instrument flexure. All observations were made with the 0.5″ slit yielding a nominal spectral resolution of /1500.
The spectra were reduced using Spextool, an IDL-based reduction package that provides for sky-subtraction, flat-fielding, wavelength calibration, and optimal extraction (Cushing et al. 2004). For telluric corrections xtellcor, an extension package of Spextool, was used to create a kernel for the telluric spectrum using a model spectrum of Lyra. xtellcor interpolates over broad hydrogen absorption lines in the spectra of the A0 V stars using a technique developed by Vacca et al. (2003). The orders of the telluric corrected spectra were then combined and the SXD and LXD spectra merged using routines available within Spextool. The resulting continuum levels across all orders and between the SXD and LXD modes were found to be remarkably consistent. The near infrared spectra were then merged with the Spitzer IRS spectra. Details of the Spitzer IRS observations and their subsequent reduction and analysis can be found in Dahm & Carpenter (2009).
3 Near-Infrared Continuum Excess Spectra
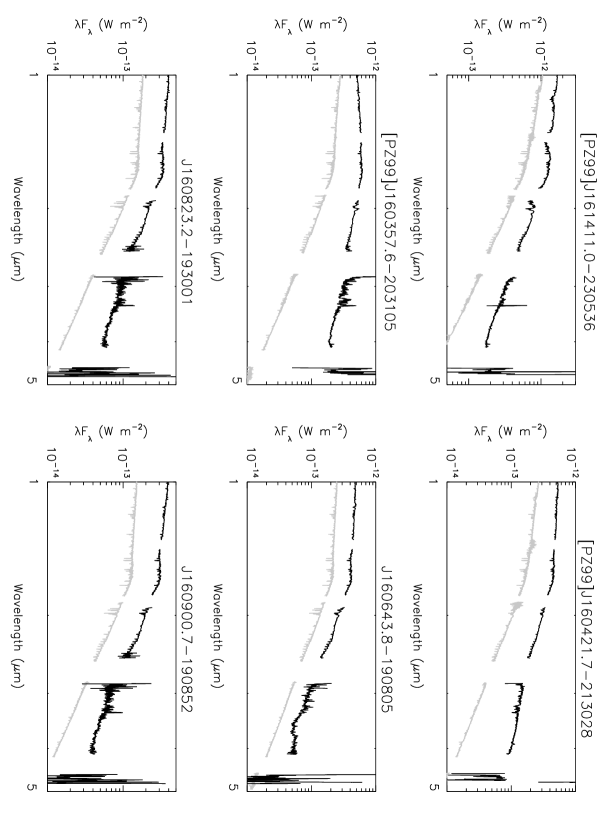
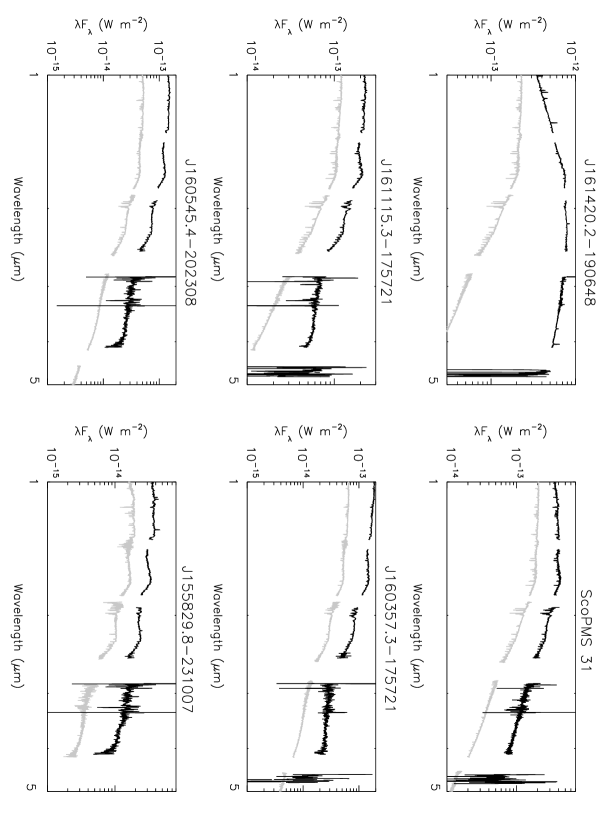
The extinction-corrected, near-infrared (0.84–5.2 m) spectra of the 12 Upper Scorpius sources are shown in Figure 2. Regions of strong telluric absorption (atmospheric transmission 20%) have been excised from the figure. Also shown are the spectra of solar metallicity, main sequence stars of identical or closely matched (1 sub-class) spectral type obtained from the IRTF spectral library (Rayner et al. 2009). These standards have reliable spectral types and are directly linked to the MK classification system. The standard or template spectra are scaled to the flux levels of the Upper Scorpius sources at 1.65 m, near the peak of the stellar SED and where extinction effects are minimized (D’Alessio et al. 1999; Furlan et al. 2006).
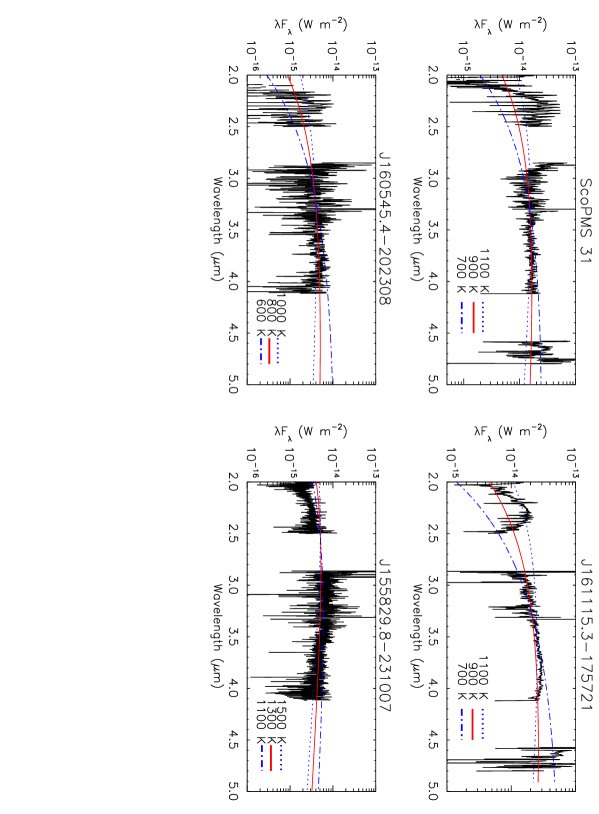
To characterize excess emission attributable to the inner disk rim, the scaled photospheric template spectra are subtracted from the dereddened spectra of the Upper Scorpius sample. The resulting continuum excess spectra are shown in Figure 3. Significant noise is present due to imperfect telluric correction, particularly in the thermal region where the water column varies both temporally and with airmass. In general, the slopes of the continuum excess spectra are increasing from band to 3.5 m before turning over toward redder wavelengths. The shapes of many of the continuum excess spectra are suggestive of having been produced by single-temperature blackbodies. By fitting these excess spectra with Planck functions, the characteristic temperatures of the blackbodies are found to range from the sublimation temperature for silicate dust, i.e. 1400 K, to 500 K. The slope of excess emission, particularly between 2.75 and 4.2 m, was found to be of critical importance when fitting the blackbody profiles to the continuum excess spectra.
To estimate the uncertainty associated with the derived blackbody temperatures, photospheric templates within a range of 1 sub-class of the assigned spectral type were subtracted from the Upper Scorpius spectra. The best-fitting blackbody curves for this range of photosphere-subtracted excess spectra suggest typical uncertainties of 200 K for most sources. The adopted blackbody curve as well as curves representing the limits of uncertainty in the characteristic temperature are shown in Figure 3. The characteristic temperatures of the best-fitting blackbodies are provided in Table 1 and are assumed to be representative of the dust temperatures in the disk interiors.
The disk fractions of Upper Scorpius and Taurus-Auriga differ significantly for the range in stellar masses considered here: 19% for the former (Carpenter et al. 2006) and up to 75% for the latter (Luhman et al. 2010). Muzerolle et al. (2003) used SpeX in LXD-mode to observe 9 CTTSs in Taurus-Auriga, 8 of which span a range of spectral types (G5–M1), luminosities (12.8–0.5 L⊙), and stellar radii (3.6–1.8 R⊙) that are comparable with those of the Upper Scorpius disk sample. Restricting further comparison of these samples to just those sources having similar physical properties (i.e. spectral type, luminosity), the spectral profiles of continuum excess emission of the Upper Scorpius disks are found to differ from those of Class II sources in Taurus-Auriga. For 6 of 9 members in the reduced Upper Scorpius sample, the characteristic temperatures of excess emission fall below the dust sublimation temperature, a condition satisfied by only one member (the binary DQ Tau) of the Taurus-Auriga sample. Furthermore, the excess profiles of J160643.8-190805 and J160357.9-194210, which are not represented in Figure 3, exhibit no distinctive shape, implying minimal continuum excess emission at near-infrared wavelengths. Shallow rises may be present near 3.75 m for these 2 sources, suggestive of warm (500 K) dust emission, but higher SN spectra are needed for confirmation. The excess spectra of J161420.2-190648, [PZ99]J160357.6-203105, J160900.7-190852, and J155829.8-231007 all have characteristic temperatures at or near the dust sublimation temperature, implying that emission arises from dust in close proximity to the host star. Of these sources, all are suspected accretors (Section 4).
4 Accretion Luminosity and Mass Accretion Rates
Dahm & Carpenter (2009) identified 5 Upper Scorpius members in the present sample as probable accretors using the H velocity width criteria of White & Basri (2003): [PZ99]J160357.6-203105 (K5), J160900.7-190852 (K7), J161420.2-190648 (M0), ScoPMS 31 (M0.5), and J155829.8-231007 (M3). The near-infrared spectra of these sources exhibit He I 10830, Pa, and Pa emission and for most, weak Br emission. Shown in Figure 4 are the normalized spectra of these sources centered upon Pa, Pa, and Br. Dahm & Carpenter (2009) used veiling at 6500 Å as well as Ca II 8542 emission line luminosity to estimate mass accretion rates () for these stars. In the near-infrared, Muzerolle et al. (1998) found Pa and Br emission line luminosity ( and ) to be well-correlated with accretion luminosity, . The resulting least-squares fits from Muzerolle et al. (1998) are given by:
loglog (1)
and
loglog (2).
For the 5 suspected accretors in the Upper Scorpius sample, template spectra of identical or similar spectral type from the IRTF spectral library of Rayner et al. (2009) were used to subtract Pa and Br photospheric absorption. Pa and Br line luminosities were then determined using their measured equivalent widths and the extinction-corrected and band magnitudes obtained from the 2MASS point source catalog. The resulting emission line luminosities were then transformed into using the above linear relationships of Muzerolle et al. (1998). The derived values are directly proportional to such that:
(3)
where the stellar mass and radius estimates used are those predicted by the pre-main sequence models of Siess et al. (2000). The factor of () is assigned a value of 0.8, which assumes an inner disk radius () of 5 R∗ (Gullbring et al. 1998). Given the possibility that inner disk radii for the Upper Scorpius sources may exceed those of typical Class II sources in Taurus-Auriga, this value could be underestimated by a factor of 1.25. The derived and values with their associated uncertainties are presented in Table 2. These uncertainties arise from multiple sources: error in the measured equivalent width (assumed to be 20%), spectral type uncertainty when correcting for photospheric absorption (1 sub-class), the uncertainty in each coefficient of the Muzerolle et al. (1998) relationships, and the uncertainty in Rin when determining values.
In general the values derived using and agree reasonably well with each other and with the values from the veiling and Ca II 8542 analysis of Dahm & Carpenter (2009). In summary, 5 of 12 of the Upper Scorpius sample are accreting, providing unambiguous evidence for the presence of gas within the terrestrial regions of these disk-bearing systems.
5 Accretion Disk Model Analysis
To further examine inner disk structure and to constrain inner disk radii for the Upper Scorpius disk-bearing sample, the observed SEDs are compared with those predicted by the accretion disk models of Robitaille et al. (2006). To facilitate the comparison, the flux-calibrated SpeX observations presented here are merged with the Spitzer IRS low-resolution spectra and MIPS 24 and 70 m fluxes taken from Dahm & Carpenter (2009) and Carpenter et al. (2009), respectively. The resulting 0.8–70 m SEDs are well sampled between 2.2 and 24 m, a spectral region dominated by disk emission originating from the terrestrial region.
The Robitaille et al. (2006) grid of pre-computed, two-dimensional radiative transfer models consists of 20,000 young stellar objects in varying stages of evolution and viewed from 10 inclination angles. A total of 14 parameters are randomly sampled that specify stellar (e.g. , , ) as well as disk (e.g. , , ) properties. The models have been successfully applied to the SEDs of 30 spatially resolved Class I and II sources in Taurus-Auriga by Robitaille et al. (2007), including the transition disk objects GM Aur and DM Tau.
The SEDs of 9 Upper Scorpius members were compared to the accretion disk models. The sources excluded from the model fitting analysis were J160545.4-202308 and J155829.8-231007, which were not observed with IRS, and [PZ99]J160421.7-213028, which exhibited significant (factor of 4) mid-infrared variability (Dahm & Carpenter 2009). To compare the observed SEDs with the accretion disk models, fluxes were measured in 30 narrow passbands defined between 0.8 and 37.0 m. The MIPS 24 and 70 m fluxes were also incorporated, with the 70 m fluxes being used to constrain disk emission originating from beyond the terrestrial region.
Two assumptions were made in the model fitting analysis: that all Upper Scorpius members lie between 125 and 185 pc distant, and that foreground extinction is no more than mag, both reasonable assumptions based upon substantial Upper Scorpius literature (e.g. Preibisch & Zinnecker 1999; Preibisch et al. 2002; Carpenter et al. 2006). A range of effective temperatures was defined for each Upper Scorpius source based upon its adopted spectral type and assuming an uncertainty of 1 spectral sub-class. Only models having effective temperatures within this specified range were considered when fitting the observed SEDs. The model fitting program was written in IDL and uses the statistic to evaluate the goodness of fit of each model for each assumed distance, extinction value, and inclination angle. Table 3 lists the range of values considered for each Upper Scorpius source, the number of models included within the specified range, the best-fitting model number, its corresponding , distance, and inclination angle, and the minimum reduced value achieved by the fit.
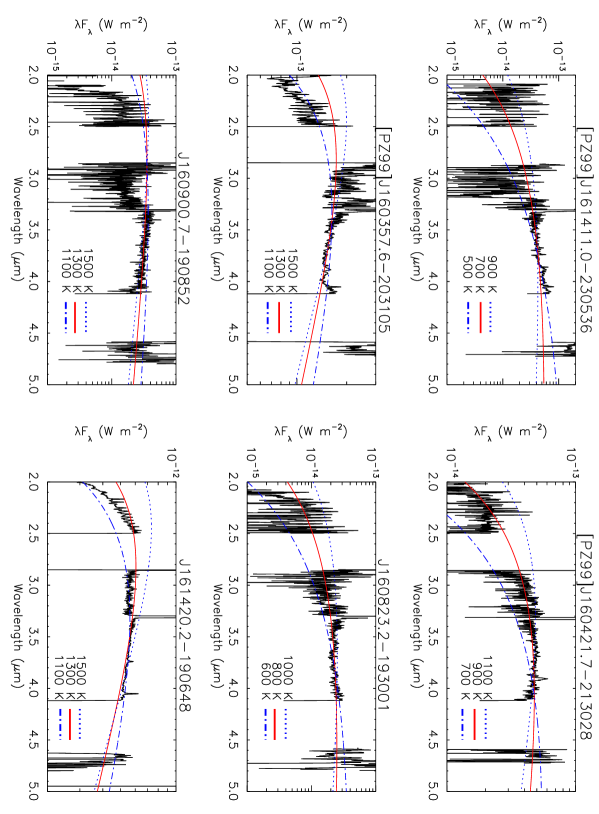
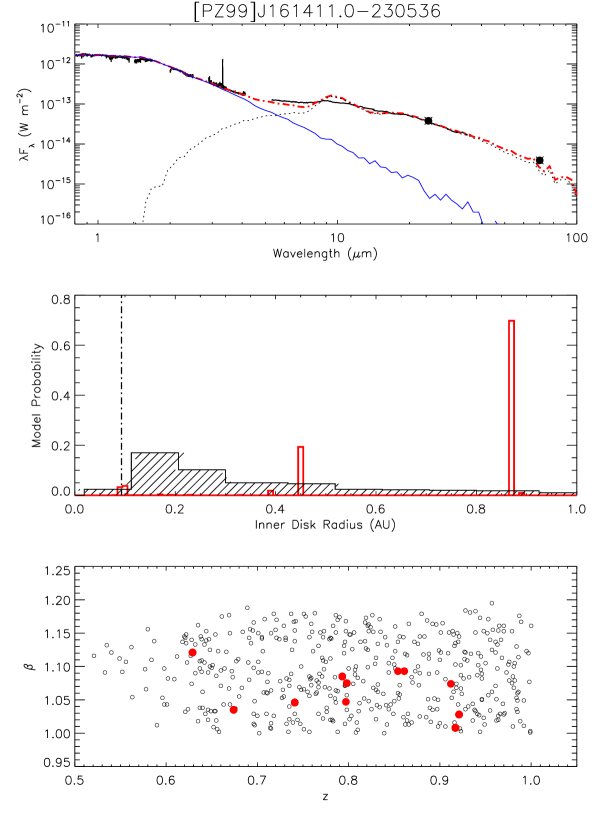
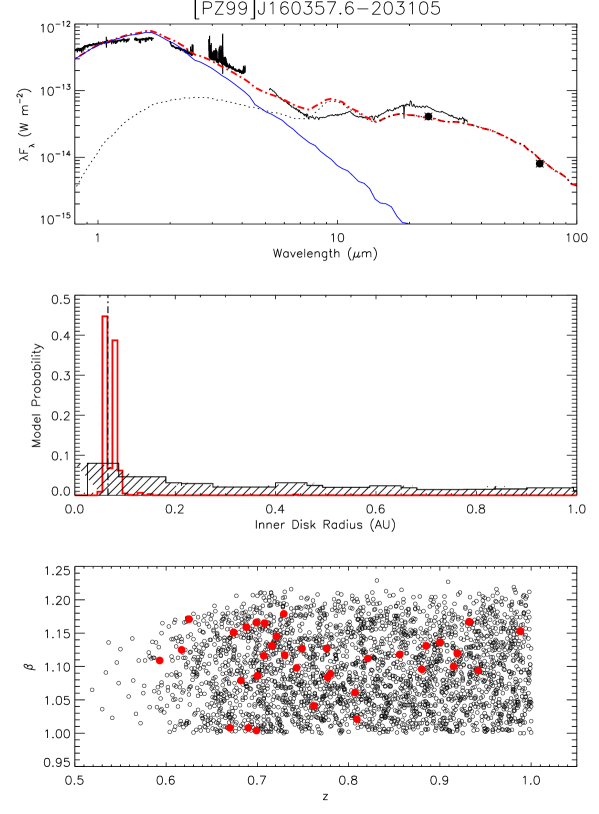
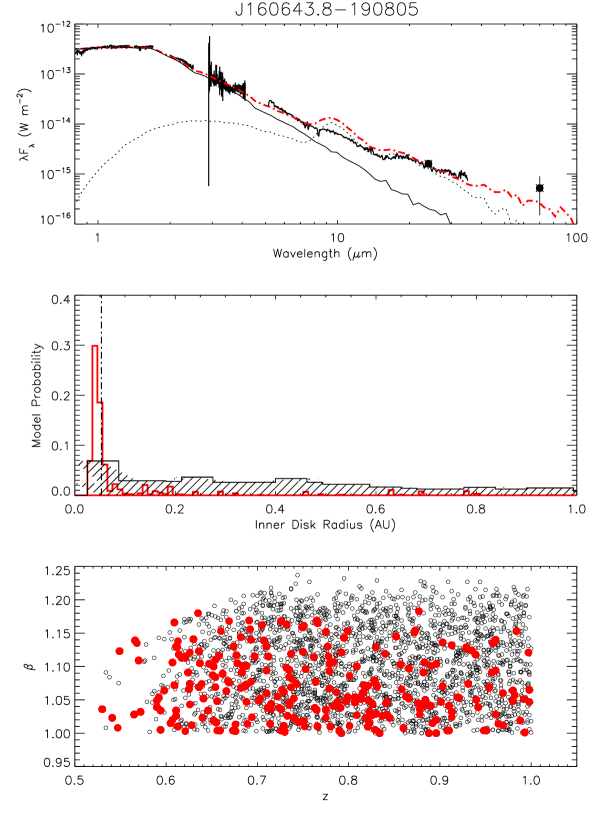
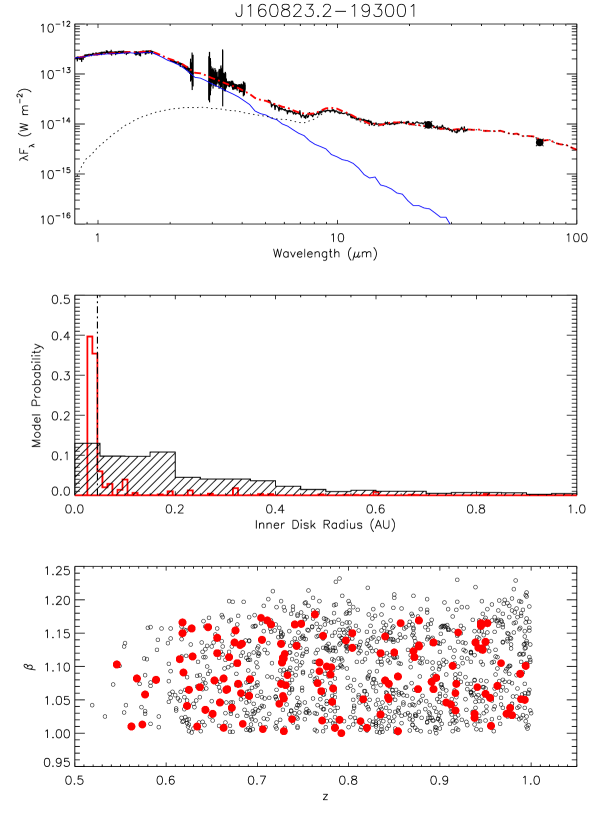
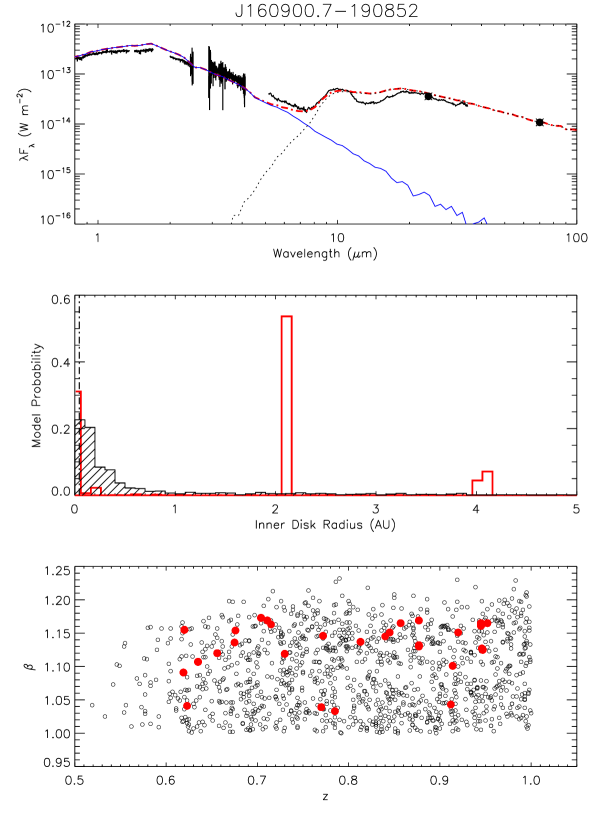
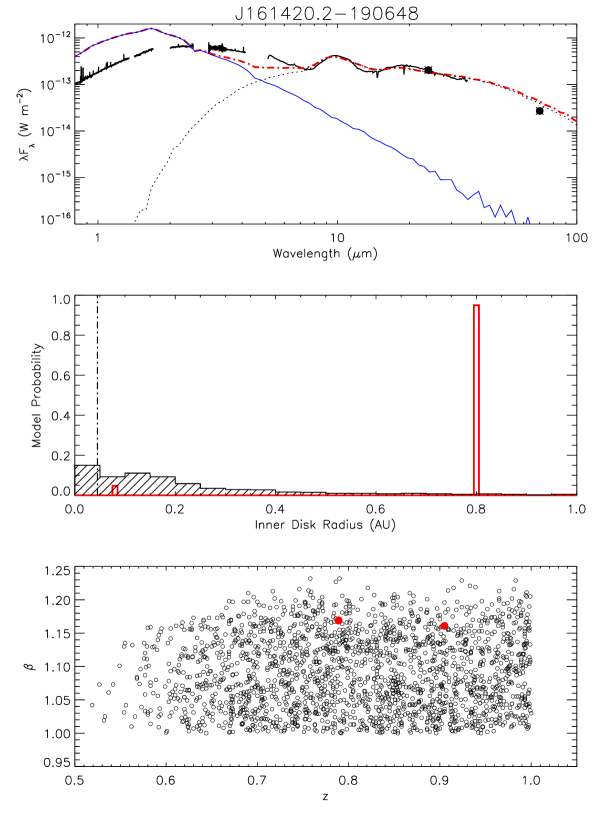
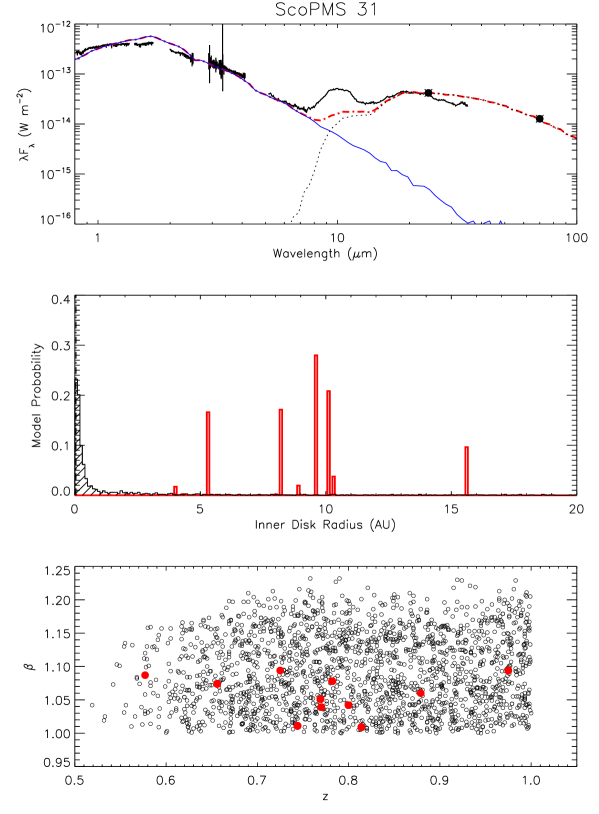
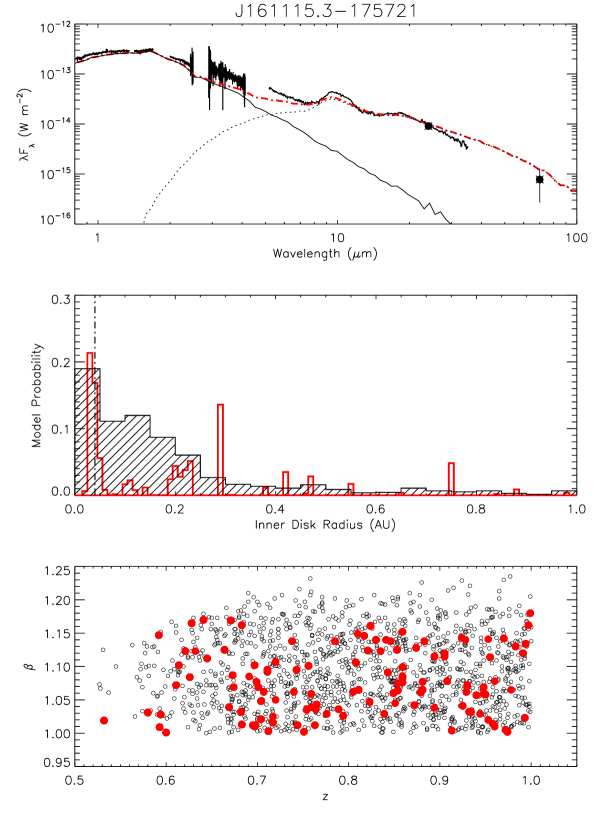
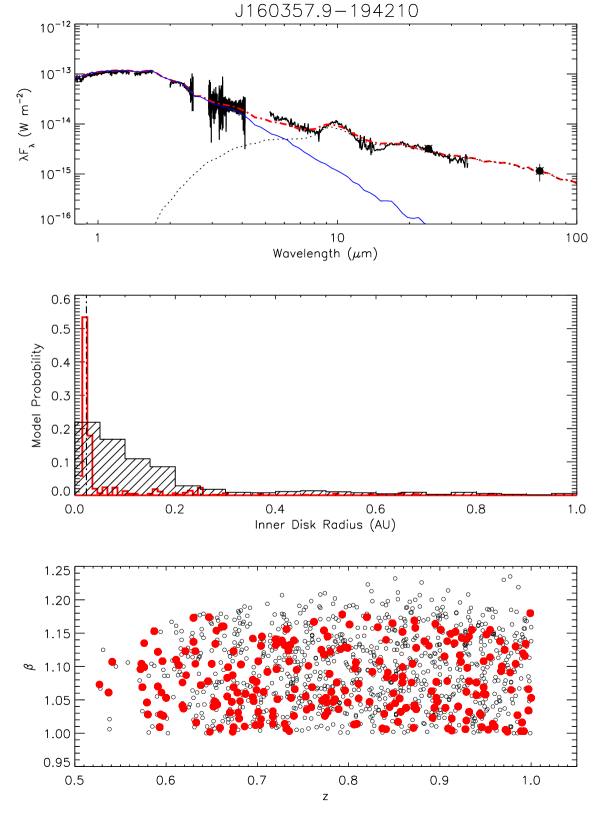
Shown in the upper panels of Figures 5a–i are the observed 0.8–70.0 m SEDs for the 9 Upper Scorpius sources included in the model fitting analysis. Superimposed in red are the best-fitting model profiles placed at their respective distances and extinctions. The disk contributions to the model SEDs are represented by the dotted black curves, and the model stellar atmospheres, taken from the Kurucz (1979) atlas, are plotted in blue. In general, reasonable fits were achieved for many of the Upper Scorpius disk-bearing stars despite the modest number of models (typically 2000) examined for each source. The near-infrared spectrum of the strongly accreting source J161420.2-190648 is suggestive of significant extinction, 6 mag, (Figure 5f). The optimal model fits for this source yielded the largest values of the sample given the a priori assumption that mag.
Degeneracy among model SEDs having significantly different stellar and disk properties is an inherent limitation of the SED fitting process. It is possible, however, to place constraints upon a specific parameter by examining the range of values returned by the best-fitting models. To identify this subset of models, is used as a statistical measure of goodness of fit, where is the minimum value returned by the fitting process and is set to the 1- confidence interval for degrees of freedom. In Table 4 the disk properties of the Upper Scorpius sample obtained from these best-fitting subsets are summarized. Tabulated for each source are the minimum, best-fitting, and maximum values of disk mass (Mdisk), , and inner disk radius (Rin). The ranges of Mdisk and are significant, up to several orders of magnitude separating the minimum and maximum values for a given source. The observed dispersion in Mdisk arises in part from the lack of far-infrared or millimeter wavelength observations that could constrain outer disk emission where substantial quantities of disk mass could remain unaccounted for. Mass accretion rates calculated by the models were found by Robitaille et al. (2007) to be overestimated in their sample of Taurus sources. In the Upper Scorpius sample, whether established accretors or not, is observed to range at least 3 orders of magnitude, and in some cases up to 5. For most suspected accretors included in the model fitting analysis, the values derived in Section 4 using the Pa and Br emission line luminosities are consistent with those predicted by the best-fitting models.
As might be expected, inner disk radius appears to be better constrained by the subsets of best-fitting models than either Mdisk or . Several Upper Scorpius sources, e.g. [PZ99]J161411.0-230536, [PZ99]J160357.6-203105, and ScoPMS 31, exhibit ranges in from minimum to maximum of an order of magnitude or less. Five sources have best-fitting inner disk radii that exceed their respective dust sublimation radii: [PZ99]J161411.0-230536 (=0.87 AU), J160900.7-190852 (2.18 AU), ScoPMS 31 (9.62 AU), J161115.3-175721 (0.29 AU), and J160357.9-194210 (0.17 AU). Given the poor quality of the fit for the strongly accreting source J161420.2-190648, the best-fitting value of 0.8 AU is regarded with skepticism. The remaining Upper Scorpius sources ([PZ99]J160357.6-203105, J160643.8-190805, and J160823.2-193001) have best-fitting inner disk radii that are consistent with their sublimation radii. The confidence levels for these inner disk radii, however, are best examined in terms of a probability density function determined from the values of the accretion disk model fits.
5.1 Constraints for Inner Disk Radii
Flux from the terrestrial disk regions is well sampled by the SpeX and IRS observations, which are dominated by disk emission extending from the sublimation radius to more than 20 AU for a typical 0.7 M⊙ pre-main sequence star. The Upper Scorpius disks are presumably at an advanced evolutionary stage relative to those found around Class II sources in Taurus-Auriga and exhibit SEDs that are consistent with reduced levels of near and mid-infrared disk emission (Dahm & Carpenter 2009). Robitaille et al. (2007) find that all Taurus sources, except for the known transition disk objects (e.g GM Aur, DM Tau) can be fit by models having disks and envelopes with inner disk radii equal to the dust sublimation limit. Approximately one-third of the Robitaille et al. (2006) models have inner disk radii set to the dust destruction radius. The remaining models have increasing inner disk radii that span from the dust destruction radius to 100 AU. The inner disk gaps are treated by the models as being completely evacuated of dust (Robitaille et al. 2006).
To constrain Rin for the Upper Scorpius disk sample a probability () is calculated for a given inner disk radius using the returned values from the model fits of the observed SEDs:
(4)
This probability density function assumes a normal distribution for the returned values of the individual fits. In the center panels of Figures 5a–i, is plotted as a function of Rin for each Upper Scorpius source. Superimposed in the figures as cross-hatched histograms are the distributions of inner disk radii for the entire sample of models considered for each source. Only 3 Upper Scorpius disks have predicted inner radii that are larger than their respective dust sublimation radii at the 1 confidence level or greater: [PZ99]J161411.0-230536 (2-), J160900.7-190852 (1-), and ScoPMS31 (3-). The remaining sources have inner disk radii that are either most consistent with the sublimation radius or exhibit a broad dispersion among predicted values (e.g. J161115.3-175721). The SED of J160643.8-190805, which exhibits minimal near-infrared continuum excess emission (Section 3), is readily fit by a large number of models having a range of inner disk radii. This source exhibits an SED that is reminiscent of those defined as anemic (Lada et al. 2006), weak (Dahm & Hillenbrand 2007), or homologously depleted disk-bearing systems (Currie et al. (2009).
5.2 Disk Mid-plane Settling
The current disk evolution scenario suggests that dust grains coagulate and settle toward the mid-plane prior to the formation of large planetesimals. The Robitaille et al. (2006) models use 2 disk structure parameters to mimic the effects of dust settling: a disk flaring parameter () and a disk scale height factor (). If both of these parameters are low for a given model, this could be indicative of dust mid-plane settling (Robitaille et al. 2006). In the lower panels of Figures 5a–i is plotted as a function of for the entire sample of models considered for each source. Superimposed in red are the best-fitting models as determined by the measure of goodness of fit. In general the spread in both parameters for the best-fitting models is significant, suggesting that neither is well-constrained. Some argument can be made that the SEDs of [PZ99]J161411.0-230536, J160643.8-190805, and ScoPMS31 are better fit by models having lower than average values of . The disk scale height factors for these sources, however, are found to vary significantly. Evidence for dust settling effects among the Upper Scorpius primordial disk sample remains inconclusive at best.
6 Discussion and Conclusions
The clearly different near- and mid-infrared color excess distributions of the Upper Scorpius and Taurus-Auriga Class II populations found by Dahm & Carpenter (2009) suggest that the Upper Scorpius stars have experienced some degree of inner disk evolution relative to their presumably younger counterparts in Taurus-Auriga. This is circumstantially supported by the characteristic temperatures of the continuum excess emission for most Upper Scorpius sources, which are substantially lower than the sublimation temperature for silicate dust. This condition is satisfied by only one member of the Muzerolle et al. (2003) Taurus-Auriga sample of Class II sources having similar spectral types and luminosities. The accretion disk model fitting results, however, are unable to effectively constrain inner disk radii for the majority of the Upper Scorpius disk-bearing sample. This could in part result from the limited number of models examined for each source, which do not sample the full range of available parameter space of disk structure. Another limitation of the Robitaille et al. (2006) models is the assumption that disk gaps are completely devoid of dust, a reduction in complexity that impacts the predicted near- and mid-infrared excess distributions, critical for constraining disk emission originating from the inner disk rim.
In summary 3 of 9 late-type, disk-bearing stars in the Upper Scorpius sample exhibit SEDs that are most consistent with having inner disk radii that lie beyond the sublimation radius for silicate dust: [PZ99]J161411.0-230536, J160900.7-190852, and ScoPMS31. The best-fitting models for 2 additional sources: J161115.3-175721 and J160357.9-194210, have inner disk radii that substantially exceed their respective dust sublimation radii, but the probability distributions of values for these sources exhibit significant dispersion. Proposed indicators for the effects of mid-plane settling in the best-fitting Robitaille et al. (2007) models of the Upper Scorpius sample (i.e. concurrent decreased values of the disk flaring parameter and disk scale height factor) are inconclusive, leaving open to question the nature of the remaining Upper Scorpius primordial disks and their evolutionary state.
Transition disks are believed to represent an early stage of disk clearing and may be in the process of rapid grain growth, planetesimal and planet formation. Adopting the disk classification scheme of Luhman et al. (2010), many Upper Scorpius sources would be classified as pre-transitional objects, i.e. disks that exhibit reduced emission at wavelengths 10 m, but that still retain significant disk emission at longer wavelengths. Two of the Upper Scorpius pre-transitional candidates appear to exhibit gapped disk structure: J160900.7-190852 and ScoPMS31. Both sources are accreting (Dahm & Carpenter 2009 and Section 4) and both exhibit SEDs that are most consistent with having substantial inner disk radii, 1–10 AU. At least one Upper Scorpius source, J160643.8-190805, exhibits an infrared SED that is suggestive of an homologously depleted disk system as defined by Currie et al. (2009).
Before attributing the reduced levels of infrared excess emission in the Upper Scorpius sample to disk evolutionary processes, binarity must be considered as an explanation for the cleared out inner cavities (e.g. CoKu Tau 4, Ireland & Kraus 2008). Two of the disk candidates included in this analysis, [PZ99]J161411.1-230536 and ScoPMS 31, are established binaries resolved by high angular resolution imaging. It must also be acknowledged that the SpeX sample represents only 25% of all primordial disk-bearing stars expected among the 250 known late-type members of the Upper Scorpius OB association. Observations of more late-type, disk-bearing systems are critically needed to confirm the results presented here.
Improved modeling of the Upper Scorpius primordial disk-bearing sample is clearly needed to provide better constraints for the inner disk structure of these presumably evolved primordial disk systems. Monte Carlo three-dimensional, radiative transfer codes are now available that could be applied to the SEDs of these sources. High angular resolution imaging is also needed to identify close (10 AU) binary companions that may account for the reduced near- and mid-infrared excess emission of these sources relative to Class II sources in Taurus-Auriga. Infrared interferometric observations or precision radial velocity monitoring are also needed to identify tighter pairs or spectroscopic binaries that would be capable of dynamically clearing the disk interiors of these systems.
References
- (1) Alexander, R. D., Clarke, C. J., & Pringle, J. E. 2006, MNRAS, 369, 229
- (2) Blaauw, A. 1991, in The Physics of Star Formation and Early Stellar Evolution, ed. C. J. Lada & N. D. Kylafis (Dordrecht: Kluwer), 125
- (3) Calvet, N. et al. 2002, ApJ, 568, 1008
- (4) Carpenter, J. M., Mamajek, E. E., Hillenbrand, L. A., & Meyer, M. R. 2006, ApJ, 651, L49
- (5) Carpenter, J. M., Mamajek, E. E., Hillenbrand, L. A., & Meyer, M. R. 2009, ApJ, 705, 1646
- (6) Cieza, L. A., et al. 2008, ApJL, 686, 115
- (7) Currie, T., Lada, C. J., Plavchan, P., Robitaille, T. P., Irwin, J. et al. ApJ, 698, 1
- (8) Cushing, M. C., Vacca, W. D., & Rayner, J. T. 2004, PASP, 116, 362
- (9) Dahm, S. E. & Carpenter, J. M. 2009, AJ, 137, 4024
- (10) Dahm, S. E. & Hillenbrand L. A. 2007, AJ, 133, 2072
- (11) D’Alessio, P., Canto, J., Hartmann, L., Calvet, N., & Lizano, S. 1999, ApJ, 511, 896
- (12) de Zeeuw, P. T., Hoogerwerf, R., de Bruijne, J. H. J., Brown, A. G. A., & Blaauw, A. 1999, AJ, 117, 354
- (13) Dullemond, C. P. & Dominik, C. 2005, A&A, 434, 971
- (14) Furlan, E. et al. 2006, ApJS, 165, 568
- (15) Gullbring, E., Hartmann, L., Briceno, C. 1998, ApJ, 492, 323
- (16) Haisch, K. E., Jr., Lada, E. A., & Lada, C. J. 2001, ApJ, 553, L153
- (17) Hartmann, L. 2009, in Accretion Processes in Star Formation: Second Edition, Cambridge University Press, Cambridge, UK
- (18) Hernandez, J. et al. 2007, ApJ, 671, 1784
- (19) Ireland, M. J. & Kraus, A. 2008, ApJ, 678, 59L
- (20) Köhler, R., Kunkel, M., Leinert, C., & Zinnecker, H. 2000, A&A, 356, 541
- (21) Kraus, A. L., Ireland, M. J., Martinache, F., & Lloyd, J. P. 2008, ApJ, 679, 762
- (22) Kurucz, R. L. 1979, ApJSS, 40, 1
- (23) Lada, C. J. et al. 2006, 131, 1574
- (24) Luhman et al. 2010, ApJS, 186, 111
- (25) Mamajek, E. E., Meyer, M. R., Hinz, P. M., Hoffmann, W. F., Cohen, M., & Hora, J. L. 2004, ApJ, 612, 496
- (26) Muzerolle, J., Hartmann, L., & Calvet, N. 1998, AJ, 116, 2965
- (27) Muzerolle, J., Calvet, N., Hartmann, L., & D’Alessio, P. 2003, ApJ, 597, 149
- (28) Muzerolle, J., Allen, L. E., Megeath, S. T., Hernandez, J., & Gutermuth, R. A. 2010, ApJ, 708, 1107
- (29) Metchev, S. & Hillenbrand, L. A. 2009, ApJS, 181, 62
- (30) Najita, J. R., Strom, S. E., & Muzerolle, J. 2007, MNRAS, 378, 369
- (31) Preibisch, T., & Zinnecker, H. 1999, AJ, 117, 2381
- (32) Preibisch, T., Brown, A. G. A., Bridges, T., Guenther, E., & Zinnecker, H. 2002, AJ, 124, 404
- (33) Preibisch, T. & Mamajek, E. 2008, in The Handbook of Star Forming Regions Vol. II, ed. B. Reipurth (ASP), 235
- (34) Rayner, J. T. et al. 2003, PASP, 115, 362
- (35) Rayner, J. T., Cushing, M. C., & Vacca, W. D. 2009, ApJS, 185, 289
- (36) Robitaille, T. P., Whitney, B. A., Indebetouw, R., & Wood, K. 2007, ApJS, 169, 328
- (37) Robitaille, T. P., Whitney, B. A., Indebetouw, R., Wood, K., & Denzmore, P. 2006, ApJS, 167, 256
- (38) Siess, L., Dufour, E., & Forestini, M. 2000, A&A, 358, 593
- (39) Silverstone, M. D., Meyer, M. R., Mamajek, E. E., Hines, D. C., Hillenbrand, L. A., Najita, J. et al. 2006, ApJ, 639, 1138
- (40) Strom, K. M. et al. 1989, AJ, 97, 1451
- (41) Uchida, K. I., Calvet, N., Hartmann, L., Kemper, F., Forrest, W. J. et al. 2004, ApJS, 154, 539
- (42) Vacca, W. D., Cushing, M. C., & Rayner, J. T. 2003, PASP, 115, 389
- (43) White, R. J. & Basri, G. 2003, ApJ, 582, 1109

| SourceaaIdentifiers from Carpenter et al. (2006). | SpTbbSpectral type from the literature. | ccExtinction estimates are taken from Preibisch & Zinnecker (1999) and Preibisch et al. (2002). | MassddFrom the models of Siess et al. (2000), assuming a distance of 145 pc. | RadiusddFrom the models of Siess et al. (2000), assuming a distance of 145 pc. | LuminosityddFrom the models of Siess et al. (2000), assuming a distance of 145 pc. | TeffddFrom the models of Siess et al. (2000), assuming a distance of 145 pc. | TDeeDust temperature derived from the blackbody fits of the continuum excess emission. |
|---|---|---|---|---|---|---|---|
| (mag) | (M⊙) | (R⊙) | (L⊙) | (K) | (K) | ||
| PZ99J161411.0-230536 | K0 | 2.4 | 1.98 | 2.65 | 5.62 | 5329 | 700 |
| PZ99J160421.7-213028 | K2 | 1.0 | 1.08 | 1.14 | 0.74 | 4893 | 900 |
| PZ99J160357.6-203105 | K5 | 0.9 | 1.09 | 1.59 | 0.82 | 4321 | 1300 |
| J160643.8-190805 | K6 | 1.9 | 0.95 | 1.42 | 0.65 | 4205 | 500 |
| J160823.2-193001 | K9 | 1.5 | 0.70 | 1.23 | 0.37 | 3963 | 800 |
| J160900.7-190852 | K9 | 0.8 | 0.69 | 1.24 | 0.43 | 3963 | 1300 |
| J161420.2-190648 | M0 | 1.8 | 0.56 | 1.55 | 0.52 | 3840 | 1300 |
| ScoPMS 31 | M0.5 | 0.9 | 0.52 | 1.63 | 0.60 | 3782 | 900 |
| J161115.3-175721 | M1 | 1.6 | 0.48 | 1.55 | 0.48 | 3725 | 900 |
| J160357.9-194210 | M2 | 1.7 | 0.40 | 1.06 | 0.17 | 3611 | 500 |
| J160545.4-202308 | M2 | 2.2 | 0.36 | 1.05 | 0.16 | 3530 | 800 |
| J155829.8-231007 | M3 | 1.3 | 0.25 | 0.60 | 0.05 | 3380 | 1300 |
| Source | EW(Pa)aaNegative equivalent width implies emission. | EW(Br)aaNegative equivalent width implies emission. | log (Pa)/ bbAccretion luminosity determined using the linear relationship of Muzerolle et al. (1998). | log (Br)/ bbAccretion luminosity determined using the linear relationship of Muzerolle et al. (1998). | log (Pa)cc derived assuming R∗, Teff, and M∗ values listed in Table 1. | log (Br)cc derived assuming R∗, Teff, and M∗ values listed in Table 1. |
|---|---|---|---|---|---|---|
| (Å) | (Å) | |||||
| PZ99J160357.6-203105 | 0.51 | 0.58: | 2.230.18 | 2.000.23 | 9.470.18 | 9.230.27 |
| J160900.7-190852 | 1.35 | 2.20 | 2.040.15 | 1.740.18 | 9.190.15 | 8.890.18 |
| J161420.2-190648 | 3.40 | 3.69 | 1.480.10 | 0.650.10 | 8.400.10 | 7.600.10 |
| ScoPMS 31 | … | 1.45 | … | 1.620.17 | … | 8.520.17 |
| J155829.8-231007 | 4.15 | 3.27 | 2.370.20 | 2.500.31 | 9.390.20 | 9.520.31 |
| Source | Teff RangeaaTeff range considered for the adopted spectral type of the source. | NumberbbThe number of models having Teff values within the specified range. | Model IDccThe best-fitting model identification number from Robitaille et al. (2006). | AVddExtinction, distance, inclination angle, and reduced values for the best-fitting model. | dddExtinction, distance, inclination angle, and reduced values for the best-fitting model. | ddExtinction, distance, inclination angle, and reduced values for the best-fitting model. | ddExtinction, distance, inclination angle, and reduced values for the best-fitting model. |
|---|---|---|---|---|---|---|---|
| (K) | (mag) | (pc) | (∘) | ||||
| PZ99J161411.0-230536 | 4900–5410 | 500 | 3014849 | 1.0 | 125 | 75.5 | 6.30 |
| PZ99J160357.6-203105 | 4205–4590 | 2993 | 3012326 | 2.0 | 125 | 31.8 | 13.44 |
| J160643.8-190805 | 4060–4350 | 2753 | 3005191 | 0.5 | 185 | 75.5 | 1.51 |
| J160823.2-193001 | 4850–4060 | 1190 | 3013325 | 0.75 | 165 | 41.4 | 0.34 |
| J160900.7-190852 | 4850–4060 | 1190 | 3019185 | 1.0 | 145 | 81.4 | 4.72 |
| J161420.2-190648 | 3580–4060 | 1998 | 3008376 | 3.0 | 125 | 56.6 | 58.91 |
| ScoPMS 31 | 3729–4060 | 1917 | 3002397 | 2.0 | 165 | 81.4 | 2.19 |
| J161115.3-175721 | 3580–3850 | 1409 | 3016046 | 2.0 | 165 | 41.4 | 2.87 |
| J160357.9-194210 | 3470–3720 | 1180 | 3018769 | 0.5 | 155 | 63.3 | 0.42 |
| Source | (M⊙)aaMinimum, best-fitting, and maximum , , and values of the subset of best-fitting models of Robitaille et al. (2006). | (M⊙ yr-1)aaMinimum, best-fitting, and maximum , , and values of the subset of best-fitting models of Robitaille et al. (2006). | (AU)aaMinimum, best-fitting, and maximum , , and values of the subset of best-fitting models of Robitaille et al. (2006). | ||||||||
|---|---|---|---|---|---|---|---|---|---|---|---|
| (min) | (best) | (max) | (min) | (best) | (max) | (min) | (best) | (max) | |||
| PZ99J161411.0-230536 | 7.18E-7 | 1.06E-5 | 1.16E-2 | 2.88E-13 | 2.43E-11 | 5.13E-8 | 0.10 | 0.87 | 2.24 | ||
| PZ99J160357.6-203105 | 2.60E-6 | 2.62E-5 | 3.47E-2 | 6.79E-13 | 1.16E-11 | 6.97E-8 | 0.06 | 0.07 | 0.14 | ||
| J160643.8-190805 | 5.30E-8 | 3.70E-6 | 5.34E-3 | 5.06E-15 | 2.28E-14 | 2.22E-9 | 0.04 | 0.05 | 10.00 | ||
| J160823.2-193001 | 6.07E-6 | 4.30E-4 | 1.72E-2 | 4.44E-12 | 2.02E-11 | 3.25E-8 | 0.03 | 0.04 | 1.19 | ||
| J160900.7-190852 | 1.44E-5 | 6.56E-3 | 6.56E-3 | 4.44E-12 | 1.43E-9 | 6.05E-9 | 0.04 | 2.18 | 4.13 | ||
| J161420.2-190648 | 4.28E-5 | 4.28E-5 | 1.36E-3 | 3.31E-10 | 3.31E-10 | 1.17E-7 | 0.08 | 0.80 | 0.80 | ||
| ScoPMS 31 | 5.90E-5 | 8.24E-4 | 1.45E-3 | 1.31E-12 | 3.57E-9 | 5.20E-9 | 4.08 | 9.62 | 15.70 | ||
| J161115.3-175721 | 3.52E-7 | 3.53E-5 | 1.78E-2 | 2.69E-13 | 1.74E-11 | 4.10E-8 | 0.03 | 0.29 | 1.19 | ||
| J160357.9-194210 | 3.62E-7 | 2.50E-4 | 9.50E-3 | 2.41E-13 | 2.16E-11 | 1.63E-8 | 0.02 | 0.17 | 1.29 | ||