Chromospheric Activity and Jitter Measurements for 2630 Stars on the California Planet Search11affiliation: Based on observations obtained at the Keck Observatory and Lick Observatory, which are operated by the University of California
Abstract
We present time series measurements of chromospheric activity for more than 2600 main sequence and subgiant stars on the California Planet Search (CPS) program with spectral types ranging from about F5V to M4V for main sequence stars and from G0IV to about K5IV for subgiants. The large data set of more than 44,000 spectra allows us to identify an empirical baseline floor for chromospheric activity as a function of color and height above the main sequence. We define as an excess in emission in the Ca II H&K lines above the baseline activity floor and define radial velocity jitter as a function of and B V for main sequence and subgiant stars. Although the jitter for any individual star can always exceed the baseline level, we find that K dwarfs have the lowest level of jitter. The lack of correlation between observed jitter and chromospheric activity in K dwarfs suggests that the observed jitter is dominated by instrumental or analysis errors and not astrophysical noise sources. Thus, given the long-term precision for the CPS program, radial velocities are not correlated with astrophysical noise for chromospherically quiet K dwarf stars, making these stars particularly well-suited for the highest precision Doppler surveys. Chromospherically quiet F and G dwarfs and subgiants exhibit higher baseline levels of astrophysical jitter than K dwarfs. Despite the fact that the rms in Doppler velocities is correlated with the mean chromospheric activity, it is rare to see one-to-one correlations between the individual time series activity and Doppler measurements, diminishing the prospects for correcting activity-induced velocity variations.
1 Introduction
During times of high solar activity, the flux in an extended network of calcium lines brightens significantly in narrow band filters centered on the near-UV Ca II lines. This observation led O. C. Wilson to anticipate that measurements of emission in the cores of Ca II lines would provide a good index of stellar chromospheric activity and he began a survey at Mt. Wilson Observatory to search for analogs to the solar sunspot cycle (Wilson, 1968) in bright nearby stars. Wilson developed a protocol for measuring values, defined as the ratio of flux in the Ca II line cores to flux in nearby continuum regions. These values are now well established indices for estimating chromospheric activity. Duncan et al. (1991) published seasonal for 1296 stars observed as part of the Mt. Wilson Observatory (MWO) project from 1966 to 1983 and Baliunas et al. (1995) monitored a subset of 111 MWO stars to search for Maunder Minimum cycles. Other large scale surveys have also been carried out to monitor variability in chromospheric activity. Henry et al. (1996) derived values for more than 800 nearby stars from the southern hemisphere; Strassmeier et al. (2000) monitored as a tracer for rotation period to find candidates for Doppler imaging; Hall et al. (2007) have measured H and K fluxes since 1994 to search for stars with sunlike spot cycles. These surveys calibrate coefficients for the continuum and H & K line cores so that the values are on a scale that matches the original MWO project.
To account for different continuum flux levels near the Ca II lines for stars of different spectral type, the values are often parameterized as , a logarithmic fraction of the flux in the H and K line cores to photometric contributions from the star (Noyes et al., 1984; Middelkoop, 1982). Because chromospheric activity declines with stellar age, cluster stars have been used to calibrate the values to the rotation periods and ages for stars with (Noyes et al., 1984; Mamajek & Hillenbrand, 2008).
Stars in the field rotate more slowly and have less chromospheric activity than their young cluster counterparts (Wilson, 1963; Kraft, 1967; Skumanich, 1972; Soderblom, 1983; Simon, Herbig & Boesgaard, 1985; Simon & Drake, 1989). Gray & Nagar (1985) find that most subgiants redward of G0IV also rotate slowly and have low chromospheric activity. Simon & Drake (1989) measured UV emission as an activity indicator for a set of stars with masses between 1.2 and 1.6 . They find that UV activity levels are essentially constant as lower mass stars with evolve from the main sequence across the subgiant branch. In contrast, stars with masses in the range of 1.25 - 1.5 were found to exhibit moderate levels of activity (relative to the lower mass subgiants) on the subgiant branch with an abrupt drop in UV emission (activity) near spectral type G0IV that was empirically accompanied by a decrease in stellar rotational velocities. Simon & Drake (1989) interpret this activity-rotation boundary as a physical transition from acoustic heating in early F-type main sequence stars to magnetic dynamo-driven activity followed by strong rotational braking and a decrement in chromospheric activity. As a case in point, Gilliland (1986) notes unusual high and moderate chromospheric activity in the F8IV star, HD 125840 and interprets this as a stage in subgiant evolution that might develop with the onset of intense dynamo activity as the convective zone deepens.
Chromospheric activity is correlated with spots and flows in stellar atmospheres. High chromospheric activity is empirically associated with both random and quasi-periodic velocities that occasionally mimic the reflex velocities from exoplanets (Henry, Donahue & Baliunas, 2002; Queloz et al., 2001; Bonfils et al., 2007). Therefore, it is a key parameter for identifying stars that may have photospheric features that produce radial velocity “jitter.” Chromospheric activity is monitored in the stellar spectra used to derive precision radial velocities for stars on many Doppler planet searches (Saar, Butler, Marcy, 1998; Saar & Fischer, 1999; Paulson et al., 2002; Wright et al., 2004; Wright, 2005; Johnson et al., 2007). Wright (2005) measured for the California Planet Search (CPS) observations obtained before 2004 August with the original HIRES CCD at Keck Observatory.
Here we provide updated activity measurements with a calibration of to the MWO scale for CPS spectra of main sequence and subgiant stars obtained after the upgrade of the HIRES CCD in 2004 August and activity measurements for stars on the Lick planet search project. We define an excess in above a baseline floor (defined empirically as the tenth percentile level in chromospheric activity) as for stars for the color range and examine correlations between and radial velocity jitter.
2 Keck Observations and Analysis
The CCD detector on Keck HIRES (Vogt et al., 1994) was replaced in August 2004 with three new detectors that span a broader wavelength range and have higher quantum efficiency (particularly at blue wavelengths) and improved charge transfer efficiency. The HIRES B5 decker is generally used for CPS program observations and provides a spectral resolution of about . The spectral format of HIRES is configured by adjusting the echelle and cross-dispersor angles so that (for CPS program observations) the iodine spectrum falls on the middle of the three chips. At the beginning of every CPS observing run, the focus algorithm is used to recenter a set of Thorium and Argon emission lines so that the lines always fall on the same CCD pixels. This setup procedure ensures that stellar absorption lines fall on nearly the same part of the detector (modulo barycentric and stellar velocity shifts). This provides more consistency in the line spread function, relevant for high precision Doppler analysis.
The blue CCD detector spans 3650 - 4790 Å and includes the Ca II H & K lines used to assess chromospheric activity. Program observations are made through the iodine absorption cell, however, the molecular iodine lines disappear blueward of 5000 Å and do not contaminate the Ca II H&K lines. This makes it possible to serendipitously measure stellar activity with every Doppler velocity measurement.
2.1 Keck Calibration
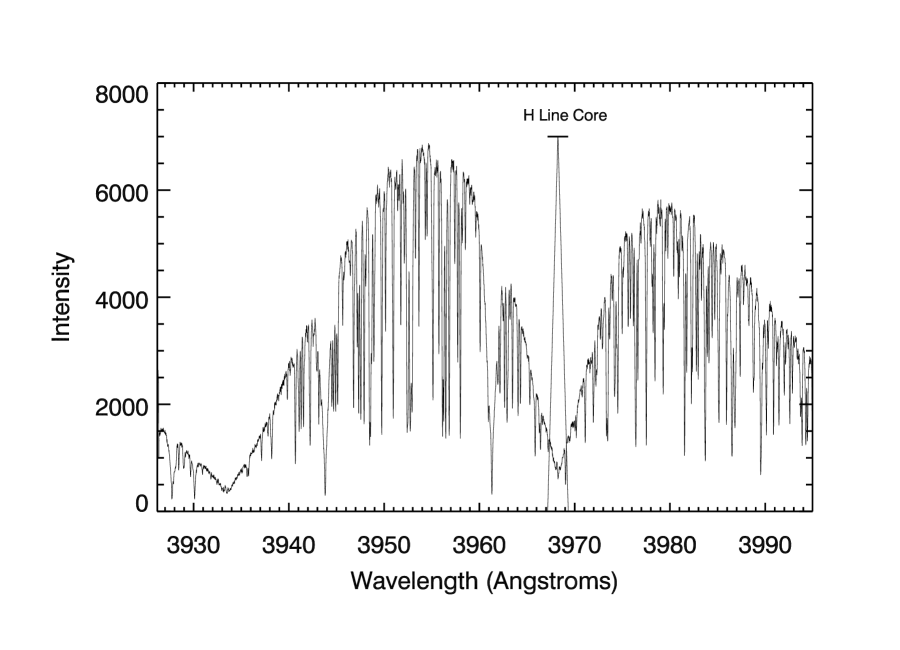
Following a method described in Duncan et al. (1991), we measure flux in the core of the Ca II H & K lines relative to continuum bands. Figures 1, 2 and 3 show the echelle orders used to measure from a spectrum of the bright G8V star Ceti. The core flux in the Ca II lines is weighted using a triangle function with a FWHM of 1.09 Å centered at 3968.47 and 3933.66 Å for the H and K lines, respectively. The triangular weighting function gives the greatest weight to the core of the Ca II lines, which are formed higher in the chromosphere, and diminishing weight away from the line core. Flux is also measured in two continuum windows. The continuum window on the redward side of the H and K lines is labeled as the section and the continuum window blueward of the lines is defined as the section. The R and V continuum sections monitor the overall flux of the star and help account for variable observing conditions such as changing air mass. As described below, coefficients for flux measurements in the line core and continuum windows are free parameters that scale the Keck data to match values from the Mt. Wilson H & K project for stars in common to both projects.
Because the wings of the Ca II lines stretch across a significant fraction of the echelle orders, it is difficult to define the continuum near these lines. As a substitute for continuum normalization, we construct a template for each star using five high signal-to-noise spectra for each star. Each of the five stellar spectra are shifted to rest frame wavelengths by cross-correlation with the National Solar Observatory (NSO) solar atlas. A median filter is applied pixel by pixel in the stack of five observations to smooth over cosmic rays producing a high quality template. The time series spectra are then compared to the template, enabling precise measurement of variation in the Ca II line cores.
For each of the time series spectra (program spectra, obtained for Doppler measurements), the echelle orders with the Ca II lines are cross-correlated and shifted to the template wavelengths. The program spectra are then scaled in intensity to approxiately match the continuum intensity of the template spectra near the H & K lines. The program spectra generally have different continuum slopes than the template because the barycentric velocity will differentially shift each of the time series spectral lines by several pixels. The blaze function of the echelle produces a maximum in flux near the center of the echelle orders that declines toward the red and blue edges of each order. As a result, the intensity is differentially affected by the steep blaze function across the order. To align the continuum, each wavelength-shifted program spectrum is divided by the template spectrum and the residual is fit with a second degree polynomial. When aligning the continuum, the cores of the Ca II lines are masked out so that any real variation in the line core flux is not affected. The program spectrum is then divided by the polynomial so that it is finally well-aligned with the template both in wavelength and continuum intensity.
After this careful alignment with the template spectrum, small relative differences in the Ca II line cores can be measured to derive time series values. Because these measurements of chromospheric activity are simultaneous with the Doppler measurements, they provide a valuable diagnostic for interpreting prospective dynamical velocities in our Doppler planet survey.
The calibration of coefficients for the continuum and core flux values was established using 151 main sequence stars on the CPS Keck survey that also have MWO values published in the Duncan et al. (1991) catalog. The calibrating sample was restricted to stars with that sit within one magnitude of the main sequence. We initially fit four scaling coefficients (Eqn 1) using a Levenberg-Marquardt (LM) algorithm:
| (1) |
This produced covarient coefficients that were extremely sensitive to the initial guesses, so we reduced the number of free coefficients by fixing the ratio of flux meaurements in the H and K bands. Wilson (1968) and Shine & Linsky (1974) both note that the flux in the H and K lines should be equal in intensity, and that deviations from this are instrumental. Examining our spectra we find an average ratio of the H line flux to the K line flux of 1.45. In other words, multiplying the K line flux by 1.45 boosts the K line intensity so that it is comparable to the H line. Similarly, we found that flux in the redder continuum window was dramatically higher than flux in the blueward continuum windows. We adopted a fixed coefficient of 25 to adjust flux in the continuum window. Fixing the coefficients for and breaks the covariance between the remaining coefficients and simplifies the form of our calibration to Eqn (2). The two coefficients in Eqn (2) were determined with Levenberg Marquardt fitting:
| (2) |
| (3) |
In Figure 4 we plot Keck values derived with Eqn (3) against standard Mt. Wilson values from Duncan et al. (1991). We find an rms scatter of 11% to this fit that is likely the result of both measurement uncertainty (from MWO as well as from the Keck data) and intrinsic chromospheric variability. Chromospheric activity of stars can vary on time scales of days to years. An RMS scatter of 11% means that the values published here are within 11% of the long term average of the MWO calibration stars.
To empirically assess our measurement errors, we examined the RMS scatter for the chromospherically quiet, old G8V star, Ceti. This star has a large number of observations at both Keck and Lick Observatory and long term monitoring reported by Duncan et al. (1991) and Wright et al. (2004). The distribution of values measured at Keck are shown in Figure 5. The full width half maximum (FWHM) of this distribution is about 0.002, our empirical assessment of measurement error. Thus, the measured at Keck for five years of data for Ceti is .
Program spectra that have a in the continuum near the Ca II lines exhibit dramatically increased scatter in the measured values. We adopt a minimum signal-to-noise of 5 as a threshold for measurements. Fewer than 2% of the stellar spectra analyzed here had signal-to-noise below this rejection threshold.
3 Lick Observations and Analysis
The Lick Observatory Planet Search began in 1987 with the Hamilton Spectrometer (Vogt 1987) and both the Shane 3-meter telescope and the 0.6-m Coude Auxiliary Telescope (CAT). The CCD detector at Lick was changed in 2002 to a Lawrence Berkeley Laboratory high resistivity CCD and the spectral format was extended at that time to include the Ca II lines for simultaneous monitoring of chromospheric activity. The current spectral format ranges from 3800 to 9000 Å with a spectral resolution of at 6000 Å . The quantum efficiency (QE) of the detector is about 80% for wavelengths between 5000 - 6000 Å where the iodine absorption lines are analyzed to measure Doppler shifts. The QE drops to less than 50% near the blue Ca II lines. The spectra from the smaller aperture telescopes at Lick typically have lower signal-to-noise than Keck, particularly near the Ca II lines.
3.1 Lick Calibration
The chromospheric activity measurements at Lick Observatory only make use of the Ca II H line (Figure 6) because of inadequate signal-to-noise near the echelle order containing the Ca II K line. Therefore, only an value is calculated for spectra obtained at Lick Observatory. We adopt the approach of Wright et al. (2004) and measure the ratio of the line core flux in the Ca II H line relative to a single continuum window, : .
Similar to our analysis of Keck stars, a coadded, median-filtered, template is created for each of the stars on the Lick program. One additional step is made to eliminate cosmic rays or pixels affected by Compton scattering of electrons in the CCD for program observations. This is more of a problem at the Lick Observatory because of the longer exposure times and a thicker substrate in the high resistivity CCD, which is more subject to Compton scattering. To identify affected pixels, the wavelength-shifted and flux-scaled program spectrum is divided by the template observation. Pixels with values that are ten sigma away from the median value are replaced and the program spectrum is then iteratively realigned with the template. Spectra with replaced pixels in the continuum window or in the line core are flagged and excluded if they are outliers so that cosmic ray cleaning does not affect the measurement; it simply improves the alignment of the program observations with the template.
Coefficients for the Lick values (Eqn 4) were calibrated using 83 stars in common with Duncan et al. (1991). Only stars with a color that were within one magnitude of the main sequence were used in the calibration. A Levenberg Marquardt fitting analysis was used to find the coefficients that minimized the RMS scatter between the Lick values and the Duncan et al. (1991) measurements. This calibration has an rms scatter of 11%, shown in Figure 7. We tested inclusion of higher order terms but did not find improvement in the rms fit.
| (4) |
To estimate our measurement uncertainty at Lick Observatory, we again considered time series measurements for the chromospherically inactive star, Ceti. A histogram of the 754 measurements for this star is plotted in Figure 8. The FWHM is 0.008 and represents the empirical uncertainty in our single measurement precision for at Lick Observatory. This single measurment precision is about five times larger than the Keck values, but the median value from Lick is and agrees with the Keck value within uncertainties.
4 Results
In total, more than 44,000 spectra of 2630 stars were analyzed and calibrated to the Mt. Wilson activity index. The and B V values were used to calculate , a measure of the flux in the Ca II lines relative to the basal photospheric value (Noyes et al., 1984). While has a functional dependence on spectral type, removes the basal component of core emission and only varies with chromospheric activity. The parameter has been calibrated to rotation periods and stellar ages for FGK stars (Noyes et al., 1984; Mamajek & Hillenbrand, 2008).
The main disadvantage of is that stars with B V less than 0.4 or greater than 1.0 were not included in the original calibrations because main sequence stars outside this range were not observable in distant clusters (Noyes et al., 1984; Mamajek & Hillenbrand, 2008). The derived quantities , , and stellar age are most secure for main sequence stars that have between -4.0 and -5.1 and B V values between 0.4 and 1.0.
Table 1 contains a summary of star names, B Vcolor, the median values of and height () above the main sequence, (days), Age (Gyr) and the Observatory where the measurements were obtained (Keck or Lick). A stub of this table is provided in the printed version of this paper and the complete table is available in the online version of this paper.
For evolved stars and stars outside the color range , the derived parameters and Age were not calibrated by Noyes et al. (1984) or Mamajek & Hillenbrand (2008) and are not included here. The complete time series data from Keck and Lick Observatories are listed in Table 2. The spectra from Keck Observatory were collected between 2004 August and 2010 August. These values can be appended to results contained in Wright et al. (2004) so that for many stars, the measurements approach the span of an entire activity cycle (e.g., an eleven year solar cycle). The time series observations in Table 2 (online data only) from Lick Observatory span 2002 through 2009 December.
4.1 Outliers
A few specific stars have values very different from the published values of Duncan et al. (1991) and Wright et al. (2004). In Wright et al. (2004), the value for HD 38392 has a typographical error (Wright, 2009), HD 104958 has an of 0.07 which is likely a typographical error (because it is non-physical) and HD 220339 has an value of 0.000, which is also non-physical Wright et al. (2004). We also note that HD 195019 is a binary with S-values for the A and B components.
4.2 Chromospheric activity of main sequence stars
Stars in the CPS sample are defined here as main sequence stars if the absolute visual magnitude is within 1.5 magnitudes of the main sequence. The simultaneous measurements of activity and precision velocities are an ideal data set to search for correlations between activity and spurious radial velocity jitter. Unfortunately, has not been calibrated for evolved or late type stars. An activity metric is desirable because these stars are being monitored for exoplanet surveys and we would like to understand the impact of chromospheric activity on radial velocities for evolved and late-type stars (as well as main sequence stars) to quickly assess whether velocity scatter is likely to be astrophysical or dynamical in origin.
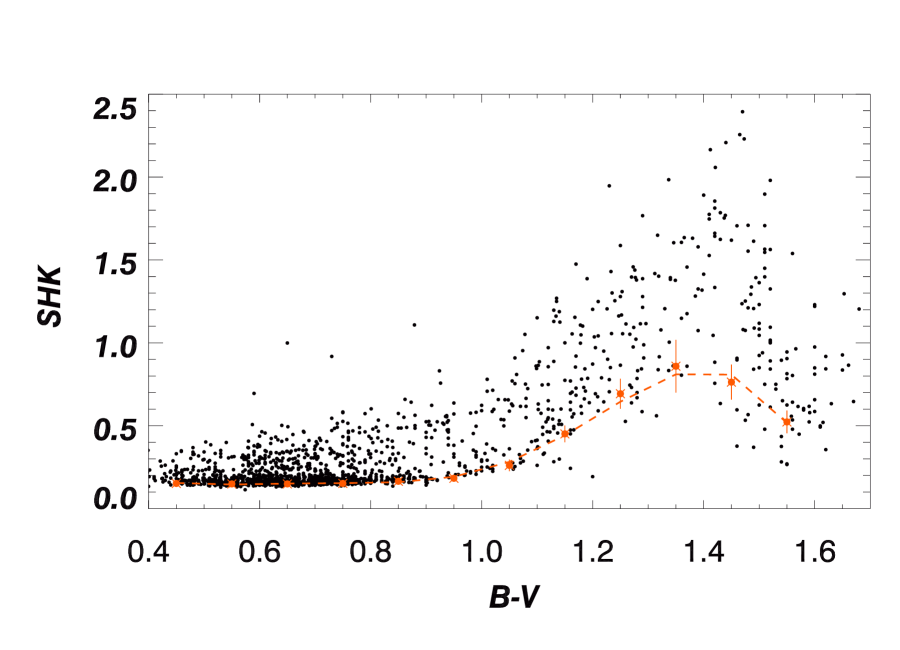
As a proxy for , which accounts for the basal (rotation independent) photospheric flux near the H & K lines, we define baseline activity values, , by fitting the floor in for main sequence stars as a function of B V color:
| (5) | ||||
The polynomial fit described by Eqn 5 for is shown in Figure 9 as a dashed red line and was obtained by selecting the tenth percentile (i.e., inactive) values in twelve B V bins (0.1 magnitude in width). Statistical error bars were calculated by dividing the tenth percentile activity value by the square root of the number of points in each bin. The error bars were used to weight the polynomial fit to the baseline . Because of the large stellar sample, we were able to carry out this empirical fit, rather than relying on theoretical estimates to remove the basal emission in the Ca II line core. It is reasonable to assume that each of the color bins contains a fraction of low activity stars.
The values for main sequence stars begin to rise redward of , expected in part because of a decrease in continuum flux for redder stars. Figure 10 demonstrates the genuine range in Ca II core emission, plotting Ca II lines for three stars with but different values. The lower envelope for turns over at B V of 1.4. This is consistent with activity measurements of Rauscher & Marcy (2006) who measured line core equivalent widths and show that the luminosity in the Ca II lines decreases by a factor of with decreasing mass from K7 to M5V. Likewise, Gizis, Reid, & Hawley (2002) measured H EW as an indicator of chromospheric activity in M dwarfs and found that the EW of absorption lines decreases with increasing spectral type from K7V to M4V. Models of Cram & Giampapa (1987) show that M dwarfs with the strongest H absorption have moderately active chromospheres, while weak H correlates with weak chromospheric activity. Cram & Giampapa (1987) further show that activity in M dwarfs may be relatively constant over time, in contrast with solar type stars with strong activity cycles.
4.3 Chromospheric activity in subgiants
The activity measurements in this paper include a substantial subset of 234 subgiants, included a survey that targets subgiants (Johnson et al., 2007, 2010) and contained in the N2K survey (Fischer et al., 2005). The values for these stars, plotted in Figure 11, show a modest delcine in the median value as a function of B V. A typical value for subgiants is . However, 10% of the 234 stars show moderate to strong chromospheric activity, with values greater than 0.3. We have identified some of these active stars as spectroscopic binaries (blue dots). Gunn, Mitrou & Doyle (1998) and Gizis, Reid, & Hawley (2002) have noted a correlation between chromospheric activity and orbital periods for both main sequence and evolved stars. In Figure 12, the median value is plotted as a function of . Stars with higher are also more active, consistent with the idea proposed by Gilliland (1986) that activity may be a transient phase for subgiants. However, the sprinkling of active stars is found across the subgiant branch, not just at the G0IV boundary identified by Simon & Drake (1989).
5 Activity and jitter
The primary motivation for studying chromospheric emission in planet search stars is to monitor potential sources of astrophysical noise that can impact the radial velocities. We calculate the difference between the median value and as a for each star. This is an empirical parameterization for the excess activity of stars at all B V colors, including late K and early M dwarfs. Because the photon-limited velocity precision at Keck is better than Lick, we restricted our assessment of velocity jitter to stars observed with HIRES at Keck.
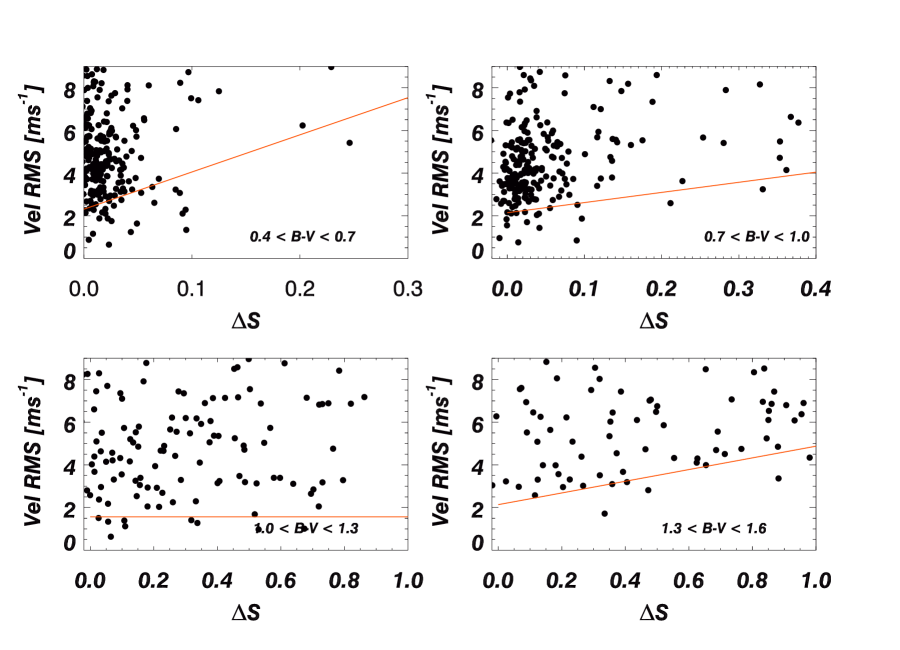
We divided the target stars into four B V groups and plotted velocity rms as a function of in Figure 13. We did not remove any linear trends or periodic velocities, even from stars with known planets, so some of the scatter above the lower envelope of velocity rms is due to dynamical velocities. We define jitter as the quadrature difference of velocity rms minus the formal internal errors (Eqn 6). We emphasize that since velocity scatter includes instrumental and analysis errors, this definition of jitter includes systematic instrumental errors as well as astrophysical noise. Furthermore, the (astrophysical or instrumental) jitter for any particular star may be higher than the tenth percentile velocity rms floor.
| (6) |
Figure 13 (top, left) contains data for 259 late F to mid G-type main sequence stars with . The minimum jitter as a function of is fit to the lower tenth percentile in velocity rms with a line that is plotted in red in the top left panel of Figure 13. For chromospherically quiet stars, the level of jitter begins at 2.3 m s-1and increases rapidly as a function of (Eqn 7). Note that the range is smaller for the blue stars because the photospheres are brighter at blue wavelengths and there is less contrast in the Ca II lines. The stars on the CPS sample in this bluest B V color bin exhibit weaker Ca II core emission, however, the value for these stars climbs steeply as a function of increasing . In our experience, these stars have the strongest velocity jitter of the four groups considered.
The second group consists of 218 main sequence stars in the color range . The tenth percentile floor in velocity rms is fit by Eqn 8 and plotted as a red line in the top right panel of Figure 13. The minimum jitter for chromospherically quiet stars in this B V color range is 2.1 m s-1 and jitter increases with increasing activity, .
The third color bin, contains 118 stars. These stars have a minimum noise floor of 1.6 m s-1 and Eqn 9 does not have a dependence on . Even when the emission in the core of the Ca II lines is significant, it is possible to find stars in this color bin that have low jitter.
The noise floor for the 89 reddest stars (bottom right panel of Figure 13) begins at 2.14 m s-1 and Eqn 10 shows that jitter increases slowly with . It is possible that the noise for this group of stars is affected by analysis errors, since the deconvolution is particularly challenging for spectra of late type stars.
| (7) |
| (8) |
| (9) |
| (10) |
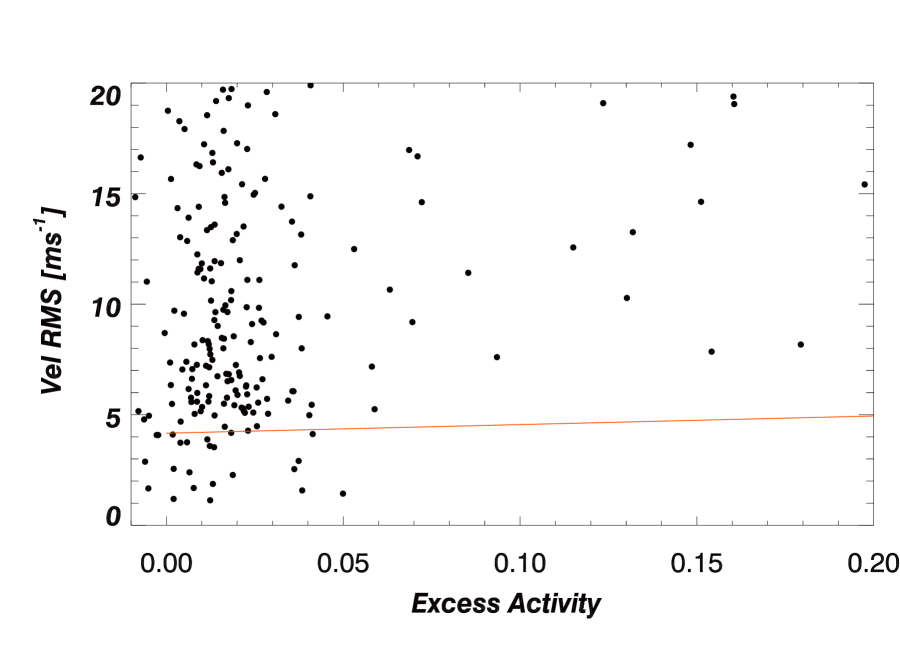
We have also carried out an analysis of activity-correlated jitter for subgiant stars observed at Keck, defined here as stars that have a of at least 1.5 magnitudes above the main sequence. Eqn 11 provides our fit to the bottom tenth percentile activity values. Ninety percent of subgiants have low chromospheric activity, so the fit to the floor of the velocity rms in Figure 14 spans a relatively narrow range of . The jitter for subgiants is defined in Eqn 12.
| (11) |
| (12) |
6 Discussion
The Ca II lines are good indicators of chromospheric activity for main sequence stars. Here, we present measurements of this emission, parameterized as values, for stars observed at Keck Observatory and Lick Observatory. The time series of activity measurements at Keck Observatory date back to 2004 August and the time series data for Lick began in 2002 when the spectral format was extended to include the Ca II lines.
To put on a continuous time baseline, we calibrated our measurements to the values obtained from the long-standing Mt Wilson Observatory H & K program (Wilson, 1968; Duncan et al., 1991) using a set of stars common to both projects. Although we developed a new approach for differentially measuring , these time series activity measurements may be appended to the Wright et al. (2004) values, which were also calibrated to the Mt Wilson H&K program. We find an rms of 11% in the difference between our values and those on the long term Mt Wilson H & K project. Since the rms of values for chromospherically quiet stars is only 1% for Keck stars and 5% for Lick stars, we expect that long term chromospheric variability contributes to the 11% rms in our calibration. Our measurement of includes a significant sample of stars redward of .
The Mt Wilson H & K project surveys the brighter F, G and K-type main sequence stars and subsequent calibrations to , and ages were restricted to these spectral types. With the benefit of a large statistical sample of stars, we define the lower envelope of activity, , as a function of B V for main sequence and subgiant stars over the color range . We define as the difference between the median for each star and . We then evaluated velocity jitter for our stars by subtracting the mean internal error from the rms of the velocities for each star.
Velocity “jitter” therefore characterizes the extent to which the velocity rms deviates from our internal errors. Jitter includes instrumental and analysis errors as well as photon shot noise, unresolved dynamical velocity shifts, and photospheric noise, and it is not always clear which of these is the dominant term. In programs with uniform analysis precision where a constant signal-to-noise is obtained for all observations (the case for CPS observations of bright stars at Keck), it is possible to treat jitter as a free parameter in the Keplerian model. However, both Frequentist and Bayesian models can benefit from physical priors since additional unresolved low amplitude planet signals will inflate residuals to the Keplerian fit. It is likely that jitter will be over-estimated (and more ambiguous) if velocities are obtained with a spectrometer where hardware components (e.g., the detector and controller) have changed, or if data sets have been obtained with more than one telescope, or if the signal-to-noise changes significantly from observation to observation.
A key conclusion from this work is that K dwarfs in the color range have the lowest level of velocity jitter. Importantly, jitter appears to be decoupled from chromospheric activity in these stars; it is a constant 1.6 m s-1 independent of the strength of emission in the Ca II line cores. The lack of correlation between observed jitter and chromospheric activity in K dwarfs suggests that jitter for these stars is dominated by instrumental or analysis errors and not astrophysical noise sources. This demonstrates two important points: (1) on all timescales since 2004, the systematic instrumental errors in CPS observations at Keck are no more than 1.6 m s-1 and (2) the mid to late K dwarfs represent a sweet spot for optimal detectability in Doppler exoplanet searches. The astrophysical contribution to velocity noise in K dwarfs could be significantly less than 1 m s-1.
Relative to Kdwarfs, we also show that jitter increases as a function of B V for chromospherically inactive stars. The lowest activity stars in the bluer color bin of and in the redder color bin of exhibit a measurably higher minimum jitter of about 2.1 m s-1 and a weak dependence on activity (). The minimum jitter increases slightly to 2.3 m s-1 for chromospherically inactive late F and early G dwarfs () and there is a strong sensitivity to .
If we assume that most of the observed K dwarf jitter is instrumental in origin (i.e., we assume that the astrophysical contribution to jitter is essentially zero for K dwarfs), then stars in other color bins exhibit a quadrature sum of 1.6 m s-1 instrumental noise plus additional intrinsic astrophysical noise. Thus, excluding instrumental contributions, the astrophysical noise floor imposed by chromospherically inactive late F and early G dwarfs appears to be at least = 1.7 m s-1 and we expect that it will be difficult, even with the best Doppler precision, to beat down this noise floor. It may be possible to reduce the impact of stellar jitter in late F and G-type dwarfs by confining Doppler searches to stars in the bottom quartile of activity level and by observing the stars very frequently (i.e., with a high cadence strategy). However, in general, solar twins are not optimal targets for Doppler exoplanet searches that aim to detect very low mass planets. At best, sunlike stars will certainly require more data points to average down a noise floor that starts out higher than the astrophysical noise from K dwarfs.
By this same reasoning, mid- to late-G dwarfs with impose an astrophysical noise floor that is m s-1 above that of K dwarfs. It is possible that later type stars with may have greater jitter because of challenges with deconvolution (i.e., a noise source that is not astrophysical). A dependence of rms velocities on would argue for astrophysical noise, however the functional dependence is quite weak and the number of stars with larger puts us in the realm of small number statistics.
Since there is a correlation between and the rms velocity floor in stars, one might hope that variations in individual observations of would have a nearly one-to-one correlation with Doppler velocity measurements. Queloz et al. (2001) reported the remarkable case of HD 166435, a young G0V star with quasi-period radial velocities that were correlated to line bisector variations and Ca II emission. In this unusual case, the star seemed to have persistant active longitudes where spots were regenerated for almost two years, producing a coherent signature of magnetic activity. However, stars do not generally show such clear correlations between activity and velocity.
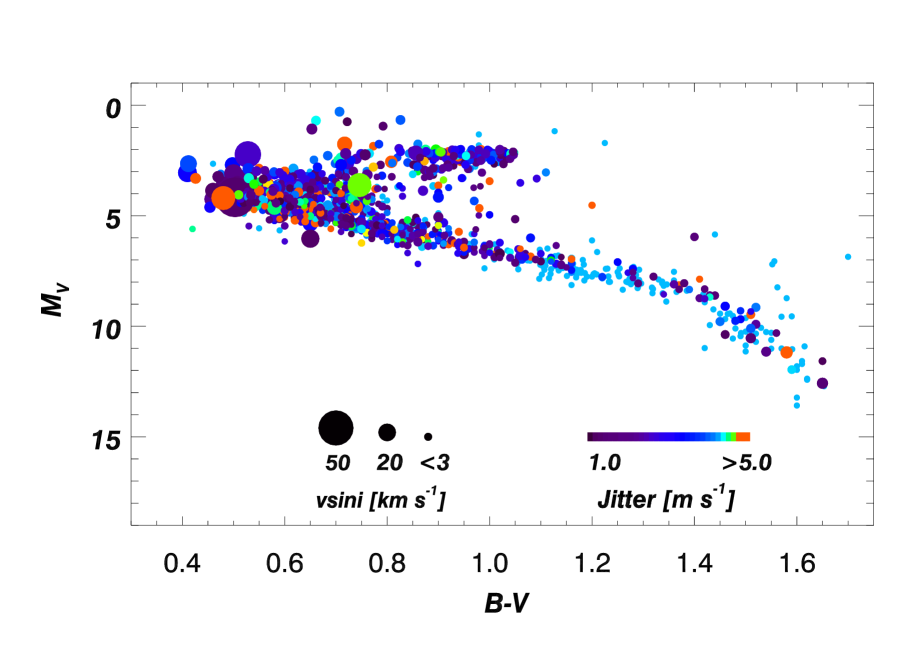
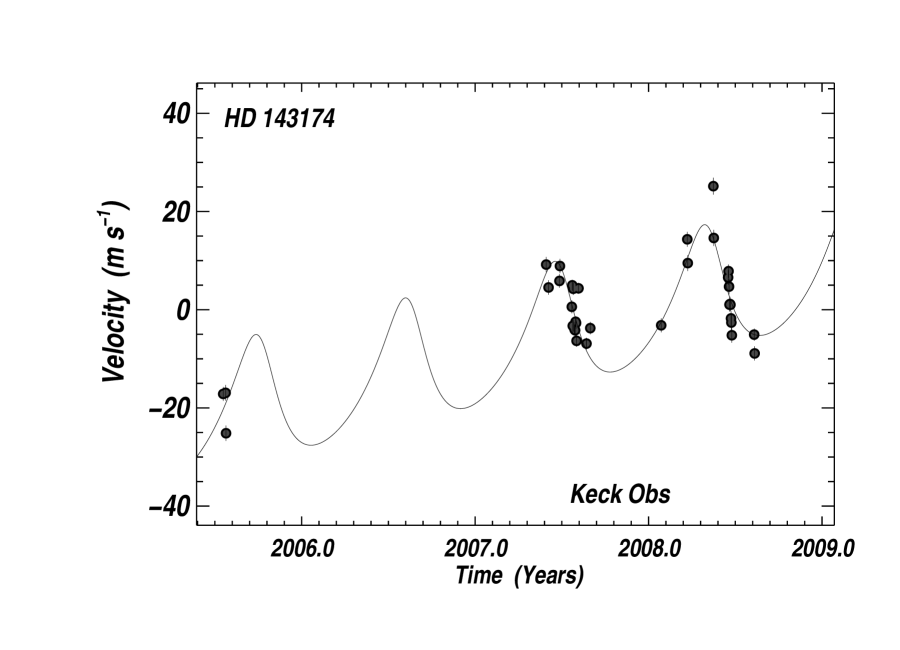
A more typical example is HD 143714, a metal-rich G0V star from the N2K program with and a median . According to Eqn 5, for a star of this color, so . Using Eqn 7, the expected jitter for HD 143714 is 3.9 m s-1. By the end of 2008, the velocities for HD 143714 showed a significant rms of almost 10 m s-1 and were periodic (Figure 16). However, we observed an apparent correlation between the Doppler velocities and activity (Figure 17). When the velocities were detrended using the linear fit to activity, the periodicity disappeared and the rms dropped to 6.2 m s-1. We apparently observed an epoch where chromospheric activity and radial velocities were correlated and the level of velocity rms exceeded the predicted jitter level. However, the activity correlation disappeared. Velocity measurements obtained after 2009 January are no longer correlated with activity and have an rms of 4.9 m s-1 closer to the predicted jitter. Similar correlations between and velocities have been observed in only a few other CPS stars. Like HD 166435 and HD 143174, the stars are late F or early G dwarfs and the correlations come and go. The distribution of jitter values for CPS stars is summarized in the HR diagram in Figure 15.
Subgiants generally exhibit lower chromospheric activity than main sequence stars, however these stars apparently have a jitter floor starting at about 4 m s-1, significantly higher than the jitter level of main sequence stars with similar B V. As the stars expand, the depth of the convective zone increases, braking rotation and decreasing the convective turnover timescale. Consistent with this, ninety percent of the subgiants analyzed here have low chromospheric activity. However, ten percent of the subgiants have moderate to strong chromospheric activity that is correlated with rotational velocity () or the presence of a close binary companion. These active subgiants are reminicent of the F8IV star, HD 125840. Gilliland (1986) explained the unusual activity of this star as the onset of a convective dynamo during the evolution of the massive progenitor star. Activity in subgiants has been observed by Gray & Nagar (1985) and Simon & Drake (1989) for subgiants hotter than G0IV. However, the active subgiants here are not limited to this boundary region; they are found across the subgiant branch. This range of subgiant activity may reflect a range of conditions in the progenitor star, such as stellar mass or rotation, that transitions through a convective dynamo stage at different points on the subgiant branch. Because only a small fraction of subgiants are active, this transition phase is likely short-lived. Simon & Drake (1989) claim that activity in subgiants is restricted to 100 Myr; the time for early F-type stars to evolve from the main sequence to a G0IV star, implying that the convective zones of most subgiants does not sustain convective dynamos for long. Although the phenomenon of activity in subgiants is uncommon, the existence of active subgiants with spectral types later than G0IV suggests that this phase can persist longer than the 100 Myr estimate by Simon & Drake (1989).
References
- Apps et al. (2010) Apps, K. et al. 2010, PASP, in press
- Baliunas et al. (1995) Baliunas, S. L., et al. 1995, ApJ, 438, 269
- Bonfils et al. (2007) Bonfils, X., Mayor, M., Delfosse, X., Forveille, T., Gillon, M., Perrier, C., Udry, S., Bouchy, F., Lovis, C., Pepe, F., Queloz, D., Santos, N.C., Bertaux, J.-L. 2007, A&A, 474, 293
- Cram & Giampapa (1987) Cram, L.E., Giampapa, M.S. 1987, ApJ, 323, 316
- Duncan et al. (1991) Duncan, D. K., et al. 1991, ApJS, 76, 383
- Fischer et al. (2005) Fischer, D. A., et al.2005, ApJ, 633, 465
- Gilliland (1986) Gilliland, R. 1986, Lecture Notes in Physics, Springer Berline/Heidelberg 254, 177-180.
- Gizis, Reid, & Hawley (2002) Gizis, J.E, Reid, I.N., Hawley, S.L. 2002, AJ, 123, 3356
- Gray & Nagar (1985) Gray, D., Nagar, ApJ298, 756
- Gunn, Mitrou & Doyle (1998) Gunn, A. G., Mitrou, C. K., Doyle, J. G. 1998, MNRAS296, 150
- Hall et al. (2007) Hall, J., Lockwood, G. W. & Skiff, Brian A. 2007, AJ, 133, 862H
- Henry et al. (1996) Henry, T. J., Soderblom, D. R., Donahue, R. A., & Baliunas, S. L. 1996, AJ, 111, 439
- Henry, Donahue & Baliunas (2002) Henry, G. , Donahue, R. , & Baliunas, S. 2002, ApJ, 577, L111
- Jenkins et al. (2006) Jenkins, J., Jones, H.R.A., Tinney, C. G., Butler, R.P., McCarthy, C., Marcy, G.W., Pinfield, D. J., Carter, B.D., Penny, A.J. 2006, MNRAS, 372, 163
- Johnson et al. (2006) Johnson, J.A., Marcy, G.W., Fischer, D.A., Laughlin,G., Butler, R.P., Henry, G.W., Valenti, J.A., Ford, E. B., Vogt, S.S. & Wright, J.T. 2006, ApJ, 647, 600
- Johnson et al. (2007) Johnson, J.A., Fischer, D.A., Marcy, G.W., Wright, J. T., Driscoll, P., Butler, R. P., Hekker, S. Reffert, S., Vogt, S. S. 2007, ApJ, 665, 785
- Johnson et al. (2010) Johnson, J.A., Howard, A.W., Bowler, B.P., Henry, G.W., Marcy, G.W., Wright, J. T., Fischer, D.A., & Isaacson, H. 2010, PASP, 122, 701
- Kraft (1967) Kraft, R. 1967, ApJ150, 551
- Mamajek & Hillenbrand (2008) Mamajek, E. E.; Hillenbrand, L. A. 2008, ApJ, 687,1264
- Marcy et al. (2005) Marcy, G. W., Butler, R. P., Fischer, D. A., Vogt, S. S., Wright, J. T., Tinney, C. G., Jones, H. R. A. 2005 PThPS, 158, 24
- Middelkoop (1982) Middelkoop, F. 1982, Å107, 31
- Noyes et al. (1984) Noyes, R. W., Hartmann, L., Baliunas, S. L., Duncan, D. K. & Vaughan, A. H. 1984, ApJ, 279, 763
- Paulson et al. (2002) Paulson, D. B., Cochran, W. D., Hatzes, A. P. 2004, AJ, 127, 3579
- Queloz et al. (2001) Queloz, D., Henry, G. W., Sivan, J. P., Baliunas, S. L., Beuzit, J. L., Donahue, R. A., Mayor, M., Naef, D., Perrier, C. & Udry, S. 2001, A&A, 379, 279
- Rauscher & Marcy (2006) Rauscher, E., & Marcy, G.W. 2006, PASP, 118, 617
- Saar, Butler, Marcy (1998) Saar, S. H., Butler, R. P. & Marcy, G. W. 1998, ApJ, 498, 153
- Saar & Fischer (1999) Saar, S. H. & Fischer, D. A. 2000, ApJ, 534, 105
- Spronck & Fischer (2010) Spronck, J., Fischer, D. A. 2010 (in prep)
- Shine & Linsky (1974) Shine, R. & Linsky J. 1974, Solar Physics, 39, 49S
- Simon, Herbig & Boesgaard (1985) Simon, T., Herbig, G. H., & Boesgaard, A. M. 1985, ApJ293, 551
- Simon & Drake (1989) Simon, T. Drake, S. A., 1989, ApJ346, 303
- Skumanich (1972) Skumanich, A. 1972, ApJ171, 565
- Soderblom (1983) Soderblom, D. 1983, ApJS53, 1
- Strassmeier et al. (2000) Strassmeier, K., Washuettl, A., Granzer, T., Scheck, M., & Weber, M. 2000,A&AS, 142, 275
- Valenti & Fischer (2005) Valenti, J.A., & Fischer, D.A. 2005, ApJS, 159, 141
- Vogt et al. (1994) Vogt, S. S. et al. 1994, SPIE, 2198, 362.
- Vogt et al. (1987) Vogt, S. S. 1987, PASP, 99, 1214
- Wilson (1963) Wilson, O. C. 1963, ApJ, 138, 832
- Wilson (1968) Wilson, O. C. 1968, ApJ, 153, 221
- Wright (2009) Wright, J. T. (private communication)
- Wright et al. (2004) Wright, J T. et al. 2004, ApJ, 128, 1273 (erratum, 129, 1776)
- Wright (2005) Wright, J. T. 2005, PASP, 117, 657


| Star | Median | Jitter | Median | ||||||
|---|---|---|---|---|---|---|---|---|---|
| nameaaStar names are HD unless otherwise given. Values of B-V are from the Hipparcos Catalog. Derived quantities are only given for stars in the range . Obsv is K for Keck Observatory or L for Lick Observatory. | HIP | B-V | S | (days) | log Age | Obsv | |||
| GJ 26 | — | 1.540 | 0.895 | 2.844 | — | 0.17 | — | — | K |
| 38A | 473 | 1.410 | 1.775 | 4.542 | — | 1.01 | — | — | K |
| 38B | — | 1.410 | 1.747 | 4.475 | — | 0.15 | — | — | K |
| GJ 47 | — | 1.390 | 1.074 | 2.885 | — | -1.4 | — | — | K |
| GJ 48 | 4856 | 1.460 | 0.907 | 2.483 | — | -0.9 | — | — | K |
| GJ 49 | 4872 | 1.500 | 2.947 | 7.510 | — | 0.51 | — | — | K |
| GJ 83.1 | — | 1.820 | 14.72 | 0.000 | — | 0.76 | — | — | K |
| GJ 87 | 10279 | 1.430 | 0.634 | 2.100 | — | -0.8 | — | — | K |
| 105 | 490 | 0.600 | 0.380 | 6.581 | -4.344 | -0.0 | 3 | 0.19 | K |
| GJ 105B | — | 1.620 | 0.843 | 3.717 | — | -0.1 | — | — | K |
| GJ 107B | — | 0.930 | 1.766 | 9.987 | — | -3.0 | — | — | K |
| GJ 109 | 12781 | 1.550 | 0.814 | 2.736 | — | -0.2 | — | — | K |
| 166 | 544 | 0.750 | 0.434 | 3.586 | -4.384 | 0.00 | 7 | 0.26 | K |
| Star | JD | |||||
|---|---|---|---|---|---|---|
| name | HIP | - 2440000. | S value | SNR | Obsv | |
| GJ 26 | — | 13238.978 | 0.686 | — | 17 | K |
| GJ 26 | — | 13338.806 | 0.614 | — | 13 | K |
| GJ 26 | — | 13369.738 | 0.661 | — | 15 | K |
| GJ 26 | — | 13426.728 | 0.598 | — | 8 | K |
| GJ 26 | — | 13723.735 | 1.045 | — | 9 | K |
| GJ 26 | — | 13961.013 | 0.939 | — | 14 | K |
| GJ 26 | — | 13981.934 | 0.939 | — | 15 | K |
| GJ 26 | — | 13982.964 | 0.845 | — | 14 | K |