OBSERVED POLARIZATION OF BROWN DWARFS SUGGESTS LOW SURFACE GRAVITY
Abstract
Light scattering by atmospheric dust particles is responsible for the polarization observed in some L dwarfs. Whether this polarization arises from an inhomogeneous distribution of dust across the disk or an oblate shape induced by rotation remains unclear. Here we argue that the latter case is plausible and, for many L dwarfs, the more likely one. Furthermore evolutionary models of mature field L dwarfs predict surface gravities ranging from about 200 to 2500 m s-2 (corresponding to masses of 15 to 70 ). Yet comparison of observed spectra to available synthetic spectra often does not permit more precise determination of the surface gravity of individual field L dwarfs, leading to important uncertainties in their properties. Since rotationally-induced non-sphericity, which gives rise to non-zero disk-integrated polarization, is more pronounced at lower gravities, polarization is a promising low gravity indicator. Here we combine a rigorous multiple scattering analysis with a self-consistent cloudy atmospheric model and observationally inferred rotational velocities and find that the observed optical polarization can be explained if the surface gravity of the polarized objects is about 300 m s-2 or less, potentially providing a new method for constraining L dwarf masses.
1 INTRODUCTION
Together with the lowest mass stars, brown dwarfs belong to the class of ultracool dwarfs whose relatively low atmospheric temperature and high pressure results in clouds of refractory compounds that in turn influence the entire atmosphere. The condensates (most abundantly iron and Mg-silicate grains) form near the atmospheric temperature expected from chemical equilibrium as they efficiently deplete the condensible species from the gas phase above the cloud (Ackerman & Marley, 2001; Allard et al., 2001; Tsuji, 2005; Burrows et al., 2006; Helling et al., 2008). As the objects cool over time, the dust eventually settles down gravitationally below the visible atmosphere.
The observed spectra and photometry of ultracool dwarfs have been compared against predictions from models that incorporate the current understanding of atmospheric physics, chemistry, dynamics and most importantly cloud processes (Cushing et al., 2008; Stephens et al., 2009). When combined with brown dwarf evolution tracks (Saumon & Marley, 2008; Baraffe et al., 2002) these models can place fairly tight constraints on the effective temperature, , of dwarfs with quality spectra. However, model fitting to date can leave the surface gravity of these objects poorly constrained, often by up to an order of magnitude. Since the radii of evolved brown dwarfs are only weakly dependent upon mass (Chabrier & Baraffe, 2000; Burrows et al., 2001), surface gravity is nearly directly proportional to mass for mature field L dwarfs older than several hundred million years. For such objects, surface gravities lying in the range of 200 to 2500 m s-2 are expected (Saumon & Marley, 2008). As very few brown dwarfs have known dynamical masses, there has yet been few independent tests of the masses and temperatures derived from the spectral fitting.
Given the state of both observational and theoretical constraints on dwarf surface gravity, an independent constraint on the surface gravity of ultracool dwarfs is sorely needed. There are some spectral indicators of low mass, particularly for early type L dwarfs. Cruz et al. (2009) identify weak alkaline absorption lines, and differing strengths of metal oxides and hydrides as compared to typical L dwarf spectra as signs of low surface gravity by analogy to spectra of giant stars. The physical processes underlying these unusual spectral features are as yet poorly understood and the value of surface gravity at which they become apparent is uncertain. Imaging polarimetry can provide another independent metric of constraint for surface gravity.
Linear polarization, almost certainly arising from dust scattering (Sengupta & Krishan, 2001; Sengupta & Kwok, 2005), has been detected in the optical bands from a good number of L dwarfs covering almost the entire range of spectral types L0–L8 (Menard et al., 2002; Zapatero Osorio et al., 2005; Tata et al., 2009). Observations by Menard et al. (2002) show that 25% of L0–L3 dwarfs and 50% of L3.5–L8 dwarfs in their sample are intrinsically polarized while Zapatero Osorio et al. (2005) have detected polarization from % of L0–L3 dwarfs and % of L3.5–L8 dwarfs in their samples. In principle the observed polarization could arise from the presence of magnetic field. However, radio, X-ray, ultra-violet and H observations point to a lack of magnetic activity in mature field L dwarfs (Berger et al., 2010); magnetic field strengths in the range 100–1000G have been deduced from observations of 8.3 GHz radio emission from a few brown dwarfs. This implies that synchrotron processes will not lead to significant linear polarization in the optical (Menard et al., 2002). Comparing the small net linear polarization (of order a few times 0.01%) detected from a sample of Ap stars (Leroy, 1995) with about 1 kG dipolar field at the surface, Menard et al. (2002) pointed out that the observed optical polarization of ultracool dwarfs could not be explained by Zeeman splitting of atoms or molecules. Furthermore the warmer M dwarfs are found to be unpolarized (Menard & Delfosse, 2004). M dwarfs have little or no atmospheric dust although they should have stronger magnetic field (Mohanty et al., 2002). So, we conclude dust scattering polarization is the most plausible physical process that can account for the observed polarization of L dwarfs.
Atmospheric dust can produce a net polarization if either the dust is spatially inhomogeneous on large scales or the dust is homogeneous but the disk is oblate because of rotational distortion. We argue here that while the former mechanism cannot be ruled out, the latter is consistent with the current polarization observations if the polarized objects have relatively low gravity. A rigorous polarization survey of L dwarfs would distinguish between these mechanisms, providing either a new method to probe dust cloud morphology or ‘weigh’ the gravity of ultracool dwarfs.
2 THE ATMOSPHERIC MODELS
In order to test if plausible, spatially uniform dust clouds can reproduce the observed polarization of the L dwarfs, we employ a grid of one-dimensional atmosphere models (Ackerman & Marley, 2001; Marley et al., 2002; Freedman et al., 2008; Saumon & Marley, 2008) for specified and surface gravities . The atmosphere model parametrizes the efficiency of sedimentation of cloud particles through a scaling factor . For a fixed , and the model uniquely predicts the variation in mean particle size and particle number density through the atmosphere which plays the crucial role in determining the scattering polarization. The atmosphere model employed here successfully reproduces the spectra and photometry of a large number of L dwarfs at a wide range of wavelengths covering near optical to mid-infrared regions as probed by ground and space-based telescopes. Model fitting typically constrains the effective temperature of an object of given spectral type within 100K and generally rule out the case for (Cushing et al., 2008; Stephens et al., 2009).
The gas and dust opacity, the temperature-pressure profile and the dust scattering asymmetry function averaged over each atmospheric pressure level derived by the atmospheric code are used in a multiple scattering polarization code that solves the radiative transfer equations in vector form to calculate the two Stokes parameter I and Q in a locally plane-parallel medium (Sengupta & Marley, 2009). A combined Henyey-Greenstein-Rayleigh phase matrix (Liu & Weng, 2006) is used to calculate the angular distribution of the photons before and after scattering. Finally, the angle dependent I and Q are integrated over the rotation-induced oblate disk of the object by using a spherical harmonic expansion method and the degree of polarization is taken as the ratio of the disk integrated polarized flux () to the disk integrated total flux (). The detail formalisms as well as the numerical methods are provided in Sengupta & Marley (2009).
3 ROTATION-INDUCED OBLATENESS
We employ the Darwin-Radau relationship (Barnes & Fortney, 2003) for estimating the rotation induced oblateness:
| (1) |
Here and are the equatorial and polar radii respectively, is the spin angular velocity of the object and =0.261 for polytropic index and 0.205 for , being the moment of inertia. Comparisons with detailed structure models (D. Saumon, private communication) show that irrespective of their age, brown dwarf interiors can be adequately approximated by polytropes with with the larger being appropriate for higher gravities. As increases, the oblateness decreases for a given rotational velocity and hence the degree of polarization decreases. In the present work we consider and as two extreme cases.
4 RESULTS AND DISCUSSION
4.1 Polarization from Oblate Dwarfs
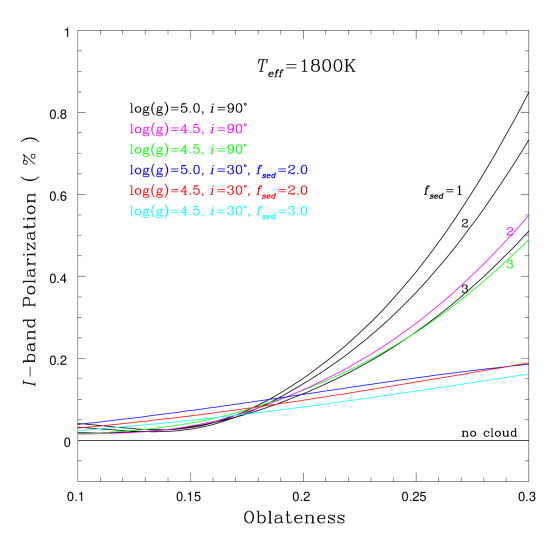
Using the foregoing modeling approach we computed disk integrated polarization for a variety of model assumptions. The effect of varying surface gravity, viewing or inclination or projection angle , , and rotation-induced oblateness on I-band (the bandpass at which most of the data is available) polarization is presented in Fig.1 for a fixed effective temperature K. The degree of polarization increases slowly with increasing oblateness and then increases rapidly for oblateness greater than about 0.18. This is because for relatively smaller oblateness the second harmonic in the spherical harmonic expansion is dominant, but as the oblateness increases the fourth and the sixth harmonics contribute significantly increasing polarized flux . At the same time, higher harmonics become dominant and hence reduce the total flux (more reddening due to limb darkening). As a result, increases rapidly. However, as the inclination angle decreases, the variation of polarization with respect to the oblateness changes noticeably. All else being equal thicker clouds (smaller ) produce greater polarization, especially when the surface gravity is high.
Fig.1 shows that the observed amount of L dwarf linear polarization can be produced by dust scattering only if the oblateness is greater than about 0.18 irrespective of any allowed value of the parameters111The stability limit oblateness for uniformly rotating polytropes with and 1.5 is 0.44 and 0.38 respectively (James 1964).. In the absence of a dust cloud, polarization at I-band is negligible for any oblateness because Rayleigh scattering yields significant polarization only at shorter wavelengths (B-band) (Sengupta & Marley, 2009). As shown in Fig. 2, the disk integrated degree of polarization remains almost the same within the range of 1800–1300K roughly corresponding to spectral types L3–L8 and falls rapidly at higher , where clouds form at lower pressure and are thinner. At , clouds are found deeper in the atmosphere, are optically thicker, and produce significant polarization. The transition from L to T dwarfs, i.e., from cloudy to cloudless atmosphere occurs at about 1300K as the clouds dissipate or settle below the photosphere. Above K there are few condensates. Thus polarization is a marker for the presence of substantial cloud layers.
4.2 Comparison to Observations
Menard et al. (2002) detected confirmed polarization from three L dwarfs, marginal polarization from two and no polarization from three L dwarfs. We consider the five confirmed and marginally polarized L dwarfs from this observation. Zapatero Osorio et al. (2005) found confirmed polarization in I-band from 9 L dwarfs out of 33 targets. Out of these 9 L dwarfs, one (2MASS J1507–16) was also observed by Tata et al. (2009) who detected confirmed polarization from three L dwarfs. Tata et al. (2009) detected polarization as high as % in the I-band and % in the R-band (Tata et al., 2009) of 2MASS J1731+27. This object also shows a very high equivalent width (-5.98) compared to the average value that is very small or zero. Spitzer IRAC observations exclude a warm, but not a cold circumstellar disk (Tata et al., 2009). So, we exclude this object from consideration.
For each remaining 15 objects, we computed the rotational velocity required to produce sufficient oblateness to reproduce the observed polarization for the of the object (based on its spectral type). The spectral types, adopted , photometric variability, detected I-band polarization along with the associated errors and the projected rotational velocity inferred from high resolution spectra as well as the same required to match the observed polarization are provided in Table 1. for almost all objects is derived from the optical spectral type by using equation (4) of Stephens et al. (2009). For DENIS-P J2252–17, the infrared spectral type is used as the optical spectral type is not known. calculated from optical and infrared spectral type differs by less than 100K for all objects except for 2MASS J0141+18 which is a L1 object in optical but L4.5 object in infrared and so its effective temperature ranges between 2100K and 1550K as derived by using equations (4) and (3) respectively of Stephens et al. (2009).
The projected rotational velocity of a few L dwarfs showing confirmed polarization is inferred observationally (Mohanty & Basri, 2003; Reiners & Basri, 2008; Bailer-Jones, 2004). However, the projection angle is not known allowing a wide range of the values of that along with determines the oblateness. While a smaller value of yields less polarization, it gives rise to higher rotational velocity for a fixed and hence more asymmetry. Taking the values of comparable to the observed values, we find that the models produce polarization comparable with that observed in I-band only when the surface gravity less than 1000 ms-2 and , leading to substantial disk asymmetry. Fig.2A shows that all the five observational data points of Menard et al. (2002) can be fit well by setting and ms-2 with in range of 40 to 50 kms-1 which is within or slightly higher than the observed values. The observed I-band polarization of 2MASS J1507–16 fits well by using the observed with ms-2 and .
Except for Kelu-1 and 2MASSW J1412+16, the rotational velocity of most of the polarized L dwarfs observed in Zapatero Osorio et al. (2005) is unknown. Fig. 2B shows that six out of the eight data from the Zapatero Osorio et al. (2005) sample and one from Tata et al. (2009) – 2MASS J1807+50 – whose observed projected rotational velocity is (Tata et al., 2009; Reiners & Basri, 2008), can be fit if is as high as 90– and at which the polarization is maximum. As this corresponds to a rotation period near an hour, a more likely explanation assuming homogeneous clouds would be an even lower surface gravity for these objects. For example, if , an equal amount of oblateness can be achieved by lowering the surface gravity to 240–. Alternatively, other physical processes such as surface banding or inhomogeneity may give rise to such high polarization. We note however that the mean polarization value of Zapatero Osorio et al. (2005) could be high because of the larger error bars owing to smaller telescope aperture than in the other studies (F. Menard, private communication).
Among the polarized objects, Kelu-1 is most likely a triple system with uncertain polarization contribution from the components. 2MASS J2244+20 which shows polarization of % is extremeley red both in the optical and near-infrared (Zapatero Osorio et al., 2005). Hence the high polarization could be attributed to the presence of abnormally high amount of dust. The high polarization of 2MASS J1412+16, an L0.5 dwarf, while having small rotational velocity remains unexplained. Figure 2 shows that polarization does not alter drastically when the polytropic index is increased from to . For , a slight increase in the rotational velocity is needed in order to fit the observed data. However, for the range , the observed data can be fit without altering the values of , or .
The range of and the value of adopted here overlaps with that derived from spectral fit by Stephens et al. (2009) for the three common L dwarfs. All the data points in Fig. 2 can be fit with both =2 and 3 because for ms-2, the polarization profile is not too sensitive to as implied by Fig. 1.
Monte Carlo simulation of the field substellar mass function indicates that objects in the 12-75 mass range should greatly outnumber lighter objects in the solar neighborhood and objects below 12-13 are expected to constitute a modest fraction of field L dwarfs (Burgasser, 2004). Given the small sample sizes and lack of uniform selection criteria in the polarization surveys, it is premature to draw any conclusion from the relatively high fraction of low gravity objects which we find. Meanwhile the value of gravity below which the spectral indicators identified by Cruz et al. (2009) become apparent is not yet known, thus the lack of ‘low gravity’ spectral indicators in these objects is not necessarily indicative.
4.3 Polarization from Surface Inhomogeneities
Inhomogeneous distribution of atmospheric dust and Jupiter like bands (Menard & Delfosse, 2004) may also produce detectable polarization. Whether or not the clouds of L dwarfs are homogenous or patchy remains an open issue. Existing spectral models assume spatially uniform dust clouds and generally accurately reproduce observed L dwarf spectra (Stephens et al., 2009). Surface inhomogeneities can produce photometric variability and 40-50% of L dwarfs are found to be variable without any periodicity (Gelino et al., 2002; Koen, 2003). However, 2MASS J2224-01, 2MASS J1108+68, 2MASS J1658+70 (Gelino et al., 2002) and 2MASS J1048+01 (Koen, 2003) are all variable L dwarfs with no detectable polarization implying that inhomogeneities do not always produce significant polarization. On the other hand, 2MASS J1412+16, 2MASS J0036+18 (Gelino et al., 2002), and 2MASS J1507-16 (Koen, 2003) are not variable implying a lack of large scale surface inhomogeneity (or a particularly favorable morphology and viewing geometry) but all of them are polarized. Another example is 2MASSW J1048+01 which is a variable object with comparatively low projected velocity () (Reiners & Basri, 2008). If inhomogeneity produces detectable amounts of polarization then this object should show polarization irrespective of its low rotational velocity but it is unpolarized.
An alternative hypothesis is that some dwarfs exhibit a uniform, banded appearance. Such objects might still be polarized but not be variable. We conclude that unlike the case for oblateness induced polarization–which naturally explains both the magnitude and variation with spectral type of polarization (Figure 2)–surface inhomogeneities require reliance on special cloud morphologies and viewing angles. Nevertheless both mechanisms likely play a role in producing polarization in some objects.
5 CONCLUSIONS
We have found that model L dwarf atmospheric structures which generally well reproduce the spectra of known objects, predict full disk polarization of L dwarfs comparable to the values observed on some objects if the dwarfs are substantially oblate. Because the degree of oblateness varies inversely with gravity (Eq. 1), this mechanism requires fairly low surface gravities (). Thus if oblateness is the primary mechanism by which L dwarfs become polarized, then polarization is a marker for low gravity. While some spectral indicators of low gravity have been identified in the literature (e.g. Cruz et al., 2009), the actual gravity at which they become prominent has yet to be established. Thus polarization may serve as an indicator of moderately low L-dwarf gravity, at least for rapidly rotating dwarfs.
A well constructed survey of a sample of field L dwarfs for polarization, , variability, and spectral gravity indicators would test more definitively which mechanism (oblateness or surface inhomogeneities) is primarily responsible for L dwarf polarization. Once established, polarization would serve as a new constraint on the properties of newly discovered objects. However, this conclusion relies on the assumption that the adopted dust model describes the cloud distribution correctly.
Finally, we predict (Fig. 3) that the degree of polarization at J-band is comparable with that of I-band but is reduced at H- and K- bands. Again, in the infrared we expect a detectable amount of polarization only if the surface gravity is about or less.
6 Acknowledgements
We thank M. Cushing, F. Menard, D. Saumon and I. Baraffe for useful discussions and suggestions. We also thank the referee for critical comments and useful suggestions.
References
- Ackerman & Marley (2001) Ackerman, A. & Marley, M. S. 2001, ApJ, 556, 872.
- Allard et al. (2001) Allard, F. et al. 2001, ApJ, 556, 357.
- Bailer-Jones (2004) Bailer-Jones, C. A. L. 2004, A&A, 419, 703.
- Baraffe et al. (2002) Baraffe, I. et al. 2002, A&A, 382, 563.
- Barnes & Fortney (2003) Barnes, J. W. & Fortney, J. J. 2003, ApJ, 588, 545.
- Berger et al. (2010) Berger, E. et al. 2010, ApJ, 709, 332.
- Burgasser et al. (2002) Burgasser, A. J., Marley, M. S., Ackerman, A. S., Saumon, D., Lodders, K., Dahn, C. C., Harris, H. C., & Kirkpatrick, J. D. 2002, ApJ, 571, L151
- Burgasser (2004) Burgasser, A. J., ApJS, 155, 191.
- Burrows et al. (2001) Burrows, A. et al. 2001, Rev. Mod. Phys. 73, 719.
- Burrows et al. (2006) Burrows, A. et al. 2006, ApJ, 640,1063.
- Chabrier & Baraffe (2000) Chabrier, G. & Baraffe, I. 2000 ARAA, 38, 337.
- Cruz et al. (2009) Cruz, K. L., Kirkpatrick, J. D. & Burgasser, A. J. 2009, AJ, 137, 3345.
- Cushing et al. (2008) Cushing, M. C. et al. 2008, ApJ, 678, 1372.
- Freedman et al. (2008) Freedman, R. S. et al. 2008, ApJS, 174, 71.
- Helling et al. (2008) Helling, Ch. et al. 2008, ApJ, 675, L120.
- Helling et al. (2008a) Helling, Ch. et al. 2008a, MNRAS, 391, 1854.
- Gelino et al. (2002) Gelino, C. R. et al. 2002, ApJ, 577,433.
- James (1964) James, R. 1964, ApJ, 140, 552
- Kirkpatrick (2005) Kirkpatrick, J. D. 2005, ARAA, 43, 195.
- Koen (2003) Koen, C. 2003, MNRAS, 346, 473.
- Leroy (1995) Leroy, J. L. 1995, A&A Suppl. 114, 79.
- Liu & Weng (2006) Liu,Q. & Weng, F. 2006, Applied Optics, 45, 7475.
- Marley et al. (2002) Marley, M. S. et al. 2002, ApJ, 568, 335.
- Menard et al. (2002) Menard, F. et al. 2002, A&A, 396, L35.
- Menard & Delfosse (2004) Menard, F. & Delfosse, X. 2004, Semaine de l‘Astrophysique Francaise, ed. F. Combes et al. (EDP-Sciences : Paris 2004) 305.
- Mohanty et al. (2002) Mohanty, S. et al. 2002, ApJ, 571, 469.
- Mohanty & Basri (2003) Mohanty, S. & Basri, G. 2003, ApJ, 583, 451.
- Reiners & Basri (2008) Reiners, A. & Basri, G. 2008, ApJ, 684, 1390.
- Saumon & Marley (2008) Saumon, D. & Marley, M. S. 2008, ApJ, 689, 1327.
- Sengupta & Marley (2009) Sengupta, S. & Marley, M. S. 2009, ApJ, 707, 716.
- Sengupta & Krishan (2001) Sengupta, S. & Krishan, V. 2001, ApJ, 561, L123.
- Sengupta & Kwok (2005) Sengupta, S. & Kwok, S. 2005, ApJ, 625, 996.
- Stephens et al. (2009) Stephens, D. C. et al. 2009, ApJ, 702, 154.
- Tata et al. (2009) Tata, R. et al. 2009, A&A, 508, 1423.
- Tsuji (2005) Tsuji, T. 2005, ApJ, 621, 1033.
- Zapatero Osorio et al. (2005) Zapatero Osorio, M. R. et al. 2005, ApJ, 621, 445.


| Serial | Discovery | Spectral | Estimated | Photometric | % | % | |
|---|---|---|---|---|---|---|---|
| No. | name | type | (K) | variability | (kms-1) | ||
| (Optical) | |||||||
| 1 | DENIS-P | L8 | 1340 50 | Yes | 0.167 | 0.04 | 40.8 8 aaMohanty & Basri (2003) |
| J0255-4700 | (1200-1300) | (41-48) | |||||
| 2 | LHS 102B | L5 | 1605 100 | – | 0.105 | 0.036 | 32.5aaMohanty & Basri (2003) (41) |
| 3 | 2MASS | L3.5 | 1780 100 | No | 0.199 | 0.028 | 45bbReiners & Basri (2008) |
| J0036+1821 | (1700-1800) | (48) | |||||
| 4 | DENIS-P | L2 | 1966.5 100 | – | 0.122 | 0.042 | – |
| J2036-1306 | (41-48) | ||||||
| 5 | DENIS-P | L0 | 2234 100 | – | 0.083 | 0.017 | – |
| 2000-7523 | (48) | ||||||
| 6 | 2MASS | L5 | 1605.5 100 | No | 0.036 | 0.0 | 27.2 ccBailer-Jones (2004) |
| J1507-1627 | (1600-1700) | (27.2) | |||||
| 7 | 2MASS | L1.5 | 2100 100 | – | 0.711 | 0.142 | 76bbReiners & Basri (2008) |
| J1807+5015 | (105) | ||||||
| 8 | Denis-P | L7.5(IR) | 1419 100 | – | 0.62 | 0.16 | – |
| J2252-1730 | (90) | ||||||
| 9 | 2MASS | L5 | 1605 100 | – | 0.58 | 0.19 | – |
| J0144-0716 | (90) | ||||||
| 10 | Kelu-1 | L2 | 1966.5 100 | Yes | 0.8 | 0.27 | 60aaMohanty & Basri (2003) |
| (105) | |||||||
| 11 | 2MASS | L1/L4.5 | 1850 250 | – | 0.45 | 0.15 | – |
| J0141+1804 | (90-105) | ||||||
| 12 | 2MASS | L0.5 | 2166 100 | No | 0.57 | 0.19 | 19 bbReiners & Basri (2008) |
| J1412+1632 | (–) | ||||||
| 13 | 2MASS | L0.5 | 2166 100 | – | 0.23 | 0.06 | – |
| J1707+4301 | (105) | ||||||
| 14 | 2MASS | L4.0 | 1718 100 | – | 1.38 | 0.35 | – |
| J2158-1550 | (100) | ||||||
| 15 | 2MASS | L6.5 | 1460 100 | very red | 2.45 | 0.47 | – |
| J2244+2043 | () |