11email: aladro@iram.es 22institutetext: Centro de Astrobiología (CSIC-INTA), Ctra. de Torrejón Ajalvir km 4, E-28850 Torrejón de Ardoz, Madrid, Spain. 33institutetext: European Southern Observatory, Alonso de Córdova 3107, Vitacura, Casilla 19001, Santiago 19, Chile. 44institutetext: Harvard-Smithsonian Center for Astrophysics, 60 Garden St. 02138, Cambridge, MA, USA. 55institutetext: Joint ALMA Observatory, Av. Alonso de Córdova 3107, Vitacura, Santiago, Chile. 66institutetext: Department of Physics and Astronomy, University College London, Gower Street, London WC1E 6BT, UK.
CS, HC3N and CH3CCH multi-line analyses
towards starburst galaxies
Abstract
Aims. We aim to study the properties of the dense molecular gas towards the inner few 100 pc of four nearby starburst galaxies dominated both by photo dissociation regions (M 82) and large-scale shocks (NGC 253, IC 342 and Maffei 2), and to relate the chemical and physical properties of the molecular clouds with the evolutionary stage of the nuclear starbursts.
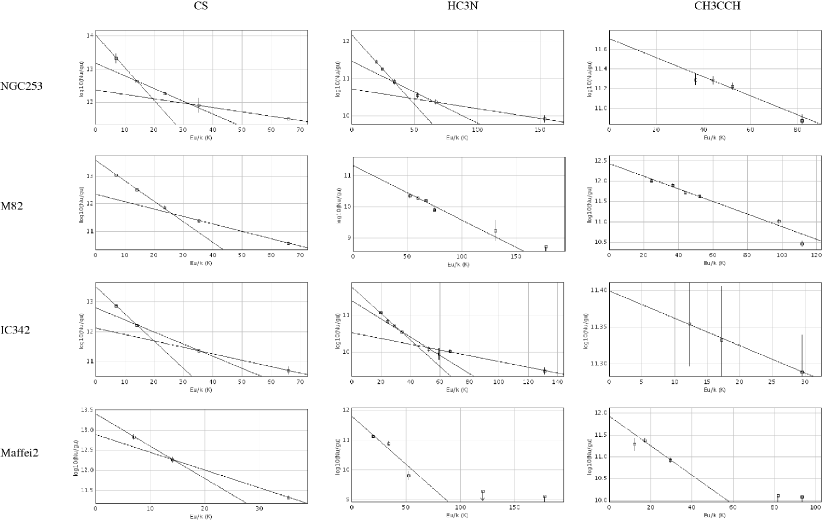
Methods. We have carried out multi-transitional observations and analyses of three dense gas molecular tracers, CS, HC3N (cyanoacetylene) and CH3CCH (methyl acetylene), using Boltzmann diagrams in order to determine the rotational temperatures and column densities of the dense gas, and using a Large Velocity Gradients model to calculate the H2 density structure in the molecular clouds.
Results. The CS and HC3N data indicate the presence of density gradients in the molecular clouds. These two molecules show similar excitation conditions, suggesting that they arise from the same gas components. In M 82, CH3CCH has the highest fractional abundance determined in a extragalactic source ().
Conclusions. The density and the chemical gradients we have found in all galaxies can be explained in the framework of the starburst evolution, which affects the chemistry and the structure of molecular clouds around the galactic nuclei. The young shock-dominated starburst galaxies, like presumably Maffei 2, show a cloud structure with a rather uniform density and chemical composition which suggests low star formation activity. Molecular clouds in galaxies with starburst in an intermediate stage of evolution, such as NGC 253 and IC 342, show clouds with a large density contrast (two orders of magnitude) between the denser regions (cores) and the less dense regions (halos) of the molecular clouds and relatively constant chemical abundance. Finally, the galaxy with the most evolved starburst, M 82, has clouds with a rather uniform density structure, large envelopes of atomic/molecular gas subjected to UV photodissociating radiation from young star clusters, and very different chemical abundances of HC3N and CH3CCH.
Key Words.:
galaxies: starburst – ISM: molecules – galaxies: individual: NGC 253, M 82, IC 342, Maffei 2– galaxies: nuclei – Radio lines: galaxies1 Introduction
Molecular clouds within the central region of our galaxy provide good templates for a better understanding of the molecular emission from the nuclei of external galaxies. The study of well known molecular clouds in the Milky Way, like those affected by shock waves due to cloud-cloud collisions, mass loss from massive stars, gas accretion and explosive events like supernovae (e.g. Martín-Pintado et al. 1997; Hüttemeister et al. 1998), those pervaded by UV dissociating radiation from the massive stars that create large photo dissociation regions (PDRs) (e.g. Martín et al. 2008a), and also those which study regions affected by X-rays (XDRs) (e.g. Martín-Pintado et al. 2000; Amo-Baladrón et al. 2009), allows to use the chemical composition to infer the physical processes dominating the heating of the molecular clouds. Such studies also provided a powerful tool to study not only the type of dominant activity but the evolution of the dense ISM in the obscured regions within galactic nuclei. For instance, the HCO+-to-HCN line intensity ratios have been used for discriminating between AGNs and starburst signatures in the galaxy centers (Kohno et al. 2001; Imanishi et al. 2004; Krips et al. 2008). Other intensity ratios, like HNC/HCN, are also used for differentiating between XDRs and PDRs contribution in different stages of evolution (Loenen et al. 2008; Baan et al. 2008). As another example which uses column densities derived from multi-line analyses, the HNCO/CS abundance ratio was proposed for differentiating between the starbursts mainly dominated by shocks or UV fields. (Martín et al. 2009a).
The nearby (3 Mpc) galaxies NGC 253 and M 82, are two of the brightest infrared extragalactic sources, and among the most outstanding in terms of detection of extragalactic molecules (Mauersberger & Henkel 1993; Martín et al. 2006b, Aladro et al., 2010b, in prep.). Simple molecules such as CO or CS are observed towards both sources with similar column densities and abundances. However, nearly all the species detected so far, in particular the more complex ones (NH3, HNCO or CH3OH), as well as SiO, show systematically lower abundances in M 82 than in NGC 253 and other starburst galaxies such as IC 342 and Maffei 2 (Takano et al. 2003; Martín et al. 2009a). The observed differences among galaxies are not only due to excitation, but reflect different chemical compositions. The large overall abundance of HCO in M 82 has been interpreted as evidence for a chemistry mainly dominated by photon-dominated regions (PDRs) within its central 650 pc (García-Burillo et al. 2002), which does not mean that other processes like shocks or X-ray heating do not take place in its nucleus (Baan et al. 2008). The dissociating radiation explains the low abundance in M 82 of the complex and fragile species cited above (Mauersberger et al. 2003; Martín et al. 2006a). Other molecules like CS are not under-abundant in M 82 relative to NGC 253, which can also be explained in terms of PDRs chemistry, since a high abundance of this molecule is predicted for slightly shielded regions (Drdla et al. 1989; Sternberg & Dalgarno 1995). This evidence, as well as the detection of other PDR enhanced species such as HOC+ and CO+ has led to think of M 82 as the prototype of a giant extragalactic PDR (Nguyen-Q-Rieu et al. 1989; Mao et al. 2000; García-Burillo et al. 2002; Martín et al. 2009a).
| Galaxy | RA | DEC | Type | D | N(H2) d | e | SFR | e | M | ||
|---|---|---|---|---|---|---|---|---|---|---|---|
| (J2000) | (J2000) | (Mpc) | (kms-1) | (′′) | (x1022 cm-2) | (x109 ) | ( yr-1) | (x109 ) | (x108 ) | ||
| M 82 | 09:55:51.9 | +69:40:47.1 | I0 | 3.6 | 300 | 12.0 | 7.9 | 29.74 | 9 | 1.30 | 5.2 |
| NGC 253 | 00:47:33.4 | -25:17:23.0 | SAB(s)c | 3.9 | 250 | 20.0 | 6.2 | 15.10 | 3.6 | 2.57 | 28.0 |
| IC 342 | 03:46:48.5 | +68:05:46.0 | SAB(rs)cd | 3.3 | 31 | 10.6 | 5.8 | 2.26 | 2.5 | 18.2 | 1.4 |
| Maffei 2 | 02:41:55.1 | +59:36:15.0 | SAB(rs)bc | 3.3 | -17 | 11.0 | 4.4 | 2.7 | 0.5 | … | 8.0 |
- a
-
b
Velocities respect to the Local Standard of Rest. In M 82 the value refers to the North-East lobe.
- c
-
d
Values taken from Mauersberger et al. (2003), and further corrected by the source size in column 7.
-
e
Values taken from de Vaucouleurs et al. (1991).
- f
-
g
Estimation of the global molecular gas mass contained in the source. We have assumed that the gas is in a virial equilibrium. For the estimations we used the source sizes of column 7 and an average linewidths calculated from those presented in Table LABEL:TableA1.
On the other hand, the central regions of NGC 253 and Maffei 2 appear to resemble quite closely the giant molecular cloud complexes within our Galactic central regions where the low velocity shocks and massive star formation dominate the chemistry of the molecular material (Martín et al. 2006b). Through the HNCO/CS ratio it has been shown that, the nuclear region of NGC253, though less dominated by UV radiation than in M 82, is significantly more UV pervaded than in IC 342 or Maffei 2. This has been confirmed by the recent detection of the PDR tracers HCO, HOC+, and CO+ in NGC 253 (Martín et al. 2009b). The observed chemical differences are interpreted as the evolution of the starburst phenomenon, where M 82 would be in a later stage (probably in a post-starburst phase where almost all the gas has already been converted into stars), while NGC 253 or Maffei 2 centers would host younger starbursts (where still there are a large amount of reservoir gas which is being used to form the stars). This point can be used to link the stage of evolution of the starburst galaxy centers with the dominant physical processes (PDRs, shocks, XDRs), in such a way that a possible scenario, as seen by the single dish telescopes, could be that the more evolved (or post-starbursts) galaxies, like M82, are mainly dominated by UV fields creating large PDRs, while the younger starburst are basically dominated by shocks between the molecular clouds. It does not necessary implies that these are the unique processes taking place, but the dominant ones.
Interferometric maps of several molecules towards the center of IC 342 show that both, PDRs and shock-dominated regions, can be resolved within its inner few 100 pc (Meier & Turner 2005), while observations with single dish telescopes do not have the resolution to distinguish between these two types of activities in the nucleus. Thus, the overall scenario for IC342, based on beam averaged observations, is a mainly shock-dominated nucleus, as shown by the HNCO/CS ratio (Martín et al. 2009a). This galaxy seems to be in an early starburst stage, as shown by some shocks tracers like SiO or CH3OH (Usero et al. 2006). On the other hand, Maffei 2 seems the galaxy in our sample where C-shocks produced by cloud-cloud collisions play the most important role, being able to explain its high gas kinetic temperatures and chemical abundances (Mauersberger et al. 2003).
In this paper we present observations of CS, HC3N and CH3CCH towards the nuclei of four starburst galaxies. We aim to relate the chemical and physical properties derived from the analyses of these three dense gas tracers (densities, temperatures and fractional abundances) with the stage of evolution of each starburst. The outline of the paper is as follows. In Sect. 2 we present our observations and other complementary line data taken from the literature. In Sect. 3 we explain the data analysis. The data are first analyzed under the local thermodynamic equilibrium (LTE) approximation in Sect. 3.1, where we obtain the column densities and rotational temperatures, which give us a first hint on the cloud structure. Sect. 3.2 presents the results from a LVG modelling under non-LTE assumption. From this model, we estimate the H2 densities for different cloud components. In Sect. 4, we discuss the results of both approaches, taking into account their validity and limitations, and relating those results with the evolutionary stage of the molecular clouds in each galaxy. Finally, in Sect. 5 we present our conclusions.
| Transition | Frequency | / | a | Galaxy | |
| (GHz) | (′′) | (cm-3) | |||
| CS | 97.981 | 1.25 | 25.5 | NGC 253, IC 342 | |
| CS | 146.969 | 1.35 | 16.8 | IC 342, M 82 | |
| CS | 244.936 | 1.79 | 10.1 | NGC 253, IC 342, Maffei 2, M 82 | |
| HC3N | 81.881 | 1.22 | 30.2 | IC 342, Maffei 2 | |
| HC3N | 90.979 | 1.23 | 27.5 | IC 342 | |
| HC3N | 100.076 | 1.25 | 24.9 | IC 342 | |
| HC3N | 109.174 | 1.27 | 22.2 | IC 342, Maffei 2 | |
| HC3N | 136.464 | 1.32 | 18.2 | IC 342, M 82, Maffei 2 | |
| HC3N | 145.561 | 1.35 | 16.9 | IC 342, M 82 | |
| HC3N | 154.657 | 1.38 | 16.0 | IC 342, M 82 | |
| HC3N | 163.753 | 1.41 | 15.1 | M 82 | |
| HC3N | 209.230 | 1.60 | 12.0 | … | Maffei 2⋆ |
| HC3N | 218.325 | 1.66 | 11.5 | … | IC 342, M 82 |
| HC3N | 254.699 | 1.92 | 9.7 | … | M 82, Maffei 2⋆ |
| CH3CCH | 85.457 | 1.22 | 29.1 | IC 342, Maffei 2 | |
| CH3CCH | 102.548 | 1.28 | 24.2 | IC 342, Maffei 2 | |
| CH3CCH | 136.728 | 1.32 | 18.2 | M 82, IC 342, Maffei 2 | |
| CH3CCH | 153.817 | 1.38 | 16.1 | M 82 | |
| CH3CCH | 170.906 | 1.44 | 14.4 | M 82 | |
| CH3CCH | 222.167 | 1.25 / 1.68 b | 21.7 / 11.3 b | NGC 253, Maffei 2⋆ | |
| CH3CCH | 239.252 | 1.80 | 10.3 | Maffei 2⋆ | |
| CH3CCH | 256.337 | 1.87 | 9.6 | M 82 | |
| CH3CCH | 273.420 | 2.02 | 9.1 | M 82 | |
| c-C3H2 | 85.339 | 1.22 | 29.2 | … | Maffei 2 |
| c-C3H2 | 218.160 | 1.66 | 11.5 | … | M 82 |
| H2CO | 145.603 | 1.35 | 16.9 | M 82, IC 342 | |
| H2CO | 218.222 | 1.66 | 11.5 | M 82, IC 342 | |
| H2CO | 218.476 | 1.53 | 11.5 | M 82 |
- Last column indicates the galaxies where each transition was observed. Name in italics means a new detection.
-
∗
Name with ⋆ means an upper limit of the line intensity.
-
a
Critical densities corresponding to a = 90 K. Due to a lack of collisional coefficients in our LVG model for CH3CCH, the for this molecule were calculated using the collisional coefficients of CH3CN, which are very similar.
-
b
The first value corresponds to NGC 253 observed with the JCMT telescope, and the second value corresponds to Maffei 2 observed with IRAM 30-m telescope.
2 Observations and data reduction
We have detected a total of 37 transitions of CS, CH3CCH and HC3N towards the nuclear regions of the starburst galaxies M 82, NGC 253, IC 342 and Maffei 2, plus 5 additional non-detections. 26 out of the 37 transitions are newly detected. Table 1 shows the main characteristics of these galaxies and Table 2 lists the observed lines. We have used the IRAM 30-m telescope (Pico Veleta, Spain), except for the CH3CCH line, which has been observed with the JCMT telescope (Mauna Kea, Hawaii, USA)111The James Clerk Maxwell Telescope is operated by The Joint Astronomy Centre on behalf of the Science and Technology Facilities Council of the United Kingdom, the Netherlands Organization for Scientific Research, and the National Research Council of Canada.. The observations were carried out in several periods between 2005 and 2009. At the IRAM 30-m telescope, we used the, now decommissioned, ABCD SIS receivers tuned simultaneously in single sideband mode in the 1, 2 and 3 mm bands. Observations were carried out in wobbler switching mode with a symmetrical throw of 220′′ in azimuth and a switching frequency of 0.5 Hz. As back-end, we used the MHz filter banks. The beam sizes for each frequency are given in Table 2. The pointing was checked every one or two hours towards several standard pointing calibrators, with an accuracy of . The spectra were calibrated with a standard dual load system. The image sideband rejection at the observed frequencies ranged from 10 dB to 32 dB. The JCMT observations were carried out during the summer period in 2005. Observations were performed in beam switched mode with a frequency of 1 Hz and a beam throw of in azimuth. We used the A3 receiver in double side band to observe the CH3CCH transition at 222.1 GHz. As spectrometer we used the now decommissioned Digital Autocorrelation Spectrometer (DAS) in wide band mode which provided a bandwidth of 1800 MHz at a 1.5 MHz spectral resolution. The telescope beam size was 22′′. The pointing was also checked every hour, with an accuracy of 3′′.
The observed positions of the galaxies are shown in Table 1. M 82 observations were pointed towards the North-East molecular clump, where the photodissociating radiation is claimed to be stronger, as seen in the HCO interferometric maps of García-Burillo et al. (2002) (offsets () with respect to its coordinates in Table 1). In some cases, emission from the center of the galaxy was picked up by the beam, in particular for the lower frequency transitions (bigger beams) where the spectra show a bump at the left of the lines. NGC 253 was observed towards the same position where the 2 mm frequency survey was carried out by Martín et al. (2006b). Maffei 2 and IC 342 were observed towards their centers.
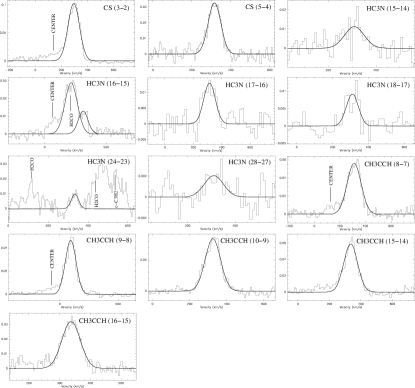
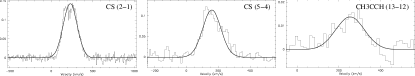
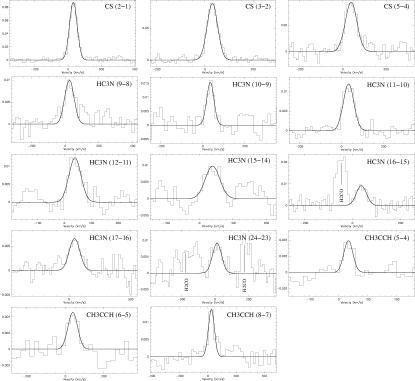
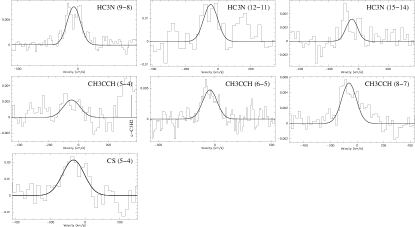
The data, shown in Figs. 1 to 4, are given in a scale, obtained from as =(/) . The conversion factor (/) is given in Table 2 for each transition. Baselines of order 0 or 1 were subtracted in most cases. The rms of the residuals after the baseline subtraction are shown in Table LABEL:TableA1. Gaussians profiles were fit to all detected lines (see Figs. 1 to 4). We have used the CLASS222CLASS software package for data reduction and Gaussian profile fitting.
The intensity of the molecular emission for all species was also corrected by the beam dilution effect, due to the coupling between the source and the telescope beam, as , where is the source averaged brightness temperature, is the source size, is the beam size in arc seconds, and is the measured main beam temperature. Since CS, HC3N and CH3CCH require similar excitation conditions (see critical densities in Table 2), it is plausible to use the same source size for all transitions. In the case of NGC253, we compared the brightness temperature of CS observed with the SEST telescope (Martín et al. 2005) with the same line observed with the IRAM 30-m (this work). Using the relation between and , the comparison of both observations leads to a 20′′ equivalent source size, which agrees with the value used by Martín et al. (2006b). For the other galaxies, there are no transitions observed at the same position with different telescopes, so we adopted source sizes derived from other studies listed in Table 1. The influence of the source size in the rotational temperatures and column densities can be seen in Bayet et al. (2009) for CS in M 82, NGC 253 and IC 342, among other galaxies. The assumption of similar source size for all transitions might have a small contribution to the derived temperature structure () and less than a factor of 2 in the total column densities. On the other hand the assumed source size for each galaxy will have an almost insignificant effect on the temperatures () but might have a strong effect in the column densities in the case of the source size being much smaller () than the one assumed.
Apart of CS, HC3N and CH3CCH, other molecules are detected in the observed bands. In particular, H2CO , H2CO and H2CO have been detected in M 82 and IC 342. c-C3H2 is seen in M 82, and c-C3H2 is detected in Maffei 2. These lines are shown in Figs. 1 to 4 and listed in Table 2. No lines are blended except for HC3N, which is contaminated by H2CO . In this case, we estimated the contribution of H2CO from other detections of this molecule (Aladro et al. 2010b, in prep.) and subtracted it. Then, we fitted a Gaussian profile to the residuals.
In our analysis we also included some results from the literature in the 3, 2 and 1 mm bands. We also included the CS sub-millimeter line when available. Details can be found in Table LABEL:TableA1. For NGC 253, we took the HC3N lines from Mauersberger et al. (1990), that cover the full range from 81.9 GHz to 236.5 GHz. We also used several CH3CCH lines from Martín et al. (2006b) in the 2 mm band. For M 82, we complement our CS and CH3CCH detections with those of Bayet et al. (2009) and Mauersberger et al. (1991), respectively. Finally, for IC 342 and Maffei 2 only few CS lines were taken from the literature (see Table LABEL:TableA1). It has to be noted that some CS lines compiled from the literature were observed towards slightly different positions, so there might be a small error associated to the different emission intensity in regions separated by a few arc seconds. In particular, the CS lines in NGC 253 differ a maximum of 6′′ in declination, while the CS lines in Maffei 2 differ a maximum of 7′′. In Sect. 3.1,we estimate the error introduced in our results by the difference in the observed positions.
We found that for NGC 253 some of the compiled lines have a velocity resolution high enough for separating the two velocity components, roughly at 180 and 280 km s-1, which arise from the molecular lobes separated by 10′′, and located on both sides of the nucleus (Harrison et al. 1999, Mauersberger et al. 2003). For other observations, only one component was reported. In order to keep all data homogeneous, in our detections we have also fit only one Gaussian profile per line. In any case, from the two velocity components analysis carried out by Bayet et al. (2009) for CS and by Martín et al. (2006b) for HC3N, it can be seen that the differences between both components are of little significance.
In a similar way, Maffei 2 also shows two velocity components that could not be separated in the lines taken from the literature. Therefore, in our detections we also fit only one Gaussian to both profiles. We have checked that a single Gaussian fit, both in NGC 253 and Maffei 2, leads to the same results as two Gaussians fit in terms of structure and properties of the gas. Thus, using just one velocity component does not affect our conclusions.
| Galaxy | Molecule | N | N / N | |
| (cm-2) | (K) | |||
| NGC 253 | ||||
| CS† | 4.4 1.1 | |||
| 12.0 3 | ||||
| 33.1 8.3 | ||||
| HC3N | 11.6 1.8 | |||
| 26.1 4.5 | ||||
| 73.3 14.0 | ||||
| CH3CCH | 44.4 7.7 | |||
| M 82 | ||||
| CS | 5.8 0.1 | |||
| 15.1 0.9 | ||||
| HC3N | 24.7 3.9 | |||
| CH3CCH | 28.1 1.2 | |||
| IC 342 | ||||
| CS | 4.7 0.1 | |||
| 10.6 0.2 | ||||
| 20.1 4.0 | ||||
| HC3N | 13.1 2.3 | |||
| 20.6 3.3 | ||||
| 70.6 21.2 | ||||
| CH3CCH ⋆ | 70.0 | |||
| Maffei 2 | ||||
| CS† | 5.4 4.5 | |||
| 9.78.1 | ||||
| HC3N | 11.6 0.8 | |||
| 53.1 | ||||
| CH3CCH | 12.8 1.9 | |||
| 46.9 |
- Column densities (N) and rotational temperatures () obtained from the linear fits shown in Fig. 5 for each galaxy and molecule.
-
The last column shows the relative abundances using the total column densities of Table 1.
Before comparing, we have added up all the column densities we have obtained for a molecule.
-
†
The large errors in both N and reflect the uncertainty in the worse case scenario due to the different observed positions for the CS lines (see Sect. 3.1).
-
⋆
The obtained values of and are not reliable for the observed lines due to their large uncertainties (see the corresponding Boltzmann Diagram in Fig. 5), so we have adopted =70 K and calculated through this value.
3 Results: Multi-transition analyses
In this Sect. we present the detailed analysis of the multi-transition observations of CS, CH3CCH, and HC3N both under LTE and non-LTE approximations. During the analysis we derive the physical parameters for different molecular gas components within each source. It is important to note that these “gas components” are a simplification of the real structure of the molecular clouds. Though the real molecular clouds present gradients in temperature, density, and molecular abundances, this approach helps sketching the differences between the structure of molecular clouds in each galaxy.
3.1 LTE analysis: Determination of rotational temperatures and column densities.
We analyzed the detected transitions under the LTE approximation, assuming optically thin emission. Estimations of the column density () and rotational temperature () were obtained using the Boltzmann diagrams (see Goldsmith & Langer 1999 for a detailed explanation of the method and equations). The spectroscopic parameters were taken from the CDMS (Müller et al. 2001; Müller et al. 2005) and JPL catalogs (Pickett et al. 1998).
In the case where all lines are emitted under LTE conditions with an uniform excitation temperature, a single straight line can be fitted to all population levels. The derived will be a lower limit to the kinetic temperature () if the lines are sub-thermally excited, e.g. if the H2 densities are not sufficiently high to counterbalance spontaneous decay of the excited levels, which is the assumption used here. However, molecular emission arises from clouds with gradients in physical conditions which appears as different rotational temperatures components. In those cases, it is not possible to fit a single , but several values of are needed to fit all the data. Although a continuous temperature distribution seems more realistic, we here fit a discrete number of temperature components. This is sufficient to print out the temperature changes to be expected. In order to sample a wide range of physical conditions in the clouds, it is necessary to observe several transitions well separated in energies. This implies the observation of low and high excitation molecular lines. In this paper, we present the first detection of several high HC3N and CH3CCH transitions, which allow us to sample for the first time the high excitation gas components previously undetected.
The Boltzmann diagrams for all galaxies and molecules are shown in Fig. 5. The column densities and rotational temperatures fitted through the LTE analysis are shown in Table 3. The column densities are source averaged with the source size of Table 1. Note that each N and are obtained from one linear fit, so they refer to two or more population levels. We used the MASSA333MASSA software package for this analysis. Relative abundances derived for the different gas components traced by every molecule are also shown in Table 3.
As already pointed out in Sect. 2, the CS lines in NGC 253 and Maffei 2 were observed towards slightly different positions. We have estimated the error introduced in the column densities and rotational temperatures due to the differences in the observed positions. For NGC 253, CS lines differ a maximum of 6′′ in declination. In the worst case, this represents 60% of the IRAM beam size. Mauersberger & Henkel (1989) observed the CS line towards several positions of the NGC 253 center, separated by 10′′ both in declination and right ascension. Our (, )= position corresponds to their position in their map. Then, we can calculate the intensity change due to an offset of 10′′ in declination. Taking their and positions, we obtain a decrease of 55% in the integrated intensity and 34% in the line intensity. Therefore, if the difference in declination is only of 6′′, one could expect that the integrated intensity, used for plotting the Boltzmann diagrams, had to be decreased by less than 33%. If we re-plot the Boltzmann diagram using 33% of the integrated intensity of our CS, the variation of the column density and rotational temperature is less than 41% and 25% respectively. These variations in and also reflect the normal deviation of the results between our work and that of Mauersberger & Henkel (1989), due to different instrumentation used and calibration errors.
Unfortunately, we cannot make such an estimate for the CS line, since it has not been observed towards several positions within the center of NGC 253. However, for a separation of 6′′ in declination, about half of the beam size at this frequency, we might expect a variation of less than a factor 1.3 in column densities and 1.2 in rotational temperatures.
In the case of Maffei 2, there are neither CS lines observed in several positions. The separation between the CS lines we have used is 7′′ and 4′′ in declination for the CS J= and respectively (1/4 of the beam in both cases, which means a variation of 15% of the integrated intensity). Thus, the expected difference in column densities and rotational temperatures are of less than a factor 1.2.
The main results from the LTE analysis are:
-
•
CS and HC3N show similar excitation structure in NGC 253 and IC 342, where three temperature components can be fitted. This fact suggests that these two molecules are well mixed and tracing the same gas components. This possibility is further discussed and supported by the non-LTE analysis carried out in Sect. 3.2.
-
•
The excitation of the molecular gas in Maffei 2 and M 82 as traced by HC3N can be fitted by a single rotational temperature. Only CS shows two different . The temperature gradient in these galaxies is significantly less pronounced than in NGC 253 and IC 342. Nevertheless, since we cannot rule out higher excitation gas components, we computed upper limit values of and column densities from the undetected highest J-transitions of HC3N and CH3CCH in Maffei 2 (see Table LABEL:TableA1).
-
•
CH3CCH shows a high excitation temperature relative to the other species for the galaxies in our sample ( = 13 and 44 K for Maffei 2 and NGC 253 respectively, and 28 K for M 82). This is not conclusive for IC 342, since the errors are still too large. These high rotational temperatures are expected from the relatively low dipole moment of CH3CCH of 0.78 D (Burrell et al. 1980), compared to 3.7 D for HC3N (De Leon et al. 1985), which makes from CH3CCH a better approximation to kinetic temperature than higher dipole molecules. Unlike other complex molecules such as CH3OH, methyl acetylene shows high column densities and relative abundances in M 82 ( cm-2, ). Since this molecule might be easily photo-dissociated by intense UV fields (Fuente et al. 2005), lower abundances would have been expected in a PDR nucleus like the center of M 82.
-
•
The high lines of HC3N trace the warmest gas, reaching rather high rotational temperatures of 73.314.0 K in NGC253 and 70.621.2 K in IC 342. No other molecules have been found to have such high rotational temperatures in these galaxies so far, with the exception of those derived from ammonia of 120 K and 443 K for NGC 253 and IC 342, respectively. These results turn HC3N into one of the best suited species for tracing the warmest and densest molecular gas in galaxies.
3.2 Non-LTE analysis. Estimation of the H2 densities.
In order to quantify the volume densities, n(H2), and support/explain the multiple rotational temperatures, we have used a Large Velocity Gradient (LVG) statistical equilibrium model. Excitation effects due to line radiation trapping were taken into account, using the LVG approximation consisting of molecular clouds with homogeneous spherical distribution. In this model, we had two free parameters: the volume density, , and the column density per line width, /. We assumed a background temperature to 2.7 K, neglecting the contribution of any additional radiation field. Unfortunately, there are not collisional cross sections available for CH3CCH so we could not run our LVG model in that case. Therefore, for this molecule we have used a LVG model of Mauersberger et al. (1991), which is explained in Sect. 3.2.2. For CS and HC3N, the collisional rates of our LVG model cover the first 12 energy levels for the first one and the first 23 energy levels for the second one.
3.2.1 The kinetic temperature
LVG results suffer to some extent from a degeneracy between the derived ) and the kinetic temperature. Some molecules, like ammonia (NH3) or formaldehyde (H2CO), are outstanding species usually used as thermometers, since the relative populations of their metastable levels are essentially only sensitive to the . Considering that the emission from ammonia and the molecules in our study arise from similar regions, the LVG degeneracy can be broken, since we can use the additional information on the derived from ammonia observations by Mauersberger et al. (2003). The assumption of ammonia arising for a similar volume that the other molecules is justified by the fact that the large ammonia abundances found in these galaxies (Mauersberger et al. 2003) makes it very unlikely that a large fraction of the dense gas observed in CS and HC3N does not contain NH3. The exception is M82, where the ammonia abundance is rather lower than in the clouds of the Milky Way. In this galaxy, H2CO seems to arise from a similar volume than CO (Mühle et al. 2007), which indicates that its molecular emission is more extended than that of NH3, and also traces a warmer and more diffuse component in M 82 than NH3, CS, HC3N or CH3CCH. In fact, all these molecules have high dipole moments, need critical densities to be excited (Mauersberger et al. 2003) much larger than those derived from H2CO (Mühle et al. 2007). Thus, we find ammonia the most reliable tracer of the kinetic temperature, since its characteristics (dipole moment, critical density and emission size) are in an better agreement with CS, HC3N or CH3CCH than other tracers like CO and H2CO.
| Galaxy | Molecule | n(H2) | N | ||
| (cm-3) | (cm-2) | ||||
| NGC 253 | 120 K | ||||
| CS | 0.6 | ||||
| 1.1 | |||||
| 0.9 | |||||
| HC3N | 1.1 | ||||
| 1.4 | |||||
| 1.3 | |||||
| CH3CCH | … | … | |||
| … | … | ||||
| M 82 | 30 K | ||||
| CS | 0.6 | ||||
| 1.0 | |||||
| HC3N | 1.4 | ||||
| CH3CCH | … | … | |||
| IC 342 | 53 K | ||||
| CS | 0.6 | ||||
| 1.0 | |||||
| 1.2 | |||||
| HC3N | 1.1 | ||||
| 1.1 | |||||
| 0.8 | |||||
| CH3CCH | … | … | |||
| … | … | ||||
| Maffei 2 | 48 K | ||||
| CS | 0.2 | ||||
| 1.5 | |||||
| HC3N | 2.9 | ||||
| CH3CCH | … | … | |||
| Maffei 2 | 132 K | ||||
| CS | 0.1 | ||||
| 1.5 | |||||
| HC3N | 2.9 | ||||
| CH3CCH | … | … | … |
- The last column reflects the ratio between the column densities obtained by both LTE and non-LTE approaches.
Thus, we have used the kinetic temperatures derived by Mauersberger et al. (2003) as an input parameter in our LVG model. They obtained a in NGC 253 of 142 K and 100 K, for the two velocity components. Since we do not make any distinction between these two velocity components, we have used the average value of =120 K. In the case of M 82, the kinetic temperature traced by ammonia was 29 K. On the other hand, Maffei 2 and IC 342 show two different rotational temperatures, one for the lower transitions of ammonia, and another one for the higher transitions. In the case of IC 342, the are of 53 K and 443 K respectively. The first one is derived from the transitions = to , having energies in their Boltzmann diagram ranging from 0 to 150 K, while the other component of 443 K is obtained from the fit to the highest transitions, = to , with energies from 300 K to more than 800 K . In our IC342 population diagrams, the energy levels reach, as maximum, 130 K. Thus, one could guess that the gas component at 443 K has little contribution to the relatively low energy transitions we deal with in this paper. So, we have used = 53 K in our LVG analysis shown in Table 4.
For Maffei 2, the two of 48 K and 132 K were taken into account when running the LVG model. Table 4 shows the LVG results for both temperatures. Gas densities obtained from CS for this source are more sensitive to the changes of the than those obtained from HC3N, with variations of up to one order of magnitude in the lower density component. Moreover, the CS and HC3N transitions seem to trace gas with low excitation temperature, as shown by the LTE analysis in Sec 3.1 (from 5 to 10 K for CS and 12 K for HC3N). Following the same arguments used for IC 342 when comparing our upper energy values of the Boltzmann plots with those of Mauersberger et al. (2003), and taking into account that the rotational temperatures are considered as a lower limit of the kinetic temperature, it seems more appropriate to use =48 K instead of Tkin=132 K for Maffei 2.
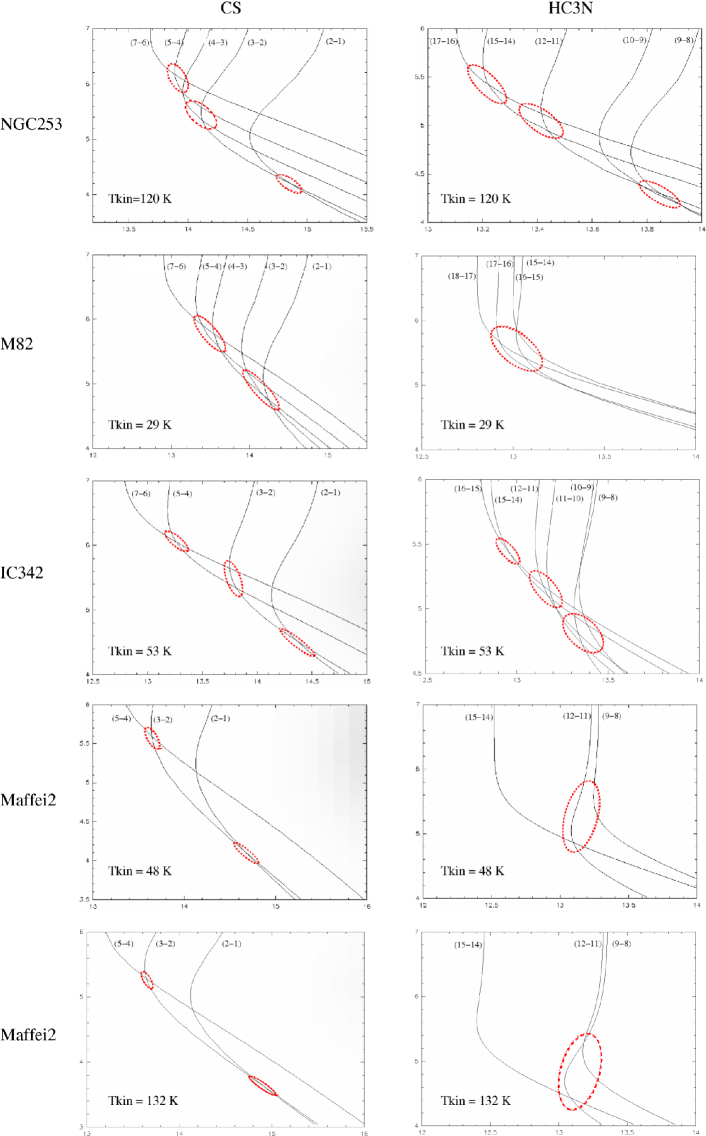
3.2.2 LVG model results
Fig. 6 shows the predictions from our LVG modeling for all galaxies in a diagram for CS or HC3N and taking the kinetic temperatures given above. Lines represent the model results matching the observed brightness temperatures for each transition. The points where two or more lines intersect correspond to the H2 density and the column density which fit those lines. The dashed ellipses show the area where two or more lines intersect to within an error of 10%. Such conservative error was chosen taking into account the errors obtained by Mauersberger et al. (2003), which are always lower than 10% (with the only exception of the 30% uncertainty in the = 48 K for Maffei 2. Nevertheless, such error does not significantly affect our derived parameters). As shown in Fig. 6, we find that several components with different densities are needed to fit all observed lines (as already shown by Bayet et al. 2008 and Bayet et al. 2009), in agreement with the multiple rotational temperatures obtained from the Boltzmann diagrams. Table 4 shows the derived and for the different density components in all the galaxies. The errors in H2 densities and column densities are derived from the 1 errors in the Gaussian fits. The ratios between the column densities of CS and HC3N derived from the LTE analysis and the LVG model for the different density components are also shown in the last column of Table 4.
Unfortunately, our LVG model does not include the collisional cross sections of CH3CCH, and we do not have at our disposal any other similar code prepared to use it. So far, the best approximation to model the excitation of CH3CCH was done by Mauersberger et al. (1991). They run a LVG model for methyl acetylene using the CH3CN collisional rates and rotational constants, since these parameters may be similar for both species. Therefore, for methyl acetylene we used the results of Mauersberger et al. (1991) as a rough estimation of the volume densities within an order of magnitude uncertainty, i.e. , or . On the other hand, although the temperatures used in the Mauersberger et al. (1991) model for CH3CCH do not exactly match those assumed from NH3, these differences in the do not play a relevant role and the volume densities hardly vary when using either the ammonia or the methyl acetylene kinetic temperatures.
The main results from both LVG analyses can be summarized as follows:
-
•
LVG analyses have been used to quantify the density and the molecular column densities of the gas components inferred from the Boltzmann plots. The column densities obtained by both approaches are consistent within a factor of 2 in almost all cases (see Table 4).
-
•
CS traces a very wide range of densities. Similar to the LTE results our data requires three density components in NGC 253 and IC 342, with a density contrast of up to two orders of magnitude between the more diffuse gas () and the densest material (). On the other hand, only two density components are needed to fit the data in Maffei 2 and M 82, with a smoother density gradient of about one order of magnitude.
-
•
HC3N traces a narrower range of densities than CS in M 82 and Maffei 2. In these sources, only one density component is found, with a density of a few 106 cm-3 in M 82, and a several 105 cm-3 in Maffei 2. In fact, cyanoacetylene is not found in the more diffuse gas (104 cm-3) observed in CS in these galaxies. For the other two galaxies, IC 342 and NGC 253, both species trace the same density components, but HC3N systematically provides lower densities than those of CS.
-
•
Using the grid of models of Mauersberger et al. (2003), we have found that CH3CCH seems to be arising from an intermediate component of in M 82, while for IC 342 and NGC 253 could be tracing gas of densities or/and . In the case of Maffei 2, methyl acetylene arises from less dense molecular gas of densities .
| Maffei 2 | IC 342 | NGC 253 | M 82 | |
|---|---|---|---|---|
| () | ||||
| Region I (104 cm-3) | ||||
| Region II (105 cm-3) | ||||
| Region III (106 cm-3) | ||||
-
The fist value indicates the N(HC3N) / N(CS) ratio obtained from our LVG code.
The second value represents the percentage contribution of each Region (I, II or III) to the overall dense molecular gas, traced by CS, within the molecular clouds in the center of the galaxies, obtained from our LVG model.
4 Discussion: Molecular cloud structure in the nuclei of galaxies
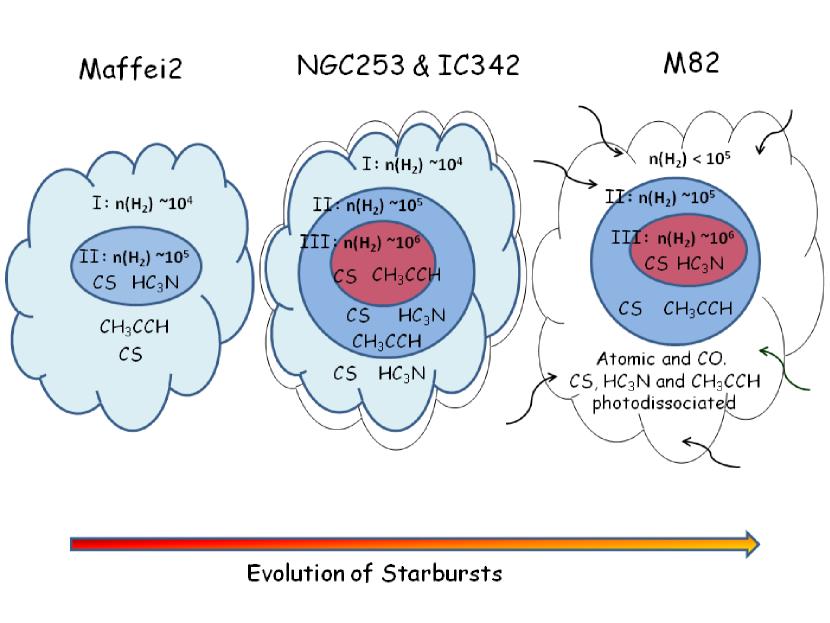
In order to understand the physical structure and properties of the ISM of the galaxies in this paper, we will use the simple molecular cloud structures sketched in Fig. 7. It illustrates the expected evolution of molecular clouds in starburst galaxies. We consider three different regions: The diffuse outer region (halo) with densities of referred to as Region I; the dense gas with densities of referred to as Region II; and the inner and densest gas we can trace (core), the Region III, with densities of . Fig. 7 illustrates how the CS, HC3N and CH3CCH seem to be distributed in the molecular clouds of the central hundred parsecs of the galaxies in our sample. At first glance, the molecular clouds of NGC 253 and IC 342 have a very similar density distributions, while Maffei 2 and M 82 show a different structures. Next, we will discuss why these density distributions point to three different stages of the starburst evolution.
We can make a rough estimation of the molecular cloud sizes, which allows us to know how many molecular clouds could be contained in our beam. Supposing that the gas is in a virial equilibrium and formed by homogeneous clouds of uniform H2 density of n = 105 cm-3, we have obtained an approximate molecular clouds radii of 29, 51, 19 and 34 pc for M 82, NGC 253, IC 342 and Maffei 2 respectively. Taking into account the source size used for each galaxy (see Table 1), it is possible to estimate the number of molecular clouds contained in the beam of about 7, 7, 9 and 5 for M 82, NGC 253, IC 342 and Maffei 2. Although there are not big differences in the numbers, they seem to be consistent with the proposed overall scenario: M82, the galaxy most dominated by the UV fields, is claimed to have smaller and more fragmented clouds (Fuente et al. 2008). Maffei2, on the other hand is the galaxy most dominated by shocks and its clouds seem to be rather bigger, having less number of them in the beam (5). However, these are just rough calculations, since we show in this paper the non negligible temperature and density gradients within molecular clouds, as depicted in Fig. 7. In fact, the observed gas could well be formed of several molecular clouds of different sizes each. Thus, this is something that could be better constrained using theoretical models or interferometric data. Also, the assumed distances to the galaxies play an important role in the values obtained. Nevertheless, in order to see whether our values are consistent with those of the literature, we have compared the most straightforward case of IC342. The size of the molecular clouds we have obtained in this galaxy and the HC3N interferometric map of Meier & Turner (2005) are in good agreement, since they point out that the emission of HC3N in IC 342 is not expected to be more extended than 50 pc.
On the other hand, from the analysis presented in Sect. 3 the CS abundances remain almost constant independently of the dominant process, with the exception of NGC 253. This is likely due to the fact that CS is not significantly affected by any of the dominant process (PDRs or shocks), as shown by Requena-Torres et al. (2006) in the Galactic Center, and Martín et al. (2009a) in a sample of galaxies. On the other hand, HC3N shows low abundance in M 82. This molecule seems to be easily dissociated in PDRs like in the center of this galaxy, as was already proposed by Rodríguez-Franco et al. (1998). At the same time, HC3N is absent in the non-detected Region I of M 82, likely due to the lack of shielding from the dissociating radiation. This is consistent with the idea that CS is more resistant to the UV than HC3N; and cyanoacetylene was not detected in the Region I in Maffei 2 either. In this case, the most likely explanation is that the low density in this region does not excite the molecule, so its lack could be due to excitation effects rather than to chemistry.
As shown in Table 5, the HC3N/CS ratio hardly varies when comparing regions with similar densities among the galaxies. This supports our sketch of the molecular clouds divided in regions, as they not only share similar densities but also molecular abundances. In Table 5 we also present the fraction of gas that each of these components contribute to the overall molecular gas traced by CS (we take this molecule as a reference since it is the one which traces a wider range of densities). In the following we discuss the structure of the different observed sources and its possible relation to the evolution of their nuclear starburst.
4.1 Molecular clouds in galactic centers hosting young starburst. The case of Maffei 2
Maffei 2 is considered to be at a very early state of the starburst evolution (Martín et al. 2009a), with a large amount of reservoir gas in its center, and only a moderate star formation rate (Table 1). The gas kinetic temperatures derived from ammonia ( = 48 and 132 K from Mauersberger et al. 2003) indicate that shocks dominate the ISM heating (as already indicated by e.g. Ishiguro et al. 1989), which is consistent with the HNCO/CS ratio. There are several processes that can contribute to generate shocks in the early phases of the starbursts. One is the existence of a bar, which creates a potential leading to cloud-cloud collisions at the edges. This is, in fact, the case of Maffei 2. The molecular cloud collisions can be also generated by the usual compression which leads to the star formation; and there could also be a contribution from the stellar winds of the newly formed stars.
The molecular clouds in Maffei 2 seem to have large halos (i.e., Region I, which contains of the detected CS) of molecular gas very rich of fragile molecules, like for example ammonia or HNCO, but also CO, as seen by Israel & Baas (2003). The molecular complexes of Maffei 2 show low rotational temperatures of 5-15 K in the molecules studied, and normal fractional abundances of for CS, HC3N and CH3CCH (see Table 3), which are similar to those of the “quiescent” molecular clouds in the Galactic Center (GC), with no, or low, star formation activity. On the other hand, if we consider the upper limits to the undetected lines in Maffei 2 in the LTE analysis, the derived rotational temperatures are less than 53 K from HC3N and 47 K from CH3CCH (see Table 3).
Taking into account all the results from the LTE and non-LTE analyses, the three studied molecules seem to be arising from molecular clouds similar to the molecular clouds with low star formation activity found in the central region of the Milky Way. At this stage, the molecular material is likely to be funneled towards the center of the potential well. In fact, a bar of molecular gas drives the material to the inner central parts (Ishiguro et al. 1989; Hurt & Turner 1991; Kuno et al. 2008), increasing its density and feeding the still relatively low star formation rate found in Maffei 2.
4.2 Molecular clouds in galaxies hosting intermediate-age starbursts: NGC 253 and IC 342
The two galaxies in our sample, NGC 253 and IC 342, which are considered to host a starburst at intermediate stage of evolution, where a large amount of gas has been already converted into starts (Rieke et al. 1988; Schinnerer et al. 2008; Martín et al. 2009b), show molecular clouds with similar physical and chemical structure (see Table 5). The median age of the star clusters in the center of NGC253, studied at optical wavelengths, is 6 Myr (Fernández-Ontiveros et al. 2009), while from near infrared (NIR) continuum emission, Boker et al. (1997) found that the center of IC 342 seems to be dominated by a young cluster of 10 Myr. Although the optical and the NIR ranges trace stellar populations with different ages, these estimations seem to indicate that the star bursts in both sources have probably started at a similar time ago.
Both NGC 253 and IC 342 show a very high density contrast with nearly two orders of magnitude between the Region I and the Region III. Furthermore, Regions III are rather small as compared with the Regions I, but are likely responsible for feeding the star formation at high rates in these galaxies. On the other hand, CO arises in this galaxies from gas with densities in the range (Israel & Baas 2003; Bayet et al. 2004, 2006; Güsten et al. 2006). The average clouds in these two galaxies resemble the Sgr B2 star forming region in the GC. This cloud is centrally peaked surrounded by a large molecular envelope (de Vicente et al. 1996) and shows that very recent star formation is still going-on in the very high density core (de Vicente et al. 2000). As we have mentioned in Sect. 1, IC 342 shows evolved star formation in the center, while at larger radii the stars seem to be younger (Meier & Turner 2005). We would like to emphasize that with single dish telescopes the overall scenario is a mixture of both cloud structures, where shock-dominated and PDR-dominated regions are not distinguished. Thus, the result is a mixture that leads to an intermediate stage of evolution (Martín et al. 2009b), where still a large fraction of the gas is in a high density component and the cores are actively forming stars. As suggested by the detection of PDR tracers in NGC 253 (Martín et al. 2009b) and illustrated in Fig. 7, photodissociation starts playing a role in these clouds in their outermost layers.
4.3 Evolved starburst: M 82
The stellar clusters in the center of M 82 are estimated to be the result of starbursts from at least Myr ago, as seen at optical wavelengths by Konstantopoulos et al. (2009). This value indicates that we are seeing a more evolved starburst (or post-starburst) in M 82, older than the NGC 253 and IC 342 ones (we are not aware of a published stellar population age in the center of Maffei 2). On the other hand, it is well established that newly formed stars in M 82 create large photodissociation regions in its central region (Martín et al. 2006b), which dominate over the other physical processes. Here, we follow the proposed overall scenario of M 82 as a giant PDR, although we are developing for the future a more sophisticated interpretation where PDRs, XDRs and dense gas chemistry are mixed and will be better disentangle. This galaxy shows clouds with less density gradients than those found in the other galaxies, with a density contrast of only a factor of 6 between the two detected gas components (Regions II and III). This could be due to the fact that, in this evolved starburst galaxy, the H2 density in Region II, of about 105 cm-3, is surrounded by an envelope (not detected) where some molecules, especially the complex ones, are destroyed. The low density envelope surrounding the Region II could be dominated by mainly atomic composition with small column densities of resistant molecules like CO. In fact, Mao et al. (2000) have detected CO in M 82 with densities of 103.7 and 103 cm-3, suggesting that this molecule does not trace the same material than high density tracers like CS. Likely the mechanical energy injected by the evolved starbursts had dispersed the outer parts of the clouds making larger and more diffuse envelopes. Thus, the number of gas components with different densities and temperatures can be understood within the starburst evolutionary framework; in the later stage the dense molecular tracers are not arising from the outer parts, since they are dissociated in such regions. At this stage, the outermost photo-dissociated envelope, of densities , might represent a large fraction of the cloud, but with low abundance of complex molecules. At the same time, there is an important contribution of the Region III (106 cm-3), directly related with the large amount of star formation that have already been taken place. The high density component is also shown by observations of CH3OH (Martín et al. 2006b).
Methyl acetylene (CH3CCH) shows a very different behavior in M 82 than the other molecules. First, its column density in M 82, of cm-2, is a factor of 4 larger than that of CS, and more than one order of magnitude than the HC3N one. Its high fractional abundance with respect to , , is puzzling for a molecule which is supposed to be easily dissociated in PDRs (Fuente et al. 2005). The comparison with other molecular clouds dominated both by UV radiation and shocks, in the Galactic Center and in external galaxies, shows that M 82 is the galaxy with the highest CH3CCH abundance observed up to now. SgrA* (-30,-30) and G+0.18-0.04, used as templates of molecular clouds dominated by photodissociating radiation in the Galactic Center of the Milky Way (Martín et al. 2008a), have relative abundances larger than a few 10-9 (Martín, 2006). On the other hand, the relative abundances we find in NGC 253 and Maffei 2 are and respectively. One possible explanation for the high CH3CCH abundance in M 82 is that this molecule can be created through gas phase ion-molecule or neutral-neutral reactions, while other molecules, like methanol or ethanol, are possibly only formed on ice-layers of dust grains (Bisschop et al. 2007). When these complex molecules are dissociated by the strong UV fields of M 82, their abundances decrease, while a similar decrease for CH3CCH is balanced by ion molecule reactions favoring its formation. On the other hand, a strong anti correlation between and has been observed in galactic sources (Lee et al. 1996), and the gas in M 82 is indeed as cold as 30 K. Methyl acetylene is not observed in the regions of densities since it would be dissociated, but in regions of intermediate densities (Region II), where it is well shielded from the dissociating radiation. Furthermore, we do not see it in the Region I, presumably because its abundance in such places is almost negligible, although it could exist there (Chrurchwell & Hollis 1983).
5 Conclusions
From our multi-line studies of CS, HC3N and CH3CCH towards the centers of the starburst galaxies, M 82, NGC 253, IC 342 and Maffei 2, and using both LTE and non-LTE approaches, we conclude that:
- •
-
•
CH3CCH arises from a “warm” ( from 13 K up to 44 K) gas components without large rotational temperature gradients. This molecule shows very high abundances and column densities in M 82 ( cm-2 and cm-2 respectively), and probably arises from a region of densities 105 cm-3 which is well shielded from the strong UV radiation.
-
•
The gas traced by the observed molecules show differences between the galaxies in terms of density structure and composition. This fact allowed us to link the evolution of the starburst with the structure of the molecular gas clouds. First, Maffei 2, the galaxy with the youngest starburst, shows a large low density halo (Region I 104 cm-3) and a more denser Region II with densities of 105 cm-3. This galaxy does not show signs of a dense gas core (Region III), probably because its starburst is still starting. Then, in an intermediate stage of evolution, NGC253 and IC342 clearly show three different gas components. First, a halo of low densities (Region I104 cm-3), possibly surrounded by a small envelope where the molecules are dissociated. Then, an intermediate zone (Region II) of densities105 cm-3; and finally a core of very dense gas (Region III106 cm-3) which points out to the on-going star formation. Finally, M 82, the more evolved starburst galaxy, shows a Region II of intermediate densities of 105 cm-3, probably surrounded by a large envelope dominated by photodissociating radiation, and a Region III of denser gas, comparable in size to the cores of NGC 253 and IC 342.
Acknowledgements.
We thank the IRAM staff for their help with the observations and data reduction. R. Aladro acknowledges the hospitality of ESO Vitacura and the Joint ALMA Observatory. E.B. acknowledges financial support from the Leverhulme Trust. We thank the referee for numerous and constructive comments. This work has been partially supported by the Spanish Ministerio de Ciencia e Innovación under project ESP2007-65812-C02-01, and by the “Comunidad de Madrid” Government under PRICIT project S-0505/ESP-0237 (ASTROCAM).References
- Amo-Baladrón et al. (2009) Amo-Baladrón, M. A., Martín-Pintado, J., Morris, M. R., Muno, M. P., & Rodríguez-Fernández, N. J. 2009, ApJ, 694, 943
- Baan et al. (2008) Baan, W. A., Henkel, C., Loenen, A. F., Baudry, A., & Wiklind, T. 2008, A&A, 477, 747
- Bayet et al. (2004) Bayet, E., Gerin, M., Phillips, T. G., & Contursi, A. 2004, A&A, 427, 45
- Bayet et al. (2006) Bayet, E., Gerin, M., Phillips, T. G., & Contursi, A. 2006, A&A, 460, 467
- Bayet et al. (2008) Bayet, E., Lintott, C., Viti, S., et al, 2008, ApJ, 685, L35
- Bayet et al. (2009) Bayet, E., Aladro, R., Martín, S., Viti, S., & Martín-Pintado, J. 2009, ApJ, 707, 126
- Bisschop et al. (2007) Bisschop, S. E., Jørgensen, J. K., van Dishoeck, E. F., & de Wachter, E. B. M. 2007, A&A, 465, 913
- Boker et al. (1997) Boker, T., Forster-Schreiber, N. M., & Genzel, R. 1997, AJ, 114, 1883
- Burrell et al. (1980) Burrell, PM., Bjarnov, E. & Schwendmann, RH. J. Mol. Spectrosc. 82, 193 (1980)
- Chrurchwell & Hollis (1983) Churchwell, E., & Hollis, J. M. 1983, ApJ, 272, 591
- De Leon et al. (1985) De Leon, R.L.& Muenter, J.S., 1985, J. Chem. Phys 82, 1702
- de Vaucouleurs et al. (1991) de Vaucouleurs, G., de Vaucouleurs, A., Corwin, H. G., Jr., et al. 1991, Vol. 1-3, XII, 2069. Springer-Verlag Berlin, Heidelberg, New York.
- de Vicente et al. (1996) de Vicente, P., Martin-Pintado, J., & Wilson, T. L. 1996, The Galactic Center, Astron. Soc. of the Pacific Conf. Ser., 102, 64
- de Vicente et al. (2000) de Vicente, P., Martín-Pintado, J., Neri, R., & Colom, P. 2000, A&A, 361, 1058
- Drdla et al. (1989) Drdla, K., Knapp, G. R., & van Dishoeck, E. F. 1989, ApJ, 345, 815
- Fernández-Ontiveros et al. (2009) Fernández-Ontiveros, J. A., Prieto, M. A., & Acosta-Pulido, J. A. 2009, MNRAS, 392, L16
- Fingerhut et al. (2007) Fingerhut, R. L., Lee, H., McCall, M. L., & Richer, M. G. 2007, ApJ, 655, 814
- Freedman et al. (1994) Freedman, W. L., Hughes, S. M., Madore, B. F. et al. 1994, ApJ, 427, 628
- Fuente et al. (2005) Fuente, A., García-Burillo, S., Gerin, M., et al. 2005, ApJ, 619, L155
- Fuente et al. (2008) Fuente, A., et al. 2008, A&A, 492, 675
- Gadhi el al. (1984) Gadhi, J., Lahrouni, A., Legrand, J., & Demaison, J. 1995, J. Chem. Phy., 92, 1984
- García-Burillo et al. (2002) García-Burillo, S., Martín-Pintado, J., Fuente, A., Usero, A., & Neri, R. 2002, Apj, 575, L55
- Goldsmith & Langer (1999) Goldsmith, P. F., & Langer, W. D. 1999, ApJ, 517, 209
- Güsten et al. (2006) Güsten, R., Philipp, S. D., Weiß, A., & Klein, B. 2006, A&A, 454, L115
- Israel & Baas (2003) Israel, F. P., & Baas, F. 2003, A&A, 404, 495
- Harrison et al. (1999) Harrison, A., Henkel, C., & Russell, A. 1999, MNRAS, 303, 157
- Hurt & Turner (1991) Hurt, R. L., & Turner, J. L. 1991, ApJ, 377, 434
- Hüttemeister et al. (1998) Hüttemeister, S., Dahmen, G., Mauersberger, R. et al. 1998, A&A, 334, 646
- Imanishi et al. (2004) Imanishi, M., Nakanishi, K., Kuno, N., & Kohno, K. 2004, AJ, 128, 2037
- Ishiguro et al. (1989) Ishiguro, M., et al. 1989, ApJ, 344, 763
- Karachentsev et al. (2003) Karachentsev, I. D., Sharina, M. E., Dolphin, A. E., & Grebel, E. K. 2003, A&A, 408, 111
- Kohno et al. (2001) Kohno, K., Matsushita, S., Vila-Vilaró, B., Okumura, S. K., Shibatsuka, T., Okiura, M., Ishizuki, S., & Kawabe, R. 2001, The Central Kiloparsec of Starbursts and AGN: The La Palma Connection, 249, 672
- Konstantopoulos et al. (2009) Konstantopoulos, I. S., Bastian, N., Smith, L. J., Westmoquette, M. S., Trancho, G., & Gallagher, J. S. 2009, ApJ, 701, 1015
- Krips et al. (2008) Krips, M., Neri, R., García-Burillo, S. et al. 2008, ApJ, 677, 262
- Kuno et al. (2008) Kuno, N., Nakanishi, K., Sorai, K., & Shibatsuka, T. 2008, PASJ, 60, 475
- Lee et al. (1996) Lee, H.-H., Bettens, R. P. A., & Herbst, E. 1996, A&AS, 119, 111
- Loenen et al. (2008) Loenen, A. F., Spaans, M., Baan, W. A., & Meijerink, R. 2008, A&A, 488, L5
- Mao et al. (2000) Mao, R. Q., Henkel, C., Schulz, A. et al. 2000, Aap, 358, 433
- Martín et al. (2005) Martín, S., Martín-Pintado, J., Mauersberger, R., Henkel, C., & García-Burillo, S. 2005, ApJ, 620, 210
- Martín et al. (2006a) Martín, S., Mauersberger, R., Martín-Pintado, J., Henkel, C., & García-Burillo, S. 2006a, ApJS, 164, 450
- Martín et al. (2006b) Martín, S., Martín-Pintado, J., & Mauersberger, R. 2006b, A&A, 450, L13
- Martín et al. (2008a) Martín, S., Requena-Torres, M. A., Martín-Pintado, J., & Mauersberger, R. 2008a, ApJ, 678, 245
- Martín et al. (2008b) Martín, S., Requena-Torres, M. A., Martín-Pintado, J., & Mauersberger, R. 2008b, Ap&SS, 313, 303
- Martín et al. (2009a) Martín, S., Martín-Pintado, J., & Mauersberger, R. 2009a, ApJ, 694, 610
- Martín et al. (2009b) Martín, S., Martín-Pintado, J., & Viti, S. 2009b, ApJ, 706, 1323
- Martín-Pintado et al. (1997) Martin-Pintado, J., de Vicente, P., Fuente, A., & Planesas, P. 1997, ApJ, 482, L45
- Martín-Pintado et al. (2000) Martín-Pintado, J., de Vicente, P., Rodríguez-Fernández, N. J., Fuente, A., & Planesas, P. 2000, A&A, 356, L5
- Mauersberger & Henkel (1989) Mauersberger, R., & Henkel, C. 1989, A&A, 223, 79
- Mauersberger & Henkel (1993) Mauersberger, R., & Henkel, C. 1993, Rev. Mod. Astron, 6, 69
- Mauersberger et al. (1989) Mauersberger, R., Henkel, C., Wilson, T. L., & Harju, J. 1989, A&A, 226, L5
- Mauersberger et al. (1990) Mauersberger, R., Henkel, C., & Sage, L. J. 1990, A&A, 236, 63
- Mauersberger et al. (1991) Mauersberger, R., Henkel, C., Walmsley, C. M., Sage, L. J., & Wiklind, T. 1991, A&A, 247, 307
- Mauersberger et al. (2003) Mauersberger, R., Henkel, C., Weiß, A., Peck, A. B., & Hagiwara, Y. 2003, A&A, 403, 561
- Meier & Turner (2005) Meier, D. S., & Turner, J. L. 2005, ApJ, 618, 259
- Mühle et al. (2007) Mühle, S., Seaquist, E. R., & Henkel, C. 2007, ApJ, 671, 1579
- Müller et al. (2001) Müller, H. S. P., Thorwirth, S., Roth, D. A., & Winnewisser, G. 2001, A&A, 370, L49
- Müller et al. (2005) Müller, H. S. P., Schlöder, F., Stutzki, J., & Winnewisser, G. 2005, J. Mol. Structure, 742, 215
- Nguyen-Q-Rieu et al. (1989) Nguyen-Q-Rieu, Nakai, N., & Jackson, J. M. 1989, A&A, 220, 57
- Pickett et al. (1998) Pickett, H. M., Poynter, I. R. L., Cohen, E. A., et al. 1998, J. Quant. Spectr., 60, 883
- Requena-Torres et al. (2006) Requena-Torres, M. A., Martín-Pintado, J., Rodríguez-Franco, A., et al. 2006, A&A, 455, 971
- Rieke et al. (1988) Rieke, G. H., Lebofsky, M. J., & Walker, C. E. 1988, ApJ, 325, 679
- Rodríguez-Franco et al. (1998) Rodríguez-Franco, A., Martín-Pintado, J., & Fuente, A. 1998, A&A, 329, 1097
- Sage et al. (1990) Sage, L. J., Shore, S. N., & Solomon, P. M. 1990, ApJ, 351, 422
- Schinnerer et al. (2008) Schinnerer, E., Böker, T., Meier, D. S., & Calzetti, D. 2008, ApJ, 684, L21
- Sternberg & Dalgarno (1995) Sternberg, A., & Dalgarno, A. 1995, ApJS, 99, 565
- Strickland et al. (2004) Strickland, D. K., Heckman, T. M., Colbert, E. J. M., et al. 2004, ApJS, 151, 193
- Takano et al. (2000) Takano, S., Nakai, N., Kawaguchi, K., & Takano, T. 2000, PASJ, 52, L67
- Takano et al. (2002) Takano, S., Nakai, N., & Kawaguchi, K. 2002, PASJ, 54, 195
- Takano et al. (2003) Takano, S., Nakai, N., Kawaguchi, K., et al. 2003, IAU Joint Disc., 21,
- Turner (1991) Turner, B. E. 1991, ApJS, 76, 617
- Usero et al. (2006) Usero, A., García-Burillo, S., Martín-Pintado, J., Fuente, A., & Neri, R. 2006, A&A, 448, 457
- Usero et al. (2008) Usero, A., García-Burillo, S., Martín-Pintado, J., Fuente, A., & Neri, R. 2008, EAS Pub. Ser., 31, 117
- Walker et al. (1992) Walker, C. E., Bash, F. N., Martin, R. N., & Phillips, T. G. 1992, BAAS, 24, 1201
- Weiß et al. (2001) Weiß, A., Neininger, N., Henkel, C., Stutzki, J., & Klein, U. 2001, ApJ, 554, L143
Appendix A Table A.1. Gaussian fits parameters results.
| Source | (,) | Line | dv | FWHM | Rms | Int. Time | Ref. | ||
| () | (K km s-1) | (km s-1) | (km s-1) | (mK) | (mK) | (min) | |||
| NGC253 | |||||||||
| CS ∙ | 13.40.3 | 202.7 | 257.1 | 62.1 | 9.4 | 18.0 | c | ||
| CS | 38.10.4 | 200.7 | 229.5 | 178.4 | 16.6 | 8.0 | a | ||
| CS | 26.00.2 | 182.9 | 234.0 | 133.6 | 9.9 | 100.0 | c | ||
| CS | 24.20.4 | 178.4 | 236.9 | 127.7 | 13.5 | 119.0 | c | ||
| CS | 18.60.7 | 135.6 | 180.2 | 129.5 | 11.3 | 16.0 | a | ||
| CS † | 12.10.3 | 154.5 | 211.3 | 73.4 | 8.2 | 90 | b | ||
| HC3N | 5.80.6 | 63.0 ⋆ | 184.0 ⋆ | 86.0 | - | - | d | ||
| HC3N | 5.30.3 | 63.0 ⋆ | 184.0 ⋆ | 80.0 | - | - | d | ||
| HC3N | 4.40.7 | 63.0 ⋆ | 184.0 ⋆ | 66.0 | - | - | d | ||
| HC3N | 3.60.6 | 63.0 ⋆ | 184.0 ⋆ | 54.0 | - | - | d | ||
| HC3N | 3.40.5 | 63.0 ⋆ | 184.0 ⋆ | 50.0 | - | - | d | ||
| HC3N | 3.20.7 | 63.0 ⋆ | 184.0 ⋆ | 47.0 | - | - | d | ||
| CH3CCH | 3.40.1 | - | - | - | - | - | c | ||
| CH3CCH | 4.30.2 | - | - | - | - | - | c | ||
| CH3CCH | 5.10.5 | - | - | - | - | - | c | ||
| CH3CCH † | 2.90.3 | 155.0 | 250.0 | 17.3 | 3.8 | 90.0 | a | ||
| M82 | |||||||||
| CS | 9.40.2 | 102.6 | 300.1 | 86.3 | 4.6 | - | b | ||
| CS | 11.50.2 | 105.6 | 293.8 | 103.7 | 2.6 | 481 | a | ||
| CS | 6.50.8 | 87.7 | 309.2 | 70.1 | 16.6 | - | b | ||
| CS | 4.20.2 | 71.6 | 316.4 | 55.5 | 7.3 | 248 | a | ||
| CS † | 0.90.1 | 53.0 | 317.8 | 16.7 | - | - | b | ||
| HC3N | 1.20.2 | 97.3 | 308.8 | 11.5 | 2.5 | 59 | a | ||
| HC3N | 1.00.1 | 100.0 ⋆ | 300.0 ⋆ | 9.6 | 1.4 | 292 | a | ||
| HC3N | 1.30.1 | 96.9 | 314.3 | 13.0 | 2.4 | 158 | a | ||
| HC3N | 0.80.1 | 87.5 | 308.5 | 8.6 | 2.0 | 217 | a | ||
| HC3N | 0.40.3 | 42.6 | 333.8 | 9.9 | 4.6 | 294 | a | ||
| HC3N | 0.2 | 100.0 ⋆ | - | - | 1.1 | 1400 | a | ||
| CH3CCH | 3.70.1 | 123.8 | 315.0 | 28.1 | 1.0 | 168 | h | ||
| CH3CCH | 7.40.6 | 122.9 | 310.0 ⋆ | 56.8 | 2.5 | 59 | a | ||
| CH3CCH | 7.10.1 | 109.6 | 322.6 | 63.9 | 1.7 | 158 | a | ||
| CH3CCH | 8.70.2 | 97.5 | 325.0 | 84.1 | 3.0 | 281 | a | ||
| CH3CCH | 7.40.7 | 85.1 | 339.1 | 81.2 | 8.0 | 56 | a | ||
| CH3CCH | 2.40.1 | 70.1 | 337.5 | 32.1 | 3.1 | 799 | a | ||
| IC342 | |||||||||
| CS | 5.00.1 | 53.9 | 31.7 | 87.4 | 2.5 | 28 | a | ||
| CS | 4.90.1 | 51.7 | 31.2 | 88.5 | 3.0 | 28 | a | ||
| CS | 3.40.1 | 63.4 | 38.2 | 37.6 | 2.9 | 57 | a | ||
| CS † | 1.00.4 | 75.6 | 29.3 | 12.3 | 8.5 | 50 | b | ||
| HC3N | 0.70.1 | 54.4 | 34.4 | 12.2 | 1.2 | 126 | a | ||
| HC3N | 0.70.1 | 40.9 | 35.5 | 15.3 | 2.8 | 84 | a | ||
| HC3N | 0.70.1 | 58.7 | 34.0 | 12.0 | 1.0 | 218 | a | ||
| HC3N | 0.70.1 | 52.7 | 39.3 | 12.4 | 1.3 | 77 | a | ||
| HC3N | 0.50.1 | 50.9 | 39.2 | 9.8 | 2.0 | 56 | a | ||
| HC3N | 0.40.1 | 50.0 ⋆ | 31.0 ⋆ | 6.7 | 1.8 | 190 | a | ||
| HC3N | 0.70.1 | 101.3 | 44.1 | 6.6 | 1.5 | 416 | a | ||
| HC3N | 0.70.2 | 76.7 | 12.7 | 8.4 | 2.8 | 211 | a | ||
| CH3CCH | 0.20.1 | 36.8 | 33.0 | 3.9 | 5.8 | 278 | a | ||
| CH3CCH | 0.30.1 | 60.0 ⋆ | 38.6 | 4.5 | 6.7 | 276 | a | ||
| CH3CCH | 0.70.1 | 50.0 ⋆ | 25.5 | 13.7 | 1.5 | 56 | a | ||
| Maffei2 | |||||||||
| CS @ | 0.90.1 | 132.9 | -19.0 | - | - | - | f | ||
| CS | 6.10.5 | 175.9 | -36.0 | 33 | - | - | g | ||
| CS | 3.00.3 | 139.2 | -50.0 ⋆ | 20.3 | 3.1 | 99 | a | ||
| (0,0) | HC3N | 1.00.1 | 130.0 ⋆ | -33.3 | 7.6 | 78.1 | 112 | a | |
| HC3N | 1.80.4 | 112.2 | -44.6 | 15.3 | 3.9 | 21 | a | ||
| HC3N | 0.40.1 | 130.0 ⋆ | -50.0 ⋆ | 3.1 | 1.0 | 112 | a | ||
| HC3N | 0.3 | 130.0⋆ | - | - | 2.2 | 183 | a | ||
| HC3N | 0.2 | 130.0⋆ | - | - | 8.5 | 140 | a | ||
| CH3CCH | 0.30.1 | 142.5 | -50.0 ⋆ | 2.1 | 1.0 | 224 | a | ||
| CH3CCH | 0.80.1 | 146.3 | -50.0 ⋆ | 4.8 | 1.0 | 224 | a | ||
| CH3CCH | 0.70.1 | 130.0 ⋆ | -60.4 | 5.3 | 1.1 | 112 | a | ||
| CH3CCH | 0.3 | 130.0 ⋆ | - | - | 3.0 | 224 | a | ||
| CH3CCH | 0.2 | 130.0 ⋆ | - | - | 2.0 | 253 | a |