Chapter 1 Multi-boson production
Paolo Mastrandrea ∗,†
Fermilab,
Batavia, IL 60510-5011, USA
On behalf of CDF and DØ collaborations
Abstract
The studies of the diboson production in collisions at 1.96 TeV performed by CDF and DØ collaborations at the Tevatron collider are reported in this paper. The diboson events are identified by means of both leptonic and semi-leptonic final states. The presented results use different statistical samples collected by the Tevatron up to 4.8 fb-1. Measured production cross sections are in good agreement with Standard Model predictions and the limits on the anomalous triple gauge boson couplings are competitive with those measured by experiments at the Large Electron-Positron collider (LEP).
1. Introduction
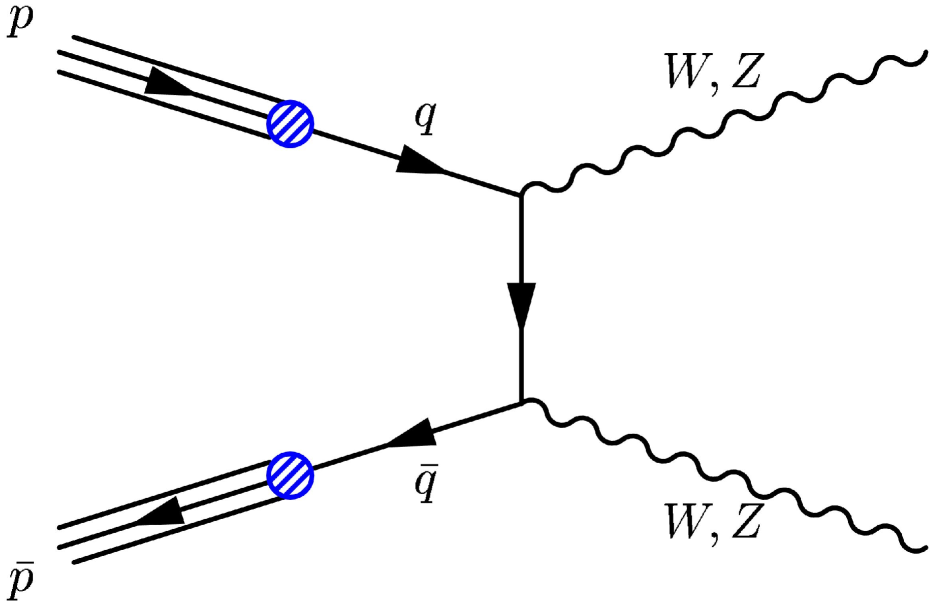
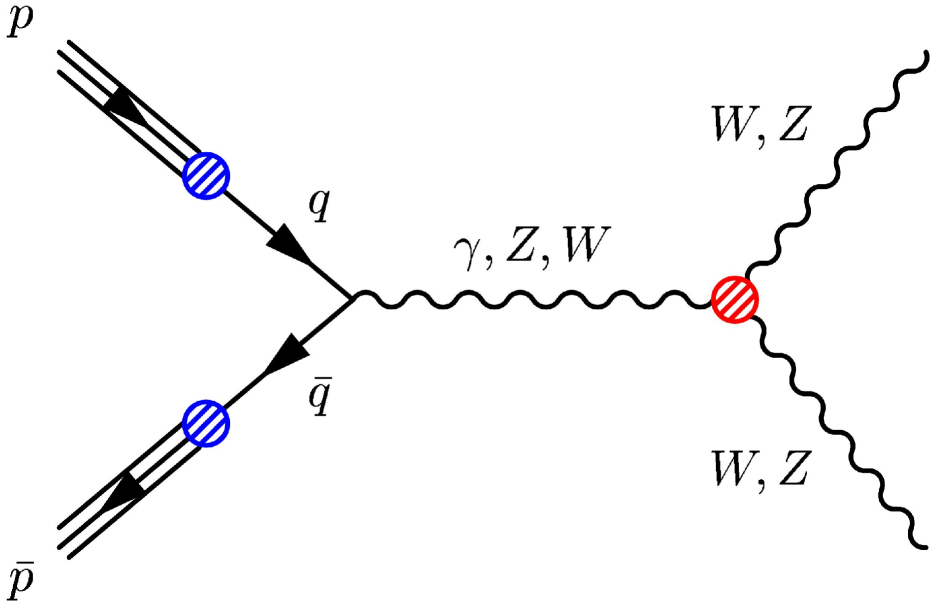
Measurements of the associated production of two vector bosons (, , ) are important tests of the electroweak sector of the Standard Model (SM). The production of a diboson final state (Fig. 1.) can occur by particle-antiparticle annihilation (-channel) or by boson self-interaction (-channel). This kind of final state represents a unique probe for the triple gauge boson coupling (TGC). Vector boson self-couplings are fundamental predictions of the SM resulting from the non-Abelian nature of the gauge symmetry theory, which was firstly demonstrated by precision measurement of and pair production at LEP II [1]. Observing TGCs not permitted in the SM or with different intensity with respect to the SM predictions, would be a sign of new physics. A summary of the different TGC’s is reported in Table 1.
| Coupling | Final state | ||
|---|---|---|---|
| Not present at LEP | |||
| LEP and Tevatron | |||
| and | Absent in SM | ||
| and | |||
The vertices are completely described by 14 independent couplings, 7 each for and processes. Assuming and conservation and electromagnetic gauge invariance, the number of independent parameters can be reduced to 5. A common adopted set is , where and , in the SM at tree level. Using constraints due to gauge invariance, and can be expressed as a function of the other parameters and the weak mixing angle as: and .
A common formulation to report the independent parameters describing the TGC in vertices is , where and .
Deviations from the SM prediction for the and couplings may be described in terms of 4 parameters each, , respectively for and . All these anomalous contributions to the cross section increase rapidly with the center-of-mass energy. In order to ensure unitarity, these parameters are usually described by a form-factor representation, , where is the energy scale for the manifestation of a new phenomenon and is a sufficiently large power. Usual values adopted for in the presented results are TeV and TeV.
Deviations from the SM prediction for the and couplings may be described in terms of 2 parameters each, , respectively for and .
All the couplings and are zero at tree level in the SM.
|
2. Methods
All the presented analysis have been performed utilizing the data collected by the CDF and DØ detectors installed at the Fermilab’s Tevatron, an accelerator capable to collide proton with antiproton at a center-of-mass energy TeV and an instantaneous luminosity cm-2 s-1. Both CDF and DØ are general purpose detectors, cylindrically symmetric around the beam axis which is oriented as the direction. The polar angle is measured from the origin of the coordinate system at the center of the detector with respect to the axis. The pseudorapidity, transverse energy and transverse momentum are defined as , and , respectively. Detailed descriptions of the features of the two detectors can be found in [2] and [3].
Several combinations of the and bosons decay channels are utilized to reconstruct the diboson events. High- electrons and muons are widely used in the reconstruction of the vector bosons candidates because of the clear signatures provided in an hadronic environment. Neutrinos are identified evaluating the missing transverse energy () in the event. The missing is defined by , , where is a unit vector perpendicular to the beam axis and pointing at the calorimeter tower. The index runs over all the calorimeter towers with an energy deposit over a minimum threshold.
An anomalous TGC can affect both the production cross section and kinematics observables of the diboson final states. The or distributions of fully reconstructed candidate bosons or of the charged leptons from boson decays are utilized to extract limits on the TGC parameters. These distributions are compared with MC predictions for different set of coupling constants in order to evaluate C.L. limits.
3. Results
The CDF and DØ collaborations are producing many competitive measurements in the diboson sector. In the following the most updated results are presented. Only peculiar features will be discussed.
3.1. Z
The measurement of the cross section for the production of events, with the boson decaying in two neutrinos and the photon with GeV and , has been performed by the DØ collaboration using a sample of data corresponding to an integrated luminosity of fb-1 [4]. The analysed events have been collected with a trigger from a set of high- single EM-cluster triggers, which are ( efficient for photons of GeV. The events selection requires also the presence of a single photon candidate and GeV. The background to the signal is mainly due to misidentified or events and to events in which muons from the beam halo or cosmic rays undergo bremsstrahlung and produce energetic photons. This non-collision background is reduced using a pointing algorithm which utilizes the transverse and longitudinal energy distributions in the electromagnetic (EM) calorimeter and central preshower detector, to estimate the position of production vertex () along the beam direction ( axis). The algorithm assumes that given EM showers are initiated by photons and utilizes the distance of closest approach of the direction of the EM shower to the axis. Selected events are required to have cm, where is the position of the reconstructed primary vertex of the event.
After applying all selection criteria 51 candidate events are observed, with a predicted background of events. The measured cross section for the production of events with and the photon with GeV is:
This result is in good agreement with the next-to-leading order (NLO) prediction of fb. The statistical significance of this measurement has been estimated performing background-only pseudo-experiments: the p-value is evaluated as the fraction of pseudo-experiments with an estimated cross section above the measured one. This probability is found to be , which corresponds to a statistical significance of 5.1 standard deviations, making this the first observation of the process at the Tevatron.
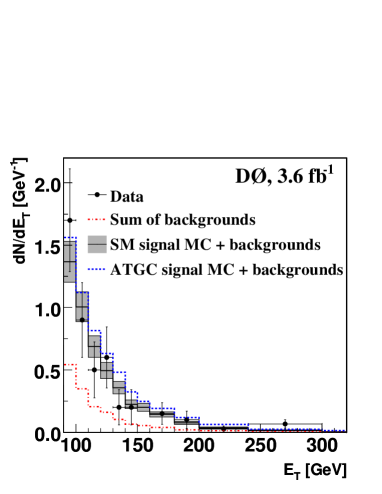
The limits on the anomalous triple gauge couplings (aTGC)
are evaluated comparing the photon spectrum
in data with that from the sum of the background and the predicted signal
for each pair of couplings for a grid in which runs from -0.12 to 0.12
with a step of 0.01 and runs from -0.08 to 0.08 with step of 0.001.
The MC samples are generated with a leading order (LO)
generator (corrected for the
NLO with an -dependent -factor) for the form-factor TeV.
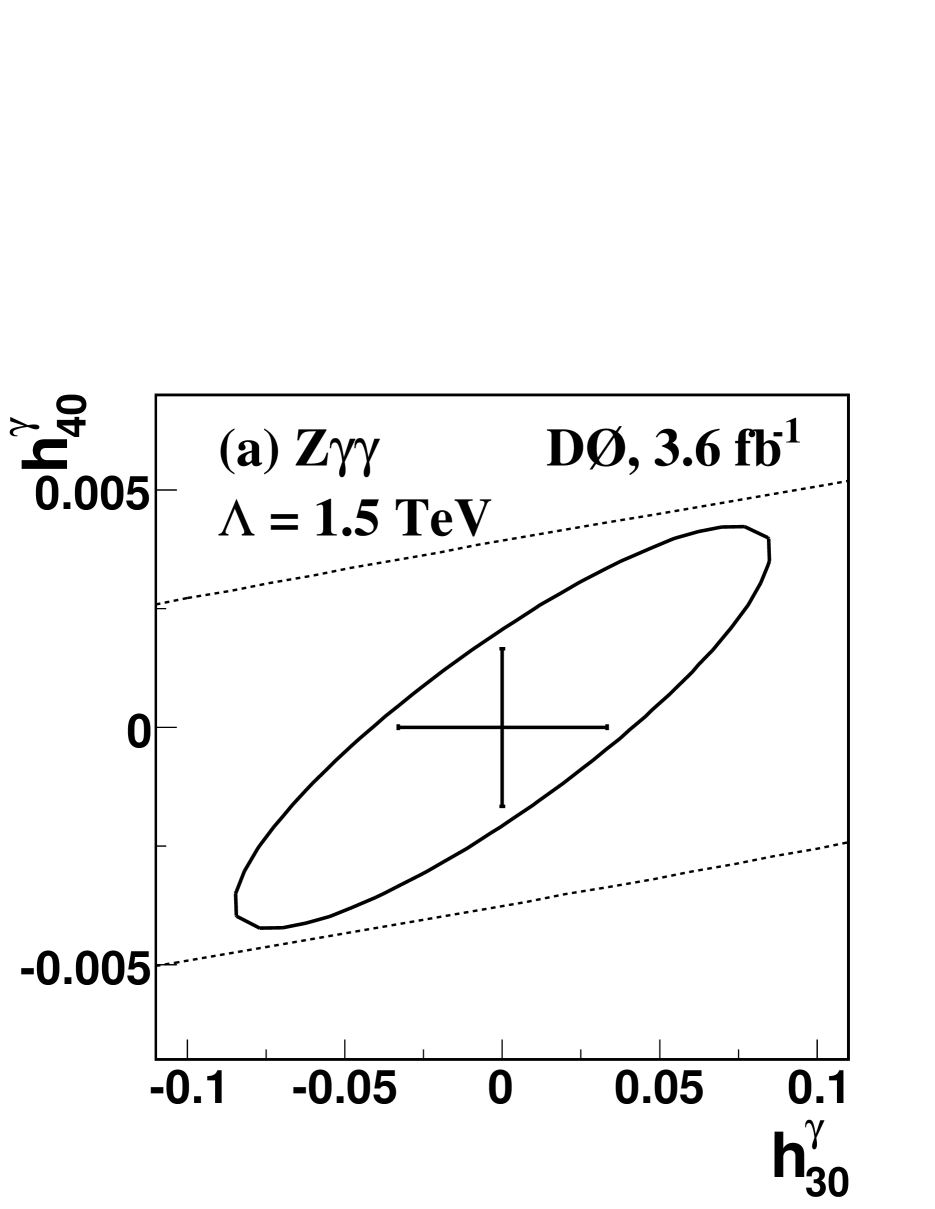
The resulting one-dimension limits in the neutrino channel alone are
,
,
,
.
To further improve the sensitivity these measurements are combined with the
limit evaluated for the () channels
on a fb-1 data sample, previously analysed [5]
by the DØ collaboration.
The combination of all three channels yields the most stringent limits
on the aTGC set at a hadron collider to date, reported in Table 2.
The limits on the , and couplings
improve on the constraints from LEP II, and are the most restrictive to date.

|
| Parameter | |
|---|---|
3.2. W
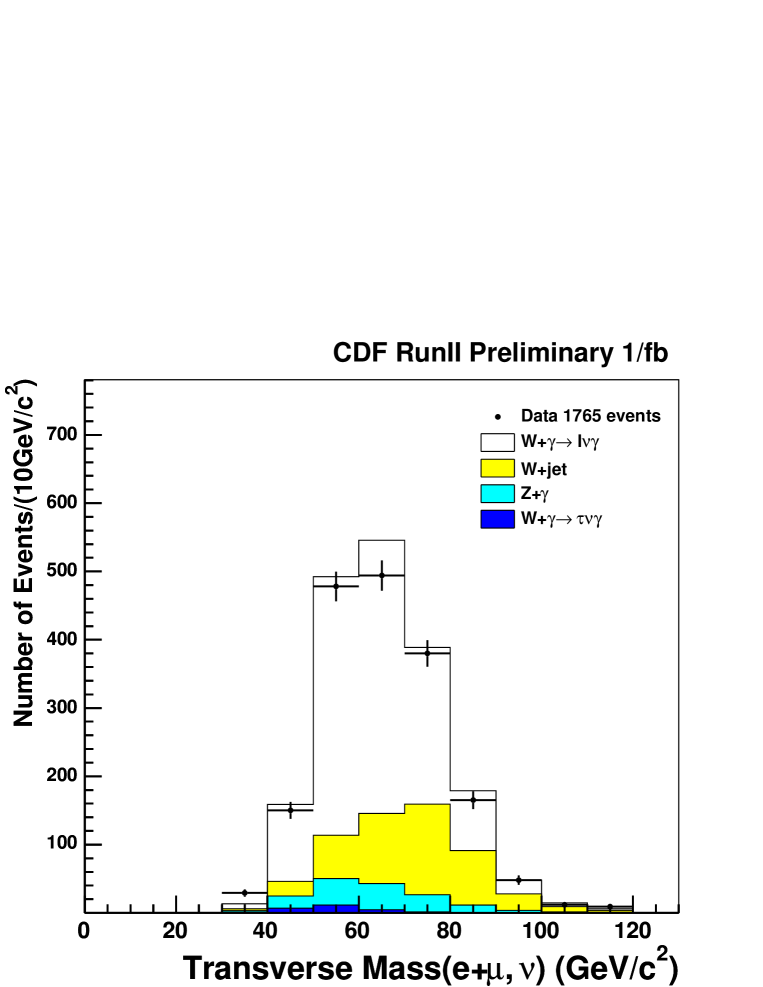
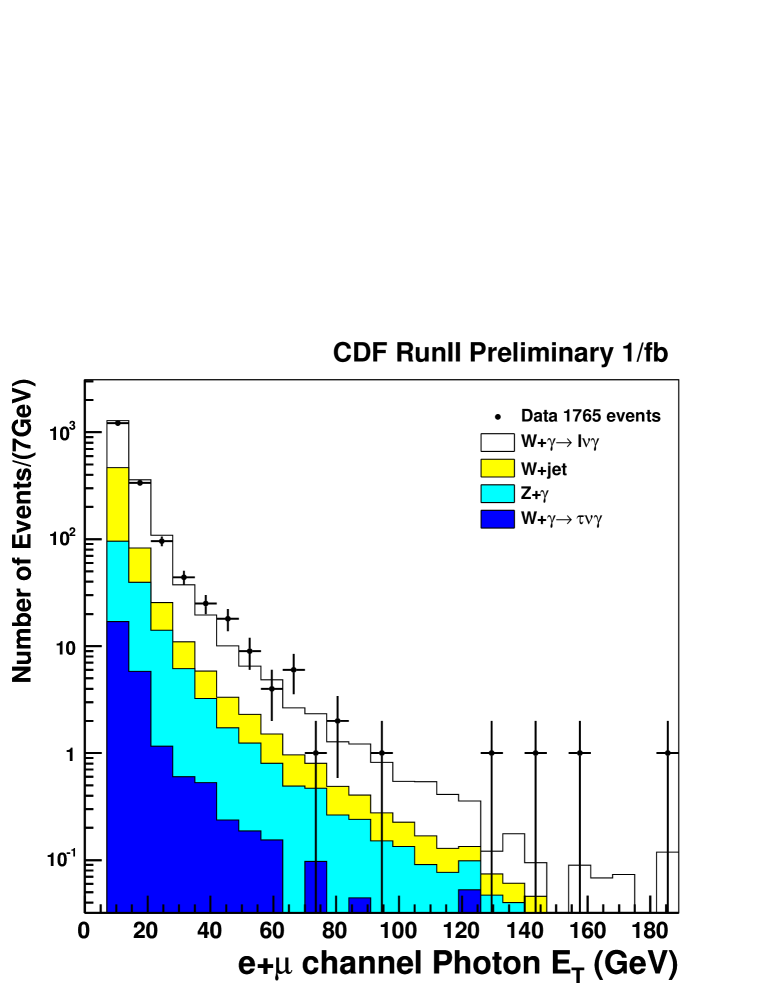
The measurement of the cross section for the associated production of and bosons has been performed by the CDF collaboration on a data sample corresponding to fb-1 [6].
The boson is reconstructed utilizing its decay in electron and neutrino or muon and neutrino. The events are selected requiring a candidate electron with GeV and , and GeV, while the events are selected requiring a candidate muon with GeV/c and , and GeV. Furthermore the transverse mass () of the candidate boson is required in the range GeV/c2. The candidate photons must have GeV and . The distribution of the transverse mass of the candidate boson and of the transverse energy of the candidate photon are compared in Fig. 4. with the simulation expectation.
The measured cross section for the production of events, with the boson decaying in or and the photon with GeV is:
This result is in good agreement with the SM prediction of pb.
| Parameter | |
|---|---|
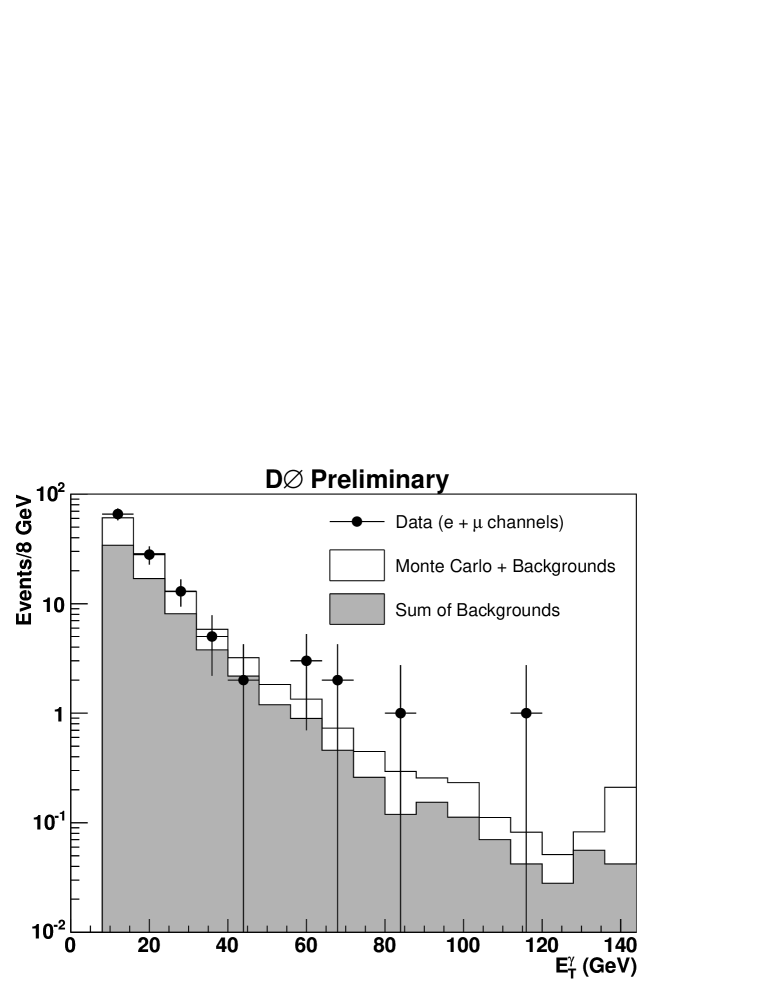
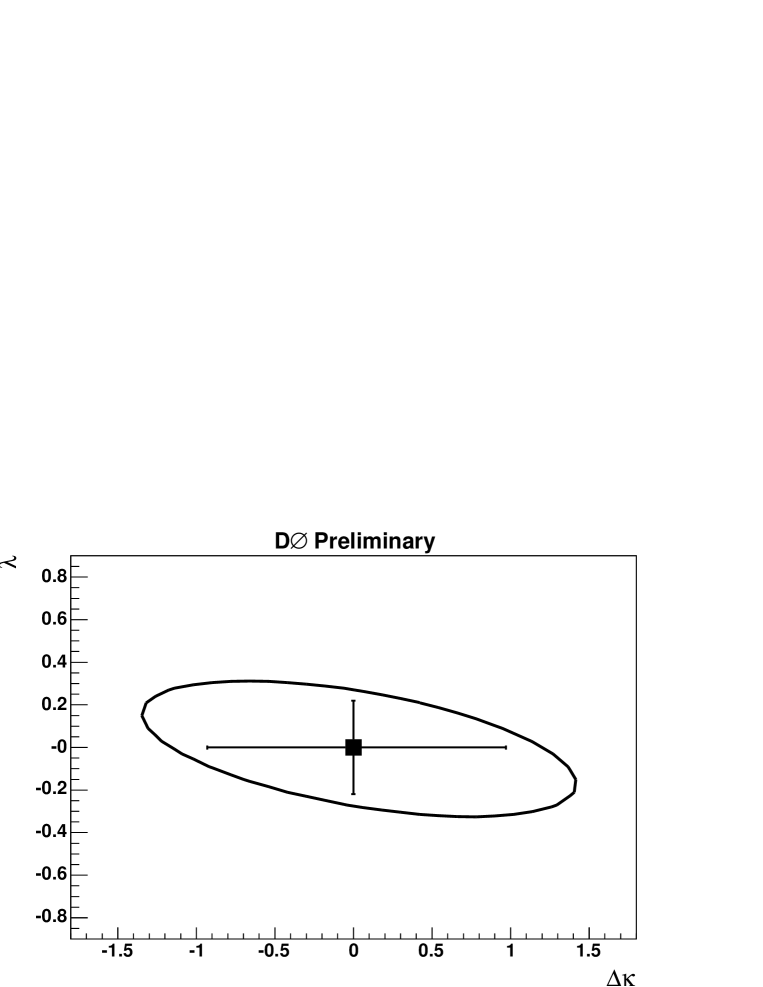
An analysis using analogous techniques and performed by the DØ collaboration on a data sample corresponding to pb-1 [7] evaluated C.L. limits on aTGC. The limits are extracted from the comparison of the distribution of the candidate photon with the theoretical predictions as a function of the coupling parameters. The measured limits at C.L. are reported in Table 3., and the comparison with the two-dimensional limit is reported in Fig. 5.
3.3. WW
The measurement of the production cross section of events in collisions has been performed by the CDF collaboration on a data sample corresponding to fb-1 [8].
The events are reconstructed using the decay chain , where , with final states , and , and acquired with high- electron or muon triggers. Several processes contribute to the background: Drell-Yan where the measured large is due to resolution tails, where one lepton is lost, , and and jets where a photon or jet is misidentified as a lepton. The majority of events have zero jets, and as the jet multiplicity increases the backgrounds change (e.g. becomes a larger contribution with increasing jet multiplicity). Events with reconstructed jets with GeV and are rejected. To suppress the Drell-Yan background, dielectron and dimuon events are required to have GeV and GeV for electron-muon events, where is defined as:
This definition is a requirement that transverse to each lepton or jet in the event is greater than the minimum threshold if points along that object, so that losing energy from just one such object in an event would not allow it to enter the sample. Furthermore, in order to suppress the heavy flavor contribution, the invariant mass of the two selected leptons is required to be GeV/c2.
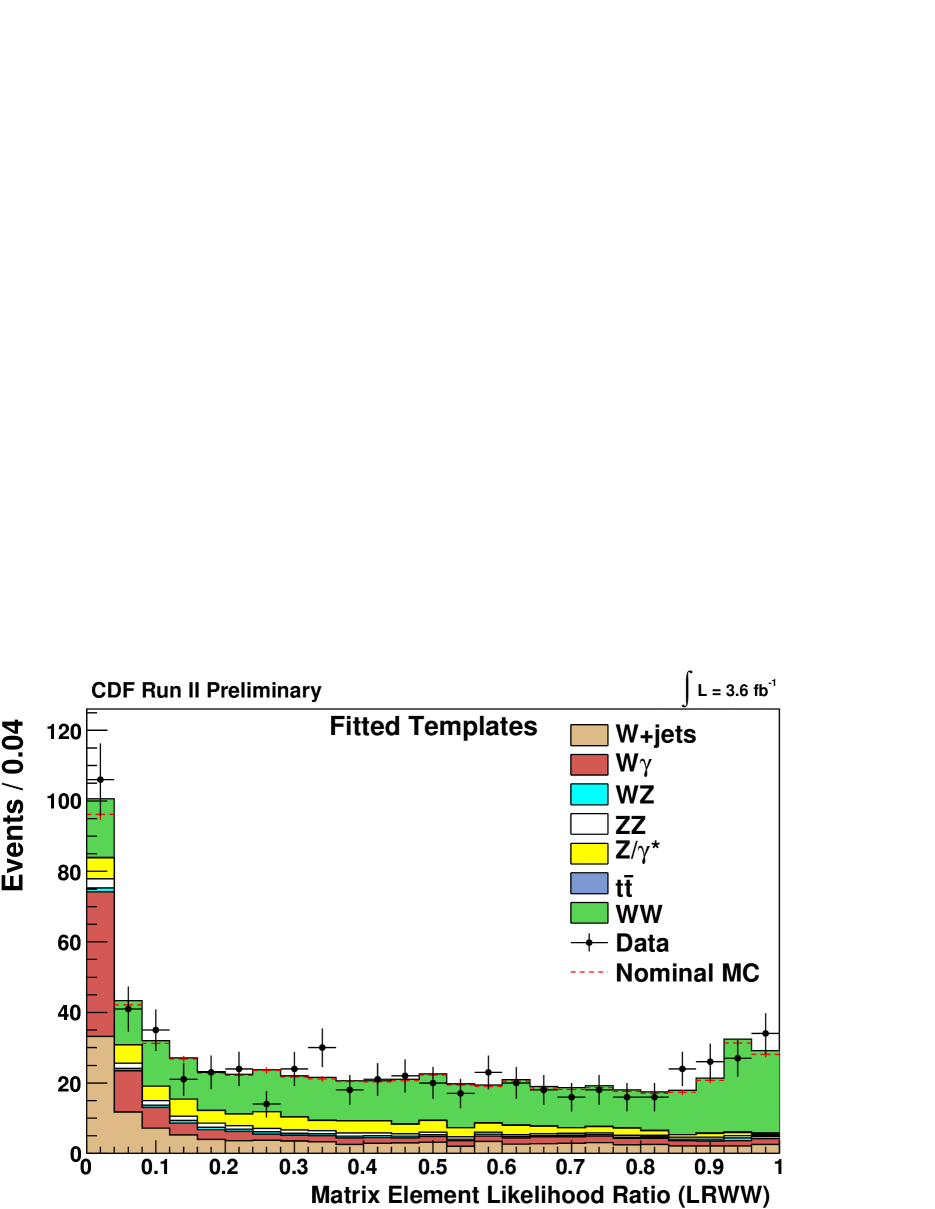
To measure the production cross section, a matrix element probability for each event to be a event has been calculated. This probability is used to build a likelihood ratio discriminant, and the normalization of process is extracted by a fit, using MC templates.
The event-by-event matrix element probability density is defined for the four processes () , , and jets, as:
| (1) |
where
| are the observed “leptons” and , | |
| are the true lepton four-vectors (include neutrinos), | |
| is leading-order theoretical calculation of the cross-section for the process , | |
| is total event efficiency acceptance, | |
| is an analytic model of resolution effects, | |
| is the normalization. |
Since the neutrinos are not reconstructed, the unobserved degrees of freedom (DOF) are integrated out in equation (1), reducing the number of the DOF to eight, measured in the selected events.
The event probability densities are used to construct a likelihood ratio discriminant:
where is the expected fraction for each background, with .
A binned maximum likelihood method is used to extract the cross section using the shape of the distributions for signal and backgrounds along with their estimated normalizations and systematic uncertainties. The likelihood function is formed from a product of Poisson probabilities for each bin in distribution (Fig. 6.). Additionally Gaussian constraints are applied for each systematic indetermination ***Details about the systematic uncertainties can be found in [8]. The likelihood function is defined as:
| (2) |
where is the number of data events in the -th bin and is the total expectation for the -th bin, given by:
| (3) |
This formulation includes the proper correlation of the different systematic uncertainties. In equation (3) and are the expected number of events in the -th bin and the fractional uncertainty associated with the systematic for the process . The parameter is the ratio between the measured cross section and the predicted one: it is freely floating for the process and is fixed to 1 for all other processes.
The measured cross section for the production of events is:
This is in good agreement with the theoretical prediction pb and is the best measurement to date of the production cross section of the process.
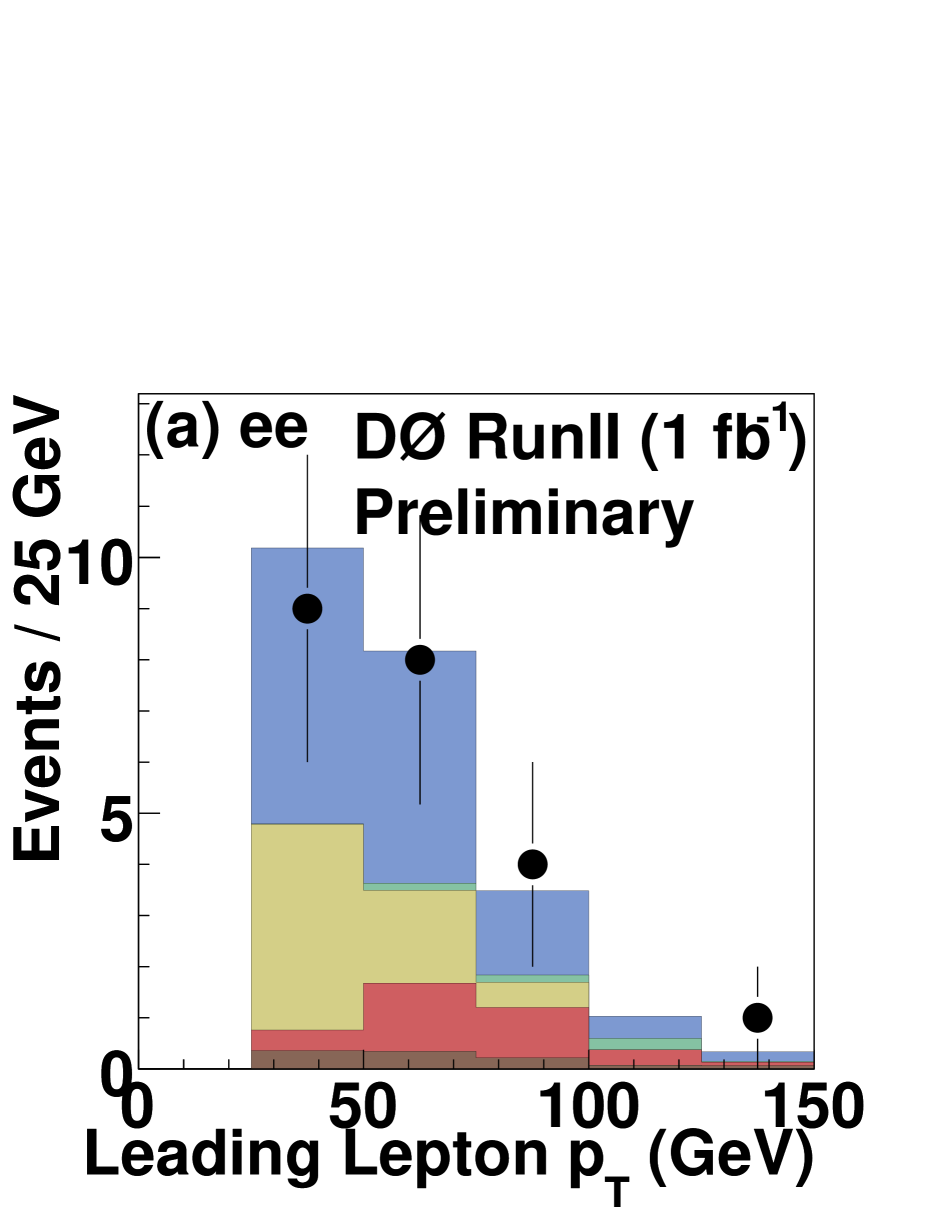
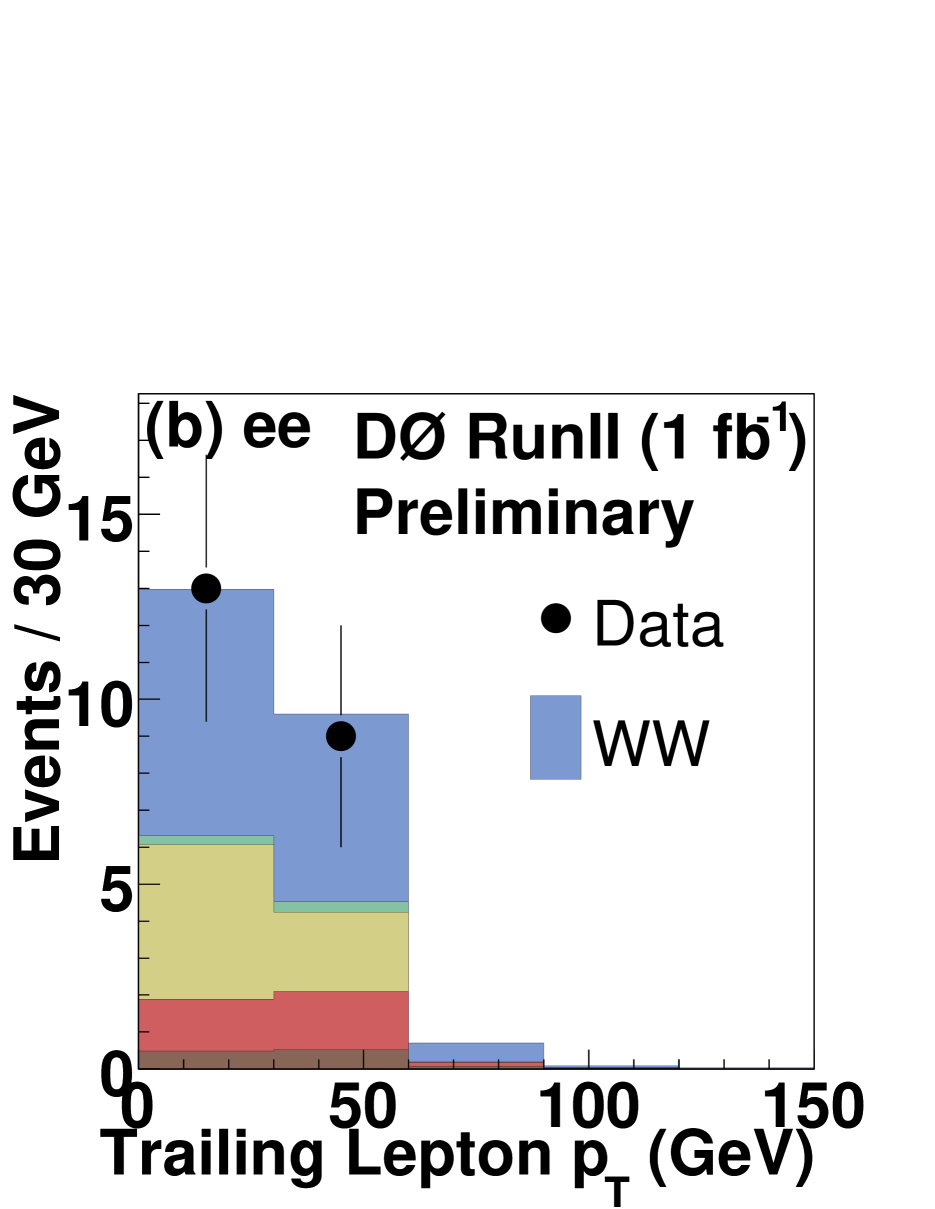
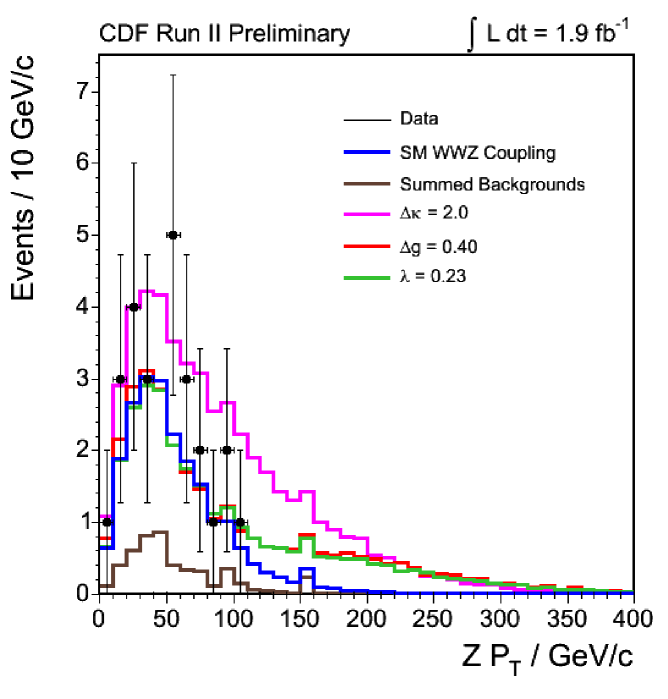
The distribution of the leading lepton for each selected event is used to extract C.L. limits on the and aTGC parameters. The measured limits are reported in Table 4.
The DØ collaboration analysed the production [9] in a data sample corresponding to fb-1, utilizing the final states described above, with competitive results for both the production cross section measurement and the aTGC limits evaluation. The measured cross section:
is consistent with the SM expectation of pb. To enhance the sensitivity to anomalous couplings selected events are sorted according to both leading and trailing lepton into a two-dimensional histogram. For each bin the selected number of events produced is parametrized by a quadratic function in three-dimensional () space or two-dimensional () space, as appropriate for the TGC relationship scenario under study. In the three-dimensional case, coupling parameters are investigated in pairs, with the third parameter fixed to the SM value. A likelihood surface is generated by considering all channels simultaneously, integrating over the signal,background, and luminosity uncertainties with Gaussian distributions using the methodology described in [9]. The measured one-dimension C.L. limits for TeV are reported in Table 4.
|
| Parameter | CDF | DØ |
|---|---|---|
3.4. WZ
| Source | Expected | Stat | Syst | Lumi |
| +jets | 2.45 | 0.48 | 0.48 | 0.00 |
| 1.53 | 0.01 | 0.16 | 0.09 | |
| 1.03 | 0.06 | 0.35 | 0.06 | |
| 0.17 | 0.01 | 0.03 | 0.01 | |
| 16.45 | 0.03 | 1.74 | 0.99 | |
| Total | 21.63 | 0.48 | 2.25 | 1.15 |
| Observed | 25 | |||
The measurement of the production cross section of events in collisions has been performed by the CDF collaboration on a data sample corresponding to fb-1 [10].
The events are reconstructed in final states with three charged leptons , where , and acquired with high- electron or muon triggers.
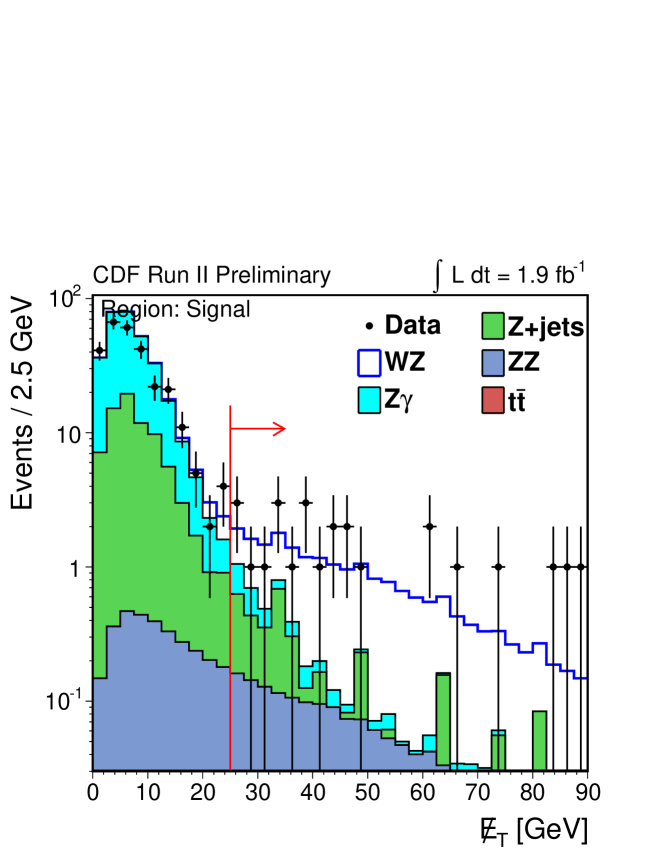
The candidates are selected from events with three identified leptons. In order to enhance the signal acceptance, looser selection criteria are adopted for non-leading leptons. Aside from production, other SM processes that can lead to three high- leptons include dileptons from Drell-Yan process with an additional lepton from a photon conversion () or misidentified jet (jets), where only three leptons are identified, and a small contribution from production. Aside from , these backgrounds are strongly suppressed by requiring GeV in the event, consistent with the unobserved neutrino from leptonic decay of a boson. Furthermore the azimuthal angle between the direction and any identified jet with GeV or candidate lepton, is required to be greater than to suppress Drell-Yan backgrounds in which the observed is due to mis-measured leptons or jets. At least one same-flavor, opposite-charge lepton pair is required in the event with an invariant mass in the range GeV/c2 consistent with leptonic boson decay. If more than such pair is identified in the event, the one with closest to the nominal mass, is selected as boson decay candidate pair. In order to suppress the background from production, the event is rejected if the invariant mass of the lepton not selected in the candidate combined with any additional track with GeV/c is in the range GeV/c2.
The distribution for the candidates is shown in Fig. 8., while in Table 5. is reported the comparison between the number of observed and expected events. The measured cross section for the production of events is:
in agreement with the NLO prediction pb.
The distribution of the candidate for each selected event (Fig. 8.) is used to extract C.L. limits on the aTGC parameters. The measured limits are reported in Table 6.
| Parameter | TeV | TeV |
|---|---|---|
3.5. ZZ
The measurement of the production cross section of events in collisions has been performed by the CDF collaboration on a data sample corresponding to fb-1 [11].
| Signal | 4.68 | 0.02 (stat.) | 0.76 (syst.) |
| jets | 0.041 | 0.016 (stat.) | 0.029 (syst.) |
| Total expected | 4.72 | 0.03 (stat.) | 0.76 (syst.) |
| Observed | 5 | ||
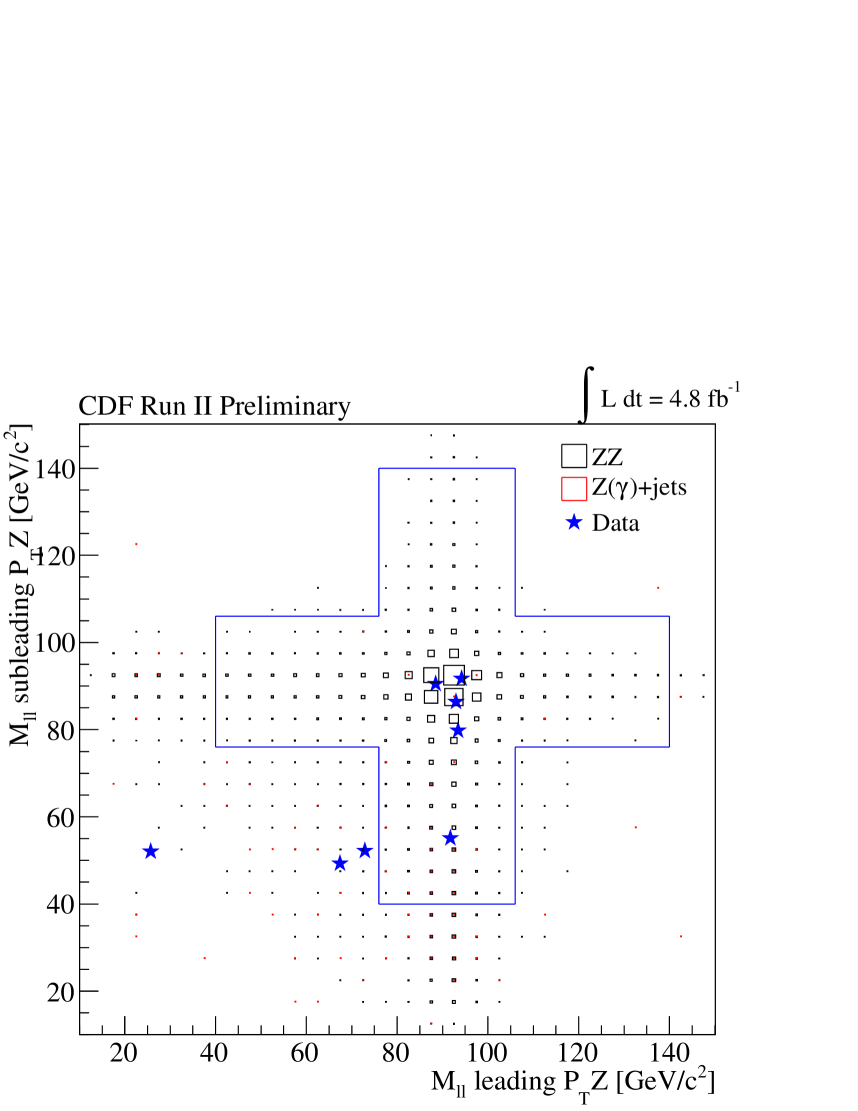
The events are reconstructed in final states with four charged leptons , where , and acquired with high- electron or muon triggers. The main source of background is given by events jets or jets, in which the jets are reconstructed as leptons. In order to enhance the signal acceptance, looser selection criteria are adopted for non-leading leptons. The distribution of the observed events in the signal region is shown in Fig. 9., while in Table 7. is reported the comparison between the number of observed and expected events. The production cross section for events is evaluated according to:
where is the total efficiency, is the branching fraction, the number of observed events, the expected number of background events and the total integrated luminosity. The measured cross section is:
in good agreement with the previous measurement done by CDF [12] and DØ [13] collaborations, and with the theoretical expectation pb.
The statistical significance of the measurement is standard deviation, and it is calculated evaluating the probability to have a number of events equal or greater than than observed as a fluctuation of the estimated background.
The analogous analysis performed by DØ collaboration on a data sample corresponding to fb-1 [13], observes 3 events with an expected background of events. The significance of this measurement is 5.3 standard deviations. The combination of this result with the measurement in the channel increases the significance to 5.7 standard deviations and measures a combined cross section
3.6. WV
The measurement of the production cross section of and events in collisions utilizing the decay channel has been performed by the CDF collaboration on a data sample corresponding to fb-1 [14].
In the sample of events acquired with high- electron or muon triggers, candidate events are reconstructed requiring a well identified lepton ( or ), GeV, consistent with the unobserved neutrino from leptonic decay of the boson, and two jets with GeV. Furthermore the hadronic boson candidate is required to have an invariant mass in the range () GeV/c2 and GeV/c. The main processes contributing to the background are jets, and multi-jet events. The fraction of diboson events is extracted by a binned fit to the invariant mass distribution of the hadronic boson candidate. The relative normalization of +jets and is set according to their production cross sections, while a Gaussian constraint is applied to the multi-jet component. The expected value and width of the multi-jet constraint are extracted by a fit to the distribution. The invariant mass distribution of the hadronic boson candidate in the selected events is shown in Fig. 10. The measured cross section for the production of events (with ) in collisions is:
The statistical significance of the measurement is standard deviations.
The CDF collaboration analysed a subset of the data sample described above, corresponding to an integrated luminosity of fb-1, with a matrix element based technique, in order to maximize the use of collected information for signal-background separation [15].
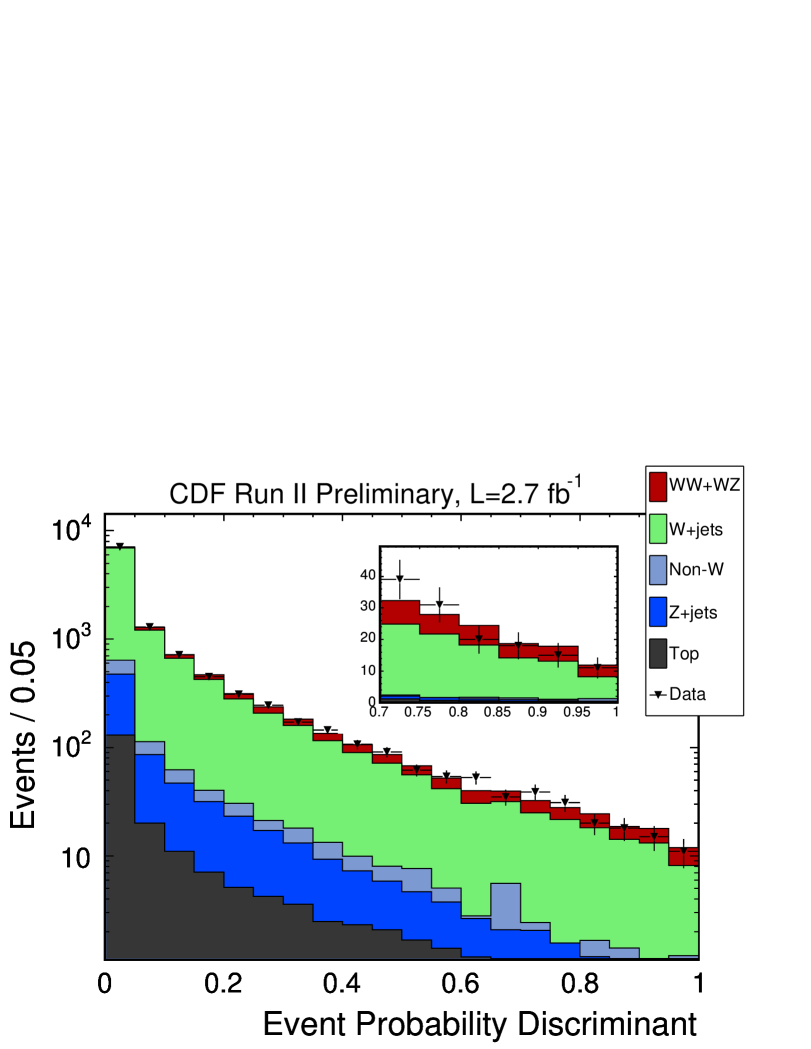
The procedure applied to calculate the event probability densities () under the signal and background hypotheses is analogous to that described for the analysis. The event probability densities are used to construct an Event Probability Discriminant (), defined as:
where the index runs over all the background sources. The resulting template distributions for signal and background processes are fit to the data using a binned likelihood approach (Fig. 11.). The measured cross section is:
The probability that the observed excess originated from a background fluctuation (p-value) is which corresponds to a statistical significance of 5.4 standard deviations.
3.7. VV
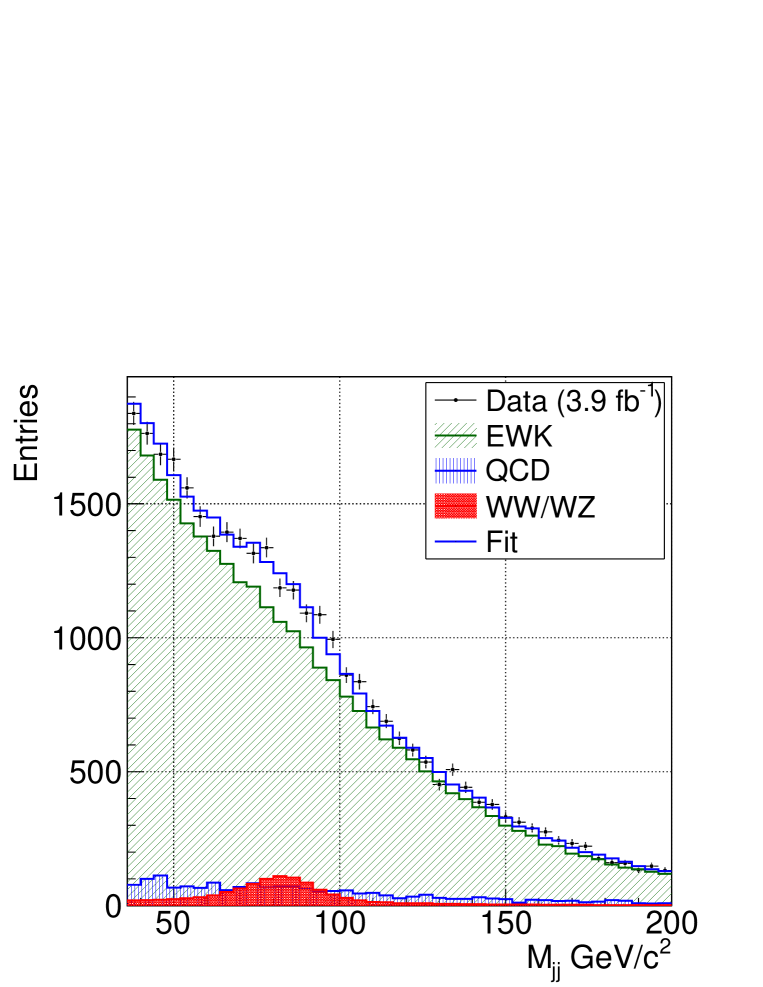
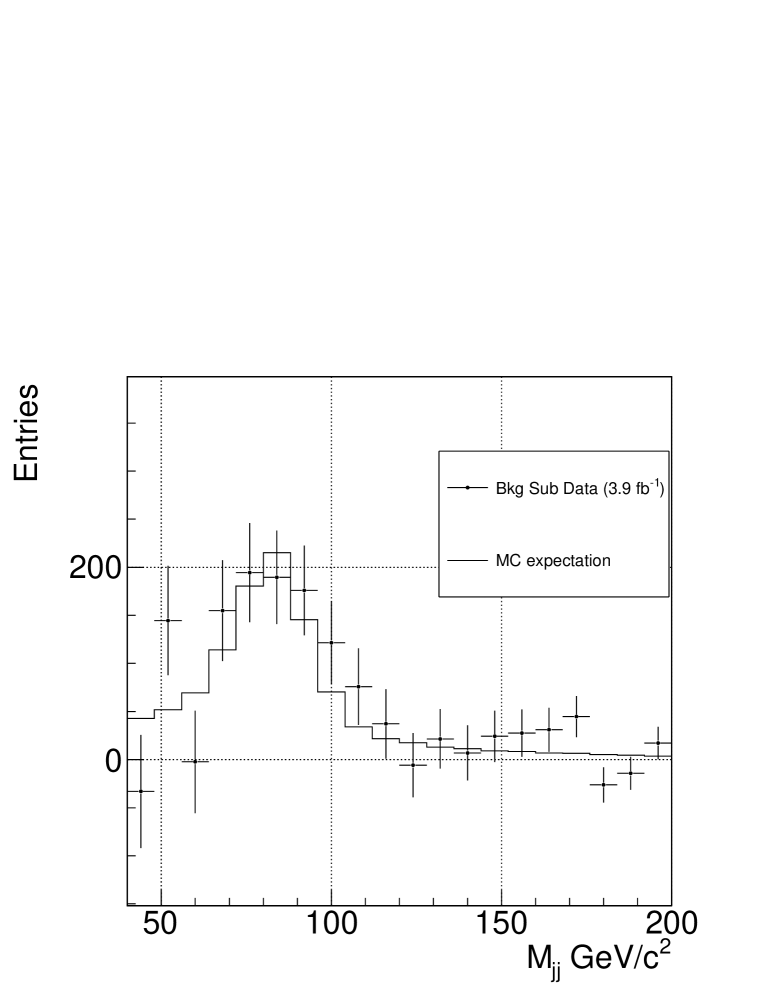
The measurement of the production cross section of diboson events in collisions utilizing hadronic final states, has been performed by the CDF collaboration on a data sample corresponding to fb-1 [16].
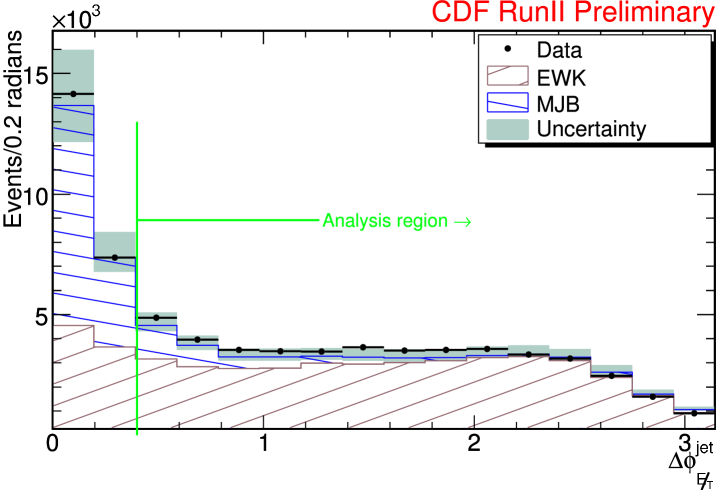
The events are reconstructed in final states with large and 2 identified jets, and are acquired with a set of based triggers. The analysed final state provide acceptance for events in which the boson decays in neutrinos and the other boson decays hadronically, and also for events in which the decays leptonically and the charged lepton is not reconstructed. The main processes contributing to the background are jets and multi-jet events. In order to reduce the multijet background events with or are rejected, where is the significance and is the angle in the transverse plane between the and the closest jet with GeV.
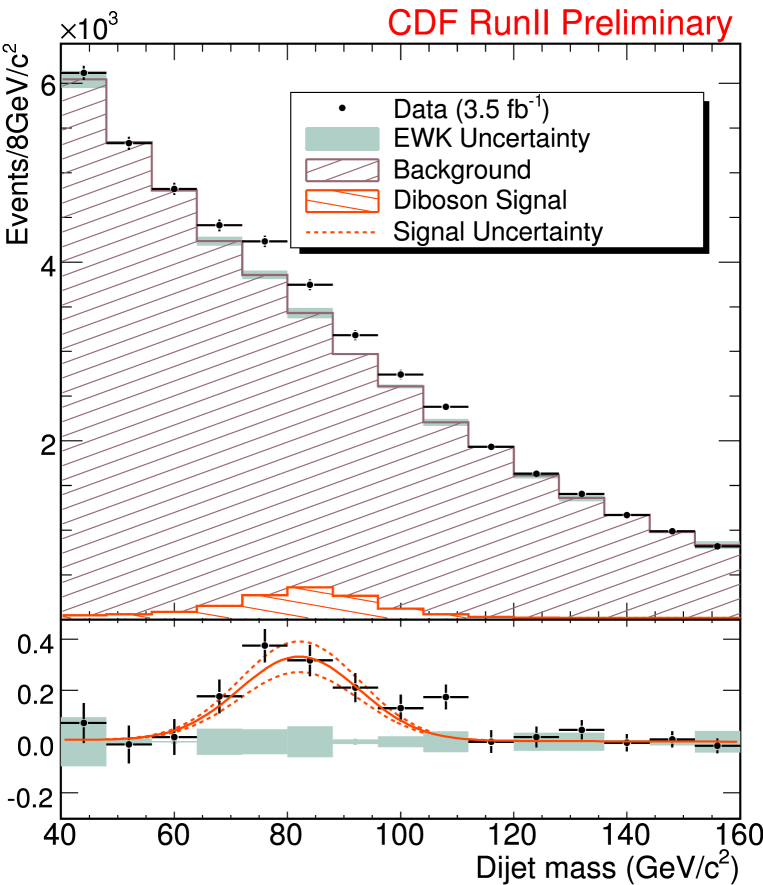
After all cuts are applied 44910 diboson candidate events are selected. The final dijet mass fit is an unbinned extended maximum likelihood with jet energy scale, and the slope and the normalization of the multijet background treated as nuisance parameters and allowed to float in the fit within their predetermined uncertainties. The normalization of the jets component is also freely floating in the fit with no constraints. The statistical significance of the measurement corresponds to standard deviations.
The measured cross section is:
in agreement with the SM calculations of pb.
In Fig. 13. the selected candidate events are compared with the signal and background distributions, according to the fit results.
4. Conclusions
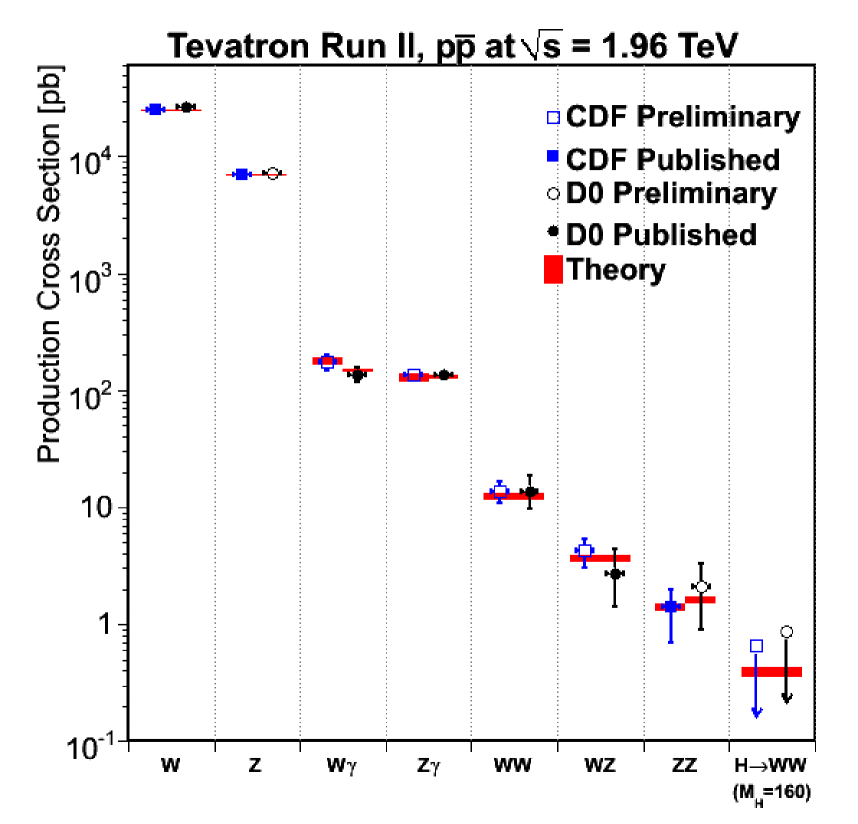
Recent results on the study of the diboson production at Tevatron have been presented. Both the measurements of the production cross sections and the limits on TGC parameters are competitive with the previous results from LEP and consistent with the SM expectations.
The production cross sections measured for diboson processes by CDF and DØ collaborations are summarized in Fig. 14.
All the presented results will be further improved utilizing the increasing available statistics of the collected data.
The Large Hadron Collider (LHC) will collect in the next years a data sample of proton-proton collisions at a center-of-mass energy of TeV. At this energy the production cross sections of diboson processes will grow by approximately an order of magnitude, with respect to the Tevatron energy [17]. Since the design instantaneous luminosity of the LHC is cm-2 s-1, the diboson production rates will exceed those of the Tevatron by a factor . Furthermore, because of the higher center-of-mass energy, the sensitivity of the LHC experiments to the anomalous TGC’s will be further enhanced.
Bibliography
- [1] C. Amsler et al. (Particle Data Group), Phys. Lett. B667, (2008) 1
- [2] CDF Collaboration, D.Acosta et al., Phys. Rev. D71 (2005) 032001.
- [3] DØ Collaboration, V. M. Abazov et al, Nucl. Instrum. Methods Phys. Res., Sect. A 565, (2006) 463.
- [4] DØ Collaboration, V.Abazov et al., Phys. Rev. Lett. 102 (2009) 201802.
- [5] DØ Collaboration, V.Abazov et al., Phys. Lett. B653 (2007) 378.
- [6] CDF collaboration, see http://www-cdf.fnal.gov/physics/ewk/2007/wgzg/
- [7] DØ collaboration, Limits on Anomalous Couplings from Events at , see http://www-d0.fnal.gov/Run2Physics/WWW/results/prelim/ EW/E09/E09.pdf
- [8] CDF collaboration, Measurement of the WW Production Cross Section in collisions at TeV using fb-1 of CDF Run II Data. (2009), see http://www-cdf.fnal.gov/physics/ewk/wwllll/ .
- [9] DØ Collaboration, V.Abazov et al., Phys. Rev. D74 (2006) 057101.
- [10] Phys. Rev. Lett. 98 (2007) 161801.
- [11] CDF collaboration, Observation of at CDF (2009), see http://www-cdf.fnal.gov/physics/ewk/2009/ZZllll/ZZWeb/.
- [12] CDF Collaboration, T.Aaltonen et al., First Measurement of ZZ Production in Collisions at TeV Phys. Rev. Lett. 100 (2008) 201801.
- [13] DØ Collaboration, V.Abazov et al., Observation of ZZ Production in Collisions at TeV Phys. Rev. Lett. 101 (2008) 171803.
- [14] CDF Collaboration, see http://www-cdf.fnal.gov/physics/ewk/2009/jjlnu/.
- [15] CDF Collaboration, see http://www-cdf.fnal.gov/physics/new/hdg/results/wwwz_061909/.
- [16] CDF Collaboration, T.Aaltonen et al., First Observation of Vector Boson Pairs in a Hadronic Final State at the Tevatron Collider arXiv:0905.4714v1 [hep-ex]
- [17] ATLAS Collaboration, G.Aad et al., Expected performance of the ATLAS experiment : detector, trigger and physics arXiv:0901.0512v4 [hep-ex]