X-Ray, FUV, and UV Observations of Centauri B:
Determination of Long-term Magnetic Activity Cycle and Rotation Period
Abstract
Over the last couple of decades we have been carrying out a study of stellar magnetic activity, dynamos, atmospheric physics, and spectral irradiances from a sample of solar-type G0-5 V stars with different ages. One of the major goals of this program is to study the evolution of the Sun’s X-ray through NUV spectral irradiances with age. Of particular interest is the determination of the young Sun’s elevated levels of high-energy fluxes because of the critical roles that X-ray (coronal) through FUV (transition region (TR), chromospheric) emissions play on the photochemical and photoionization evolution (and possible erosion) of early, young planetary atmospheres and ionospheres. Motivated by the current exoplanetary search missions (such as Kepler and CoRoT, along with the planned Space Interferometry mission and Darwin/Terrestrial Planet Finder missions) that are hunting for earth-size planets in the habitable zones (liquid water) of nearby main-sequence G-M stars, we are expanding our program to cooler, less luminous, but very importantly, much more numerous main-sequence K-type stars, such as Centauri B. The long life (2-3 longer than our Sun) and slow evolution of K stars provide nearly constant energy sources for possible hosted planets. This program parallels our “Sun in Time” program, but extends the study to stars with deeper convective zone depths. Presented here are X-ray (coronal; ROSAT, Chandra, XMM), UV (TR; IUE), NUV (chromospheric; IUE), and recently acquired FUV (TR/chromospheric; FUSE Cycles 7/8) observations of the K1 V star Cen B (HD 128621; V = 1.33; (B-V) = +0.88; = 5.6 0.6 Gyr). These combined high-energy measures provide a more complete look into the nature of Cen B’s magnetic activity and X-UV radiances. We find that Cen B has exhibited significant long-term variability in X-ray through NUV emission fluxes, indicating a solar-like long-term activity cycle of Pcycle = 8.840.4 years. In addition, analysis of the short-term rotational modulation of mean light due to the effects of magnetically active regions has yielded a well-determined rotation period of Protation = 36.21.4 days. Cen B is the only old main-sequence K star with a reliably determined age and rotation period, and for early K-stars, as in the case of the Sun for G2 V stars, is an important calibrator for stellar age/rotation/activity relations.
Subject headings:
stars: activity — stars: individual ( Centauri B) — stars: magnetic fields — ultraviolet: stars — X-rays: stars1. INTRODUCTION
1.1. The “Sun in Time” Program
Since 1990 we have been carrying out an in-depth study of the evolution
of the chromospheres, transition regions (TRs), and coronae of 1.0
M⊙ stars throughout their main-sequence lifetimes (see
Dorren & Guinan 1994a, b; Dorren et al. 1994; Güdel et al. 1997, 1998; and more recently,
Guinan et al. 2003; Ribas et al. 2005; Guinan et al. 2009). This program, called “The Sun in Time,”
is a comprehensive study across the electromagnetic spectrum using
a homogeneous sample of single, nearby G0-5 main-sequence stars with
known rotation periods and well-determined physical properties (viz. mass,
radius, temperature, etc.) These stars are used as proxies for the
Sun at different ages, and thereby help to quantify the effects of spin-down
due to magnetic braking. This investigation also bears on the crucial
question of the influence of the young Sun’s strong X-ray and FUV emissions
on developing planetary systems – particularly on the photochemical and
photoionization evolution of early planetary atmospheres. To this end, we
have constructed spectral irradiance tables for the Sun at different ages
(see Ribas et al. 2005). These data sets are of great interest to
researchers in paleo-planetary atmospheres as well as for studies of the
evolution of the atmospheres for the increasing number (400+ reported as of
2009 December) of planets now found orbiting other stars. For example, we
have recently collaborated with an astrobiology group to study the effect of
the young Sun’s strong X-ray and ultraviolet (XUV) irradiance on the loss of
water from Mars and its implications for the oxidation of the Martian soil
(Lammer et al., 2003a). In other studies (Lammer et al., 2003b; Grießmeier et al., 2004), our solar
proxy data have been used to investigate the atmospheric loss of exoplanets
resulting from XUV heating, which can eventually lead to the evaporation of
“hot Jupiters.” Kulikov et al. (2006) have used these data to investigate
the early evolution and erosion of Venus’ atmosphere.
1.2. Expanding to the dK Stars
More recently, we have expanded this “Sun in Time” project to include the much more numerous early K-type stars (3 higher space density than G-type stars). The slower evolution of dK stars (due to their lower mass and slower nuclear reaction rates) makes these attractive stars for hosting habitable planets with long-lived, stable climates. The focus of the overall investigation is twofold – (1) Modeling of dwarf K-type stars to better understand magnetic activity and magnetic energy generation (i.e., dynamo), and (2) Constructing complete irradiance tables covering the main-sequence evolution of low-mass K-type stars. Similar to the solar proxies, the stars in this program have been selected in a narrow spectral type interval (K0-K5 V) and cover a wide range of rotation periods (aka ages). As shown in Table 1, our sample of targets covers ages from 50 Myr ( 0.5 days) to 8-12 Gyr ( 50 days). These program stars have well determined parallaxes, colors, spectral types, and also have observations of age-sensitive measures (rotation) such as LX, C IV (1550Å), and Mg II h+k (2800Å) emission fluxes.
This larger study, besides improving our understanding of magnetic dynamo-related phenomena, will help to identify and characterize stars that might be suitable for life. dK stars are excellent hosts for habitable planets – possessing long life, stability, and slow changes in luminosity with time. Their habitable zones (HZs) are fixed for billions of years. Because of the relatively large number of main-sequence K-type stars (13% of all stellar types) in the solar neighborhood, and the closeness of their habitable regions (0.4 - 0.8 AU), these stars will likely be the main targets of exoplanet search missions such as Kepler and CoRoT, along with the proposed Space Interferometry mission and Darwin/Terrestrial Planet Finder missions. An additional important attribute of K stars in terms of habitability is that they evolve very slowly and have lifetimes from 2 to 5 times that of the Sun. These investigations will also have a major impact on studies of X-ray through NUV radiation and their effects on the environments of extrasolar planets and possible origin and evolution of extraterrestrial life.
Long-term chromospheric magnetic activity cycle modulations have been optically measured for nearly 100 K stars (see, for example, Baliunas, et al. 1995). At this point, however, the coronal X-ray magnetic activity cycles of both G- and K-type stars are largely unknown, with only about three reasonable determinations (see Favata et al. 2008). Presented here is the analysis of the nearest K star, Centauri B.
2. THE CENTAURI SYSTEM
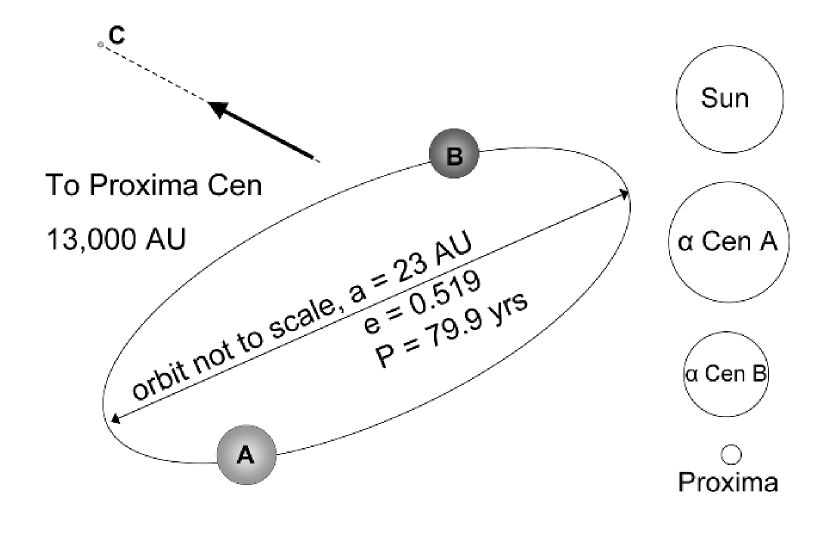
The Centauri triple star system is the closest star system to the Sun at a distance of 1.3470.003 pc (The Hipparcos Catalog, Perryman et al., 1997; van Leeuwen, 2007; Soederhjelm, 1999; Pourbaix et al., 1999). Cen AB is a well-separated, tidally non-interacting binary system (P = 79.9 yr; separation 23 AU), consisting of a G2 V (A) and a K1 V (B) star. A third component (C), the dM5e star Proxima Centauri, is most likely gravitationally bound to Cen AB, but in a wide orbit separated by about 13,000 AU (see Figure 1 and Table 2). The secondary ( Cen B; HD 128621) is slightly smaller than our Sun with regard to its mass (M/M⊙ = 0.90; Demarque et al. 1986; Pourbaix et al. 2002; Yildiz 2008), radius (R/R⊙ = 0.86; Kervella et al. 2003), and temperature (T/T⊙ = 0.92; Neuforge-Verheecke & Magain 1997; Morel et al. 2000; Porto de Mello et al. 2008). However, Cen B is expected to have a deeper convection zone (CZ 0.5 R∗) and is slightly older ( 5-6 Gyr; see Flannery & Ayres 1978; Demarque et al. 1986; Guenther & Demarque 2000; Thévenin et al. 2002; Eggenberger et al. 2004; Yildiz 2007, 2008) than our Sun.
Due to its proximity, the Cen system has been extensively researched. In studies of stellar magnetic activity, Cen forms an astrophysical laboratory to investigate angular momentum loss, coronal and chromospheric activity, for three coeval stars with differing masses (1.09, 0.90, and 0.12 M⊙) and deepening outer CZs (0.3, 0.5, and 1.0 R∗). Also, Cen B is the oldest K-type star with a well-determined age – determined from the isochronal age of its close companion, Cen A (5-6 Gyr; Flannery & Ayres 1978). This makes Cen B, along with Cen A and Cen C (Proxima), crucial calibrators for any age/activity/rotation studies.
The frequency of planets occurring in multiple star systems has recently been investigated by Bonavita & Desidera (2007) and Quintana et al. (2007). In particular, the possibility of planets hosted in the Cen AB system has been addressed dynamically by Benest (1988), Wiegert & Holman (1997), and Guedes et al. (2008). In fact, Thebault et al. (2009) show that Cen B may be both plausible, and well-suited observationally, for the potential detection of a terrestrial-type planet residing within its habitable zone (HZ 0.6 - 1.2 AU). Unfortunately, to date there is no evidence for planets hosted by the system (see, also, Murdoch et al. 1993; Hatzes et al. 1996; Endl et al. 2001). However, the Cen AB system has an 2 higher metal abundance than our Sun ([Fe/H] 0.25; Furenlid & Meylan 1990; Chmielewski et al. 1992; Neuforge-Verheecke & Magain 1997; Doyle et al. 2005; Porto de Mello et al. 2008). This may favor the formation of terrestrial planets. Giménez (2000) and Wyatt et al. (2007), for example, have shown that extrasolar planets tend to be hosted by stars with higher than average metal abundances.
High precision astrometry of Proxima Centauri ( Cen C) carried out by Benedict (2008) with the fine guidance sensor (FGS) camera aboard the Hubble Space Telescope (HST), reveals no evidence of hosted planets with masses greater than 5 M⊕ (see also Benedict et al. 1999; Bean et al. 2006; Benedict et al. 2008). However, this study indicated an 83.1 day variation in brightness, most likely originating from the rotational light modulation from starspots. Analysis of over seven years of photometry of Proxima confirms this rotation period (see S.G.Engle et al. 2009, private communication) and also indicates a possible 7 yr starspot cycle. High-precision radial velocity studies have also yielded only upper limits, with m sin i 1 M♆ and separations a 1 AU (Kürster et al., 1999; Endl & Kürster, 2008).
Although the primary focus of this paper is Cen B, we now have sufficient data to compare the rotation and activity cycles of all three stars of this system. This comparison is intriguing because all three stars are coeval, differ mainly in mass, Teff, and convective zone depth. Thus the Cen triple system can serve as a “mini” laboratory for studying angular momentum loss, activity, and cycle properties. As part of our ongoing research, the rotation periods of Cen A, B, C are observed to be 15-20, 36.21.4, and 83.10.6 days, respectively. As seen, there is a strong dependence of rotation on mass and convective zone depth (magnetic activity). Young ( 300 Myr) G, K, and M stars are for the most part all fast rotators with rotation periods less than about 5 days.
3. X-RAY OBSERVATIONS OF CENTAURI B
The Centauri system was observed by the Röntgen Satellite (ROSAT) High Resolution Imager (HRI; 0.1 - 2.4 keV), the Chandra X-ray Observatory (Chandra) Low Energy Transmission Grating Spectrometer (LETGS; 0.07 - 10 keV with the High Resolution Cameras, HRC-S and HRC-I), and the XMM-Newton (XMM) European Photon Imaging Camera (EPIC; 0.15 - 15 keV). Since the range in measured coronal X-ray luminosity depends very strongly on the observed (or chosen) energy band, these luminosity measures cannot be directly compared. Though Cen B is a “soft” coronal X-ray source, with no significant amounts of flux expected above about 1 keV, the overall energy passband used/assumed in determining X-ray luminosities is critical.
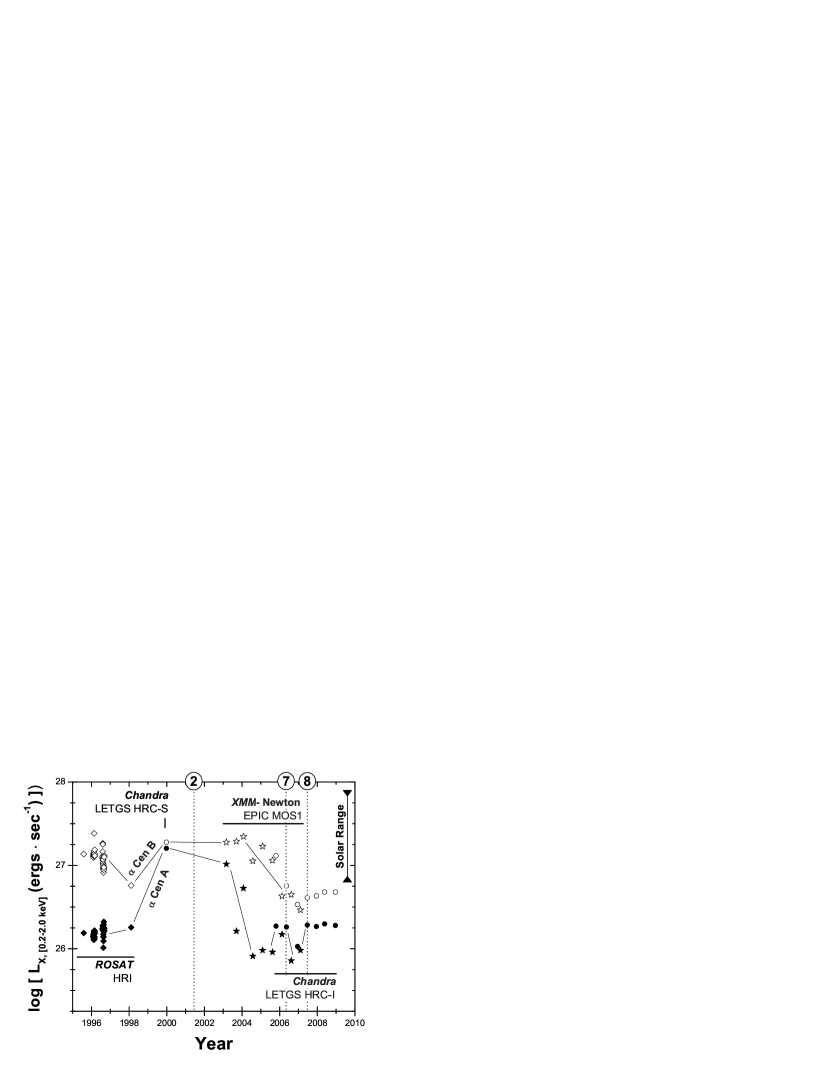
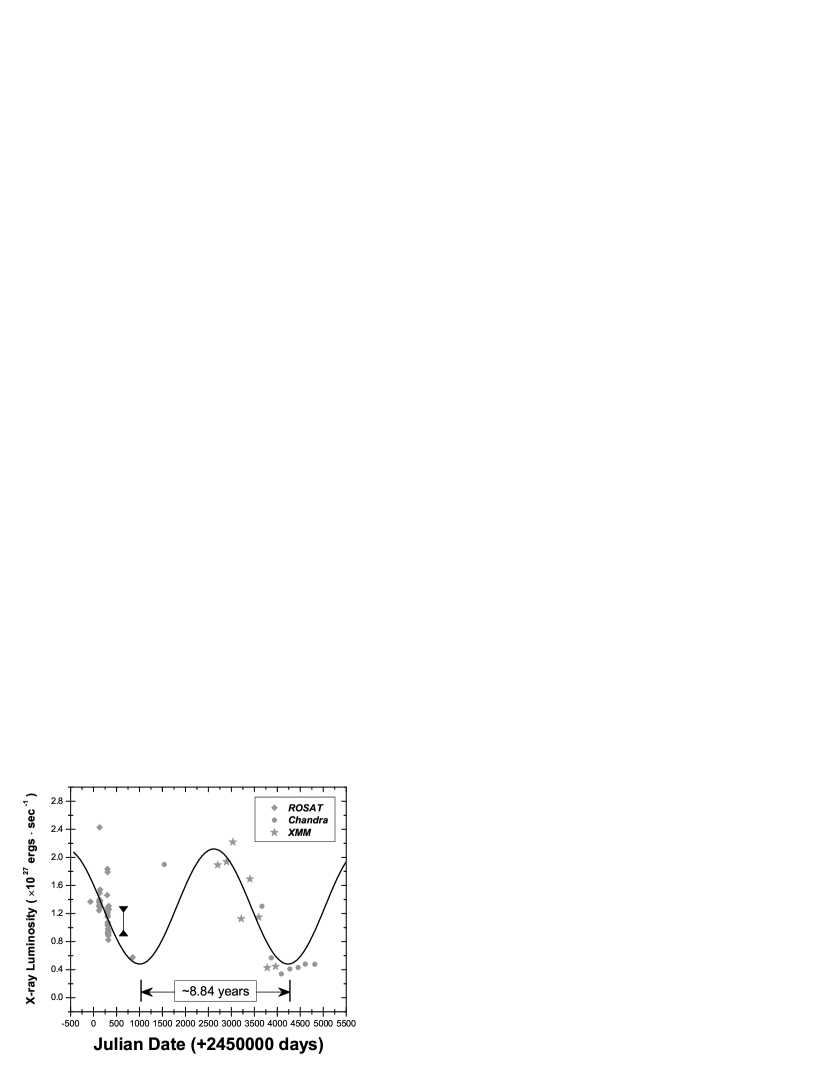
Fortunately, an important recent study on the Cen AB system (along with CMi and Eri) by Ayres (2009) nicely resolves this difficulty. In this paper, all spatially resolved measurements from ROSAT, Chandra, and XMM-Newton are compared and studied on a common, homogeneous basis, and the appropriate conversion factors for the individual instrumental count rates to absolute fluxes are determined. In our study, all of the original X-ray count rates have been converted into the homogeneous [0.2 - 2.0 keV] passband using the appropriate energy conversion factors provided by Ayres (2009). Figure 2 displays these combined coronal X-ray luminosities (L) for both Cen A and Cen B, respectively. As reported by Ayres (2009), typical uncertainties (L) are approximately 4%, 3%, and 2% for the individual ROSAT, Chandra, and XMM measurements, respectively.
Twenty-seven ROSAT pointings were carried out by Jürgen Schmitt in 1996 August/September and show only small-scale variability in the X-ray luminosity levels for Cen B, averaging L = 1.1 ( 0.26) 10 27 erg s-1. At the time of the lone Chandra HRC-S observation in 1999 (Raassen et al., 2003), the X-ray luminosity of Cen B had slightly increased to L = 1.910 27 erg s-1. More recently, the XMM observations reported by Robrade et al. (2005) demonstrate that the coronal X-ray luminosity for Cen B diminishes from L = 2.210 27 erg s-1 (early 2004) to L = 0.310 27 erg s-1 (early 2007) – a factor of 7 in three years’ time. This behavior is directly corroborated by the largely contemporaneously obtained Chandra observations (Ayres, 2009). As seen in Figure 2, Cen B appears near the minimum of a coronal magnetic activity cycle around the early part of 2007.
The range in solar X-ray luminosity also depends strongly on the observed (or chosen) energy band. For example, existing estimations of the long-term variability of the Sun during its 11 year magnetic activity cycle are remarkably varied. The Sun is also a “soft” coronal X-ray source, but the overall energy passband used/assumed in determining solar X-ray luminosities remains critical. Using solar measurements from the Student Nitric Oxide Explorer (SNOE) satellite, Judge et al. (2003) cite an expected true max-to-min variation of order 5-6 for the Sun over its full activity range for a typical contemporary cycle. This stems from their analysis, and ultimate removal, of the effects of rotational modulation of active regions on the observed X-ray luminosities. This reduces the total measured X-ray luminosity amplitude (12; activity cycle + rotational modulation) to that component that represents the changes due to the activity cycle alone (5-6). In their study, great effort was made to convert the observed bandpass of the SNOE solar X-ray photometer (SXP; 0.04 - 0.6 keV) to that of the ROSAT Position Sensitive Proportional Counter (PSPC) bandpass (0.1 - 2.4 keV; in “ROSAT All-Sky Survey” mode).
On the other hand, the Yohkoh soft X-Ray telescope (SXT; 0.25 - 4.0 keV) also provides direct solar observations corresponding to those we consider here for Cen B. In his study, Acton (1996) determined that the Sun’s activity between 1991 November (near solar maximum) and 1995 September (near solar minimum) exhibited a decline in the full-disk X-rays of greater than a factor of 25, with an accompanying change in average coronal temperature of only 3.3 to 1.5 MK. However, it appears that X-ray energy sensitivity is strongly biased to high X-ray bandpasses, even though no significant amounts of solar flux are expected above about 1 keV.
An excellent review of previous and current published estimates of the Sun’s X-ray luminosity is contained in the work of Judge et al. (2003). Our Table 3 reproduces much of their effort here. As seen, there is a large range of estimated total variation in the Sun’s coronal X-ray luminosity over its long-term magnetic activity cycle, from about 4 - 50 (max/min)! Further, these published ranges do not appear to be correlated to upper/lower energy sensitivities or overall X-ray bandpass. Herein we adopt the result given by Judge et al. (2003). We use their determination of the observed X-ray luminosity of the Sun, converted into the ROSAT PSPC bandpass, and extrapolated over the entire activity range of a typical contemporary solar cycle. This overall variability (12) retains the additional influence of rotational modulation. Since it is not possible to remove all effects of rotational modulation on the observed X-ray luminosities of Cen A and B due to incomplete temporal coverage (Figure 2), in this manner a direct comparison with the Sun can still be made.
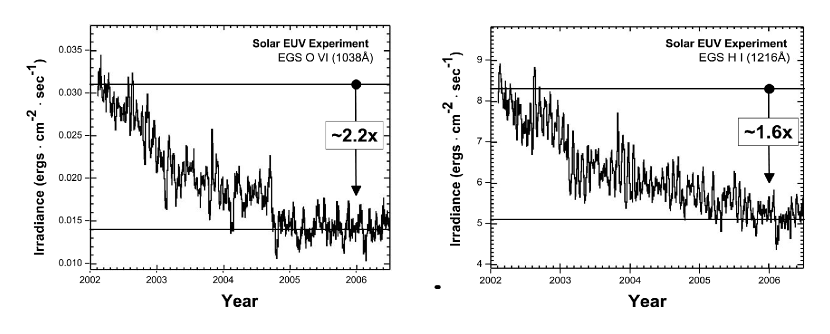
Judge et al. (2003) demonstrate that our Sun typically fluctuates in coronal X-ray luminosity by a factor of 12 (L 6.3-79 10 26 erg s-1) over its 11 year magnetic activity cycle. Since this X-ray variability is primarily due to changes in the level of overall magnetic activity, not merely coronal temperature changes, the corresponding TR and chromospheric variations are both expected and measured to be tightly correlated (see Lean 1997). Indeed, Solar EUV Experiment (SEE, aboard NASA’s TIMED mission; see Woods et al. 2005) observations from 2002 (near solar maximum) to 2006 (solar minimum) show a decline in the TR-produced O VI (1038Å) emission feature of 2.2, and a decline of 1.6 in the chromospheric H I Ly- emission levels (Figure 3).
Studies of cosmogenic isotopes, C14 (in tree rings) and Be10 (in ice cores), have been employed to trace the Sun’s activity back over the last 12,000 years (Solanki et al., 2004). Curiously, this study reveals that the solar magnetic activity (defined by solar winds and sunspots) appears to have been exceptionally high over the last 70 years, but is perhaps declining now. This may help to explain the apparently low (relative to the present Sun) coronal soft (0.1 - 2.5 keV) X-ray luminosities observed for the solar analog Cen A, as seen in Figure 2. Three other well-studied solar-type stars (18 Sco, 16 Cyg A and B) also appear to have X-ray emissions considerably lower than current solar values. 18 Sco is the best known match to the Sun with regard to age, rotation, and physical properties, and has an observed L 8 10 26 erg s-1 at the maximum of its 7-11 year activity cycle (Coughlin et al., 2010). This is comparable to the maximum value of L for Cen A, but less than one half of the modern (last two decades) solar values. We have currently been granted Chandra X-ray observations of 18 Sco during its activity cycle minimum. Again, as in the case of Cen A, this lends support to the hypothesis that the Sun is in an exceptional high activity level compared to historical levels, defined over the last 10,000 years. Although too soon to know for sure, based on previous and current solar activity cycles/measures, the Sun may show signs of declining activity (see Komitov et al. 2010; NOAA Space Weather Prediction Center; www.swpc.noaa.gov/SolarCycle/).
It is clear that a direct comparison of the Sun to Cen B is problematic, since different instruments (and X-ray bandpasses) are employed for the two disparate objects (see, for example, Micela & Marino 2003). This notwithstanding, the X-ray [0.2 - 2.0 keV] luminosity of Cen B has decreased by a factor of nearly 7 over the 5 year time frame of the self-consistent XMM and/or Chandra observations. This behavior thus appears consistent with a solar-like 11 year X-ray activity cycle.
3.1. Long-term Coronal X-ray Activity Cycle
The entire Cen B X-ray dataset spans 13 years (1995-2008) making it potentially sufficient, temporally, to determine the long-term coronal magnetic activity cycle. Therefore, all available X-ray luminosity observations were analyzed using the method of Lomb-Scargle (Lomb, 1976; Scargle, 1982), as modified for unevenly sampled data (see Horne & Baliunas 1986; Press & Rybicki 1989). This particular algorithm has certain computational advantages over other methods, such as the treatment of missing values and a quantitative estimate of the false discovery rate (FDR). In Section 6 below, additional discussion of the “robustness” of these analytically-determined FDR’s is given. The results were further refined with an iterative grid search procedure to determine possible cycle rates, modulation amplitudes, and phase information for Cen B.
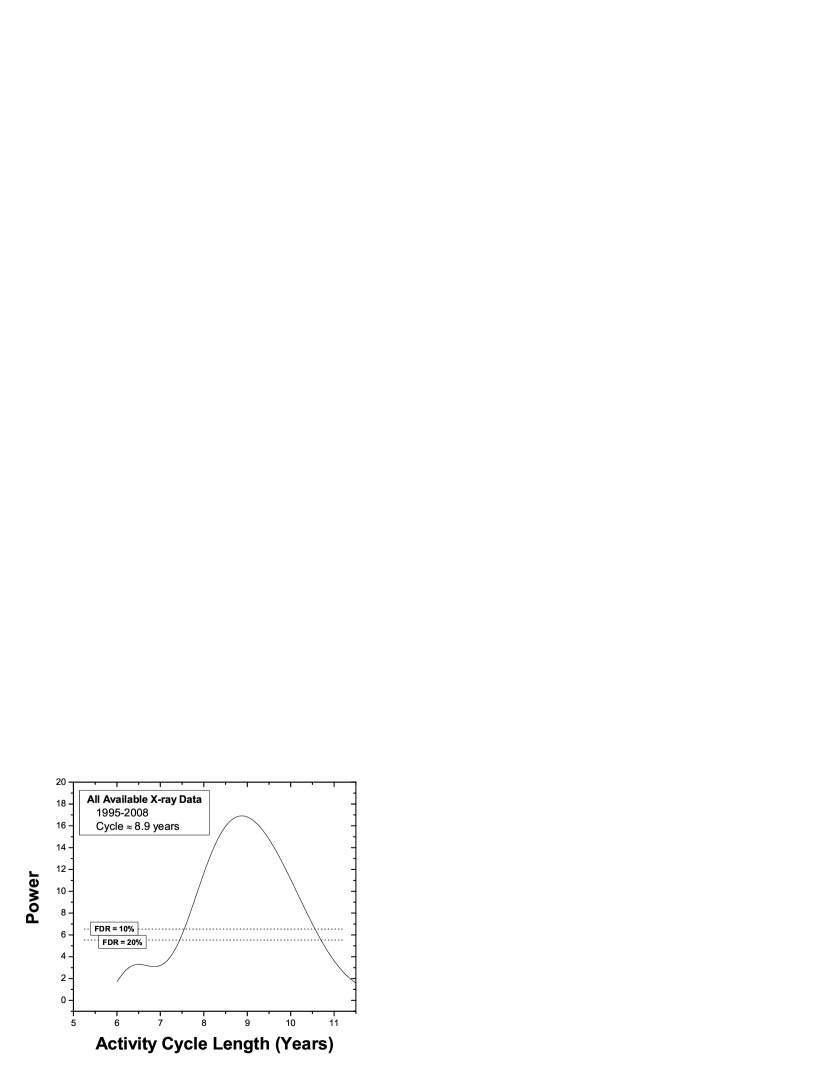
Figure 4 shows the resultant Lomb-Scargle power spectrum for this complete (1995-2008; ROSAT, Chandra, XMM) set of coronal X-ray measurements for Cen B. Unfortunately, with only slightly more than one complete cycle’s worth of X-ray data, the long-term magnetic activity cycle length is not well constrained. As seen from the relatively broad nature of the power spectrum, cycle rates of between about 7.5 and 10.75 years must be considered plausible with better than 20% FDR. This notwithstanding, a cycle length of Pcycle 8.9 years is favored with an apparent very high confidence (FDR is essentially 0%!).
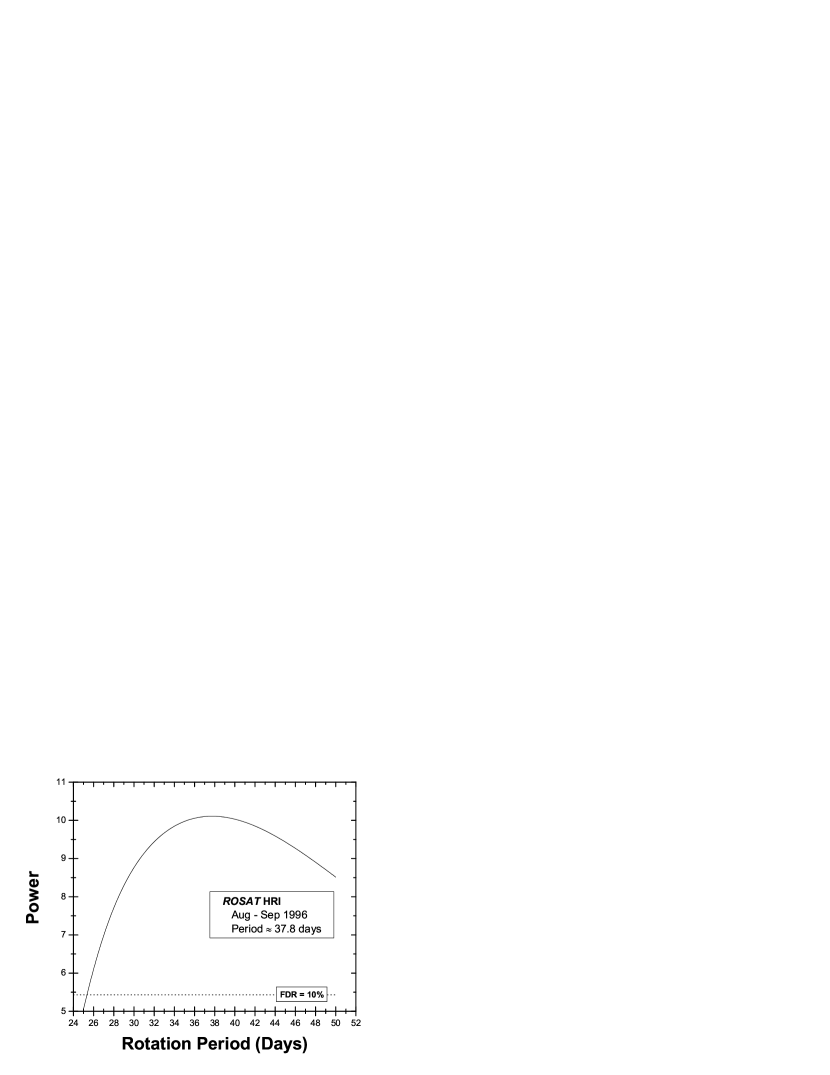
3.2. Short-term Coronal X-ray Modulation - Rotation Period
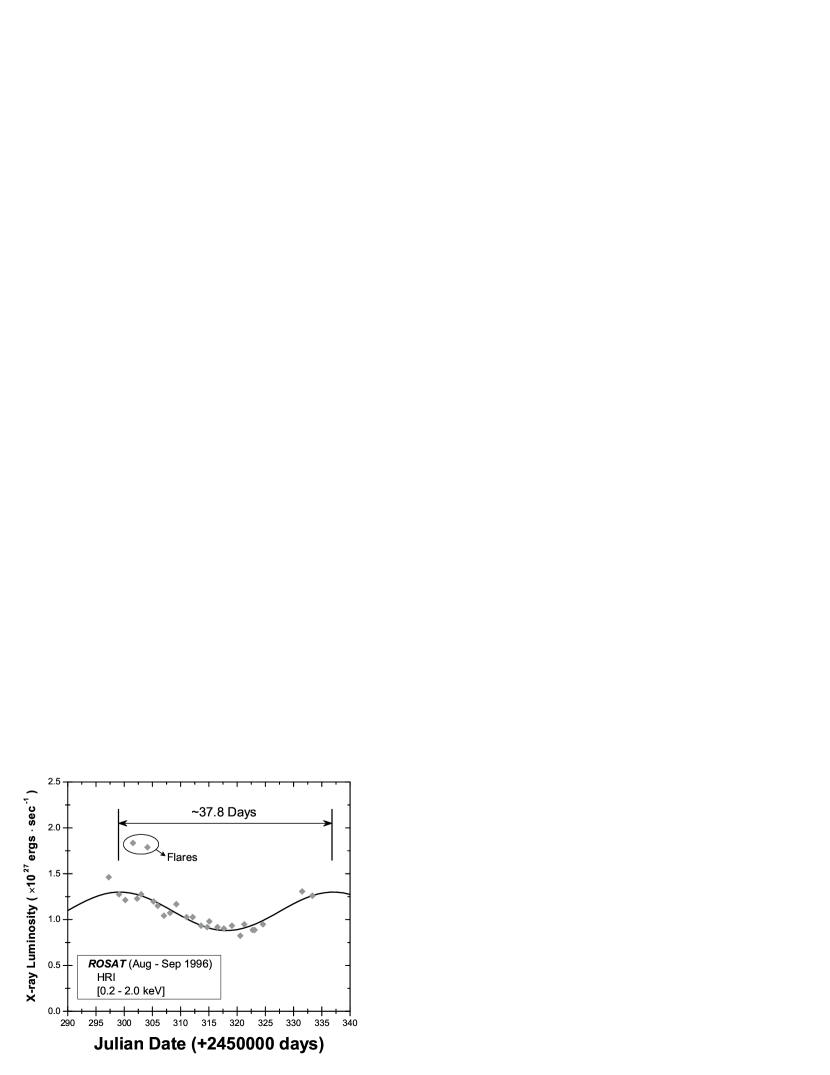
To determine the rotation period of Cen B from the low-amplitude, sinusoidal-like modulation of light due to the rotational effects attributed to the presence of magnetically active regions (starspots, plages, bright light faculae, chromospheric or coronal features), appropriate sections of data need to be isolated. Ideally, suitable portions would be 50 - 100 days long – long enough to contain sufficient observations, but short enough to minimize the effects of possible formation, migration, and/or destruction of these active regions. Fortunately, the 1996 August-September ROSAT pointings contain 27 individual X-ray measures spanning 35 days that should be sufficient for the determination of the rotation period of Cen B.
Figure 5 shows the resultant Lomb-Scargle power spectrum for this subsection of ROSAT X-ray observations for Cen B. As seen, a relatively large range (25.3 - 50+ days) would result in an estimated FDR better than 10%, but a rotation period of Protation 37.8 days is favored with an apparent very high confidence (FDR 0.1%). Figure 6 shows the 1996 August-September X-ray luminosity observations with the best-fitting, 37.8 day period, light curve overplotted. An iterative grid search routine was employed to determine the appropriate light modulation amplitude and cycle phase. In this case, with less than one complete cycle’s worth of information, this rotation period determination cannot be considered well constrained, but in fact is consistent with other independent period estimates (35 - 42 days) as addressed in more detail below (Section 5.2). As in the case of the Sun, differential rotation of active regions could produce year-to-year variations in observed rotation.
4. FUSE FAR-ULTRAVIOLET OBSERVATIONS OF CENTAURI B
The key emission line fluxes obtained by the Far Ultraviolet Spectroscopic Explorer (FUSE) satellite are used to probe specific regions of the stellar atmosphere, from the hot plasmas of the upper chromosphere (H I Lyman … series, 12,000 K; C II (1036/7Å), 20,000 K), the TR (C II; C III (977,1176Å), 50,000 K; O VI (1032,1038Å), 300,000 K) through the low corona (O VI).
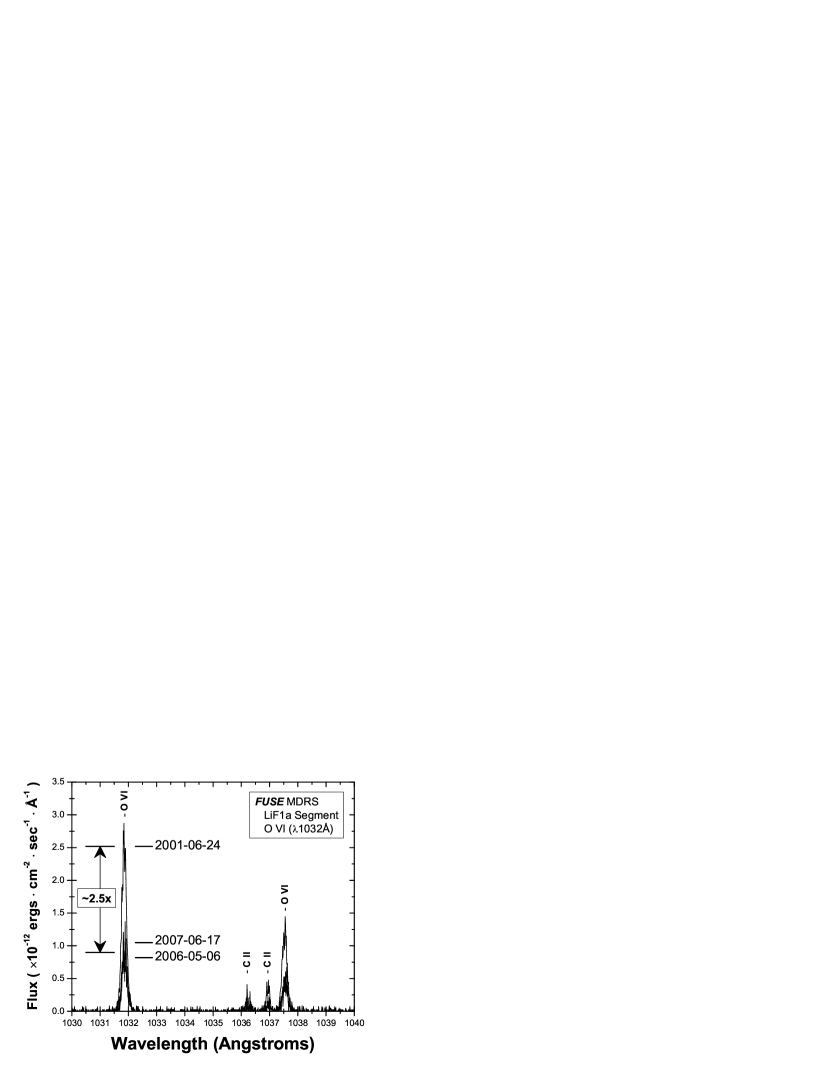
The FUSE satellite observed both Cen A and Cen B on three separate occasions (see Table 4). In 2001 June (Cycle 2), both stars were observed with the medium resolution aperture (MDRS, 420; Program ID: P104; PI: K. Sembach). The spectra have excellent signal-to-noise ratios (S/Ns) for the stronger emission features, and the peak flux of the C III (977Å) line for Cen B was = 4.110-11 (cgs). In 2006 May (Cycle 7) and 2007 June (Cycle 8), Cen A and B were again observed (ID: G081 and H096; PI: L. DeWarf). At these times, the integrated emission flux values of the same C III emission feature for Cen B had diminished to 1.710-11 and 2.110-11 (cgs), respectively – dropping by a factor of 2.5 in about five years’ time.
The angular separation between Cen A and B during the Cycle 7 (2006 May 5) observations had closed to 953 along a position angle of = 233∘. Since the failure of two reaction wheels on the FUSE spacecraft in 2001 December, this provided some additional difficulties for pointing and acquisition. To obtain separate spectra for Cen A and B using the MDRS aperture, the roll angle of the spacecraft needed to be very nearly perpendicular to the position angle of the two stars on the sky – a maneuver rendered significantly more problematic for the crippled satellite. Fortunately, through great effort by the FUSE team, the individual spectra of Cen A and B were ultimately secured.
All of the Cen A and B data were processed in a uniform manner, utilizing the most recent CalFuse calibration pipeline (version 3.2.0). For consistency, the pre-existing 2001 data have also been reprocessed with this same CalFuse version. Unfortunately, certain individual exposures obtained no discernable flux from Cen B. Another “idiosyncrasy” in the individual exposures were partial flux levels. These anomalously low flux exposures were most likely the result of the star being intermittently contained within the aperture during the duration of the exposure. When examined individually, we found a few of these flawed exposures in the pre-existing 2001 data as well. Therefore, an exposure-by-exposure, segment-by-segment analysis of all of the Cen B FUSE data was necessitated and all faulty exposures were removed. Fortunately, due to the proximity of the Cen system resulting in high received FUV flux values, the S/Ns of the remaining individual “On Target” exposures were excellent.
Table 5 provides the integrated flux values measured for the key FUV emission features for all three of the FUSE observing cycles. The uncertainty estimates, stemming from the internal inconsistencies among the individual segments and exposures for a given feature, are also listed. We find that, on average, the individual FUSE spectra, secured during a given epoch, are consistent to better than about 25%.
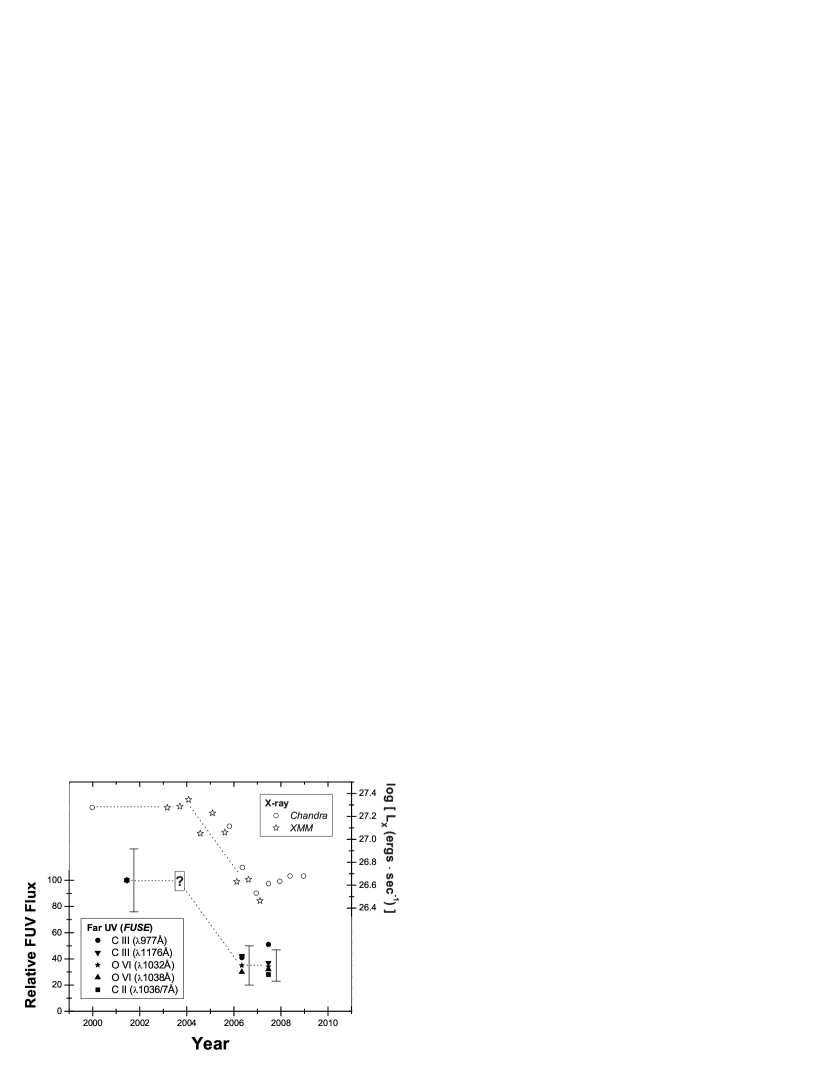
Figure 7 shows the comparison between the emission levels for Cen B for representative FUSE exposures at the three different epochs. Note the substantial decline in integrated FUV flux levels from 2001 June to 2006 May. The ratio of change in these integrated emission flux values, with respect to the 2001 (Cycle 2) values are listed in Table 6. As seen, during the span of time between the Cycle 2 and the Cycle 7/8 observations, Cen B diminishes by a factor of 2.3-3.3 in all of these key TR/chromospheric emission measures. Further, the higher temperature transitions (O VI) diminish by a slightly larger amount than the lower temperature transitions (C II, C III). A similar trend is observed during the solar activity cycle (see Lean 1991, 1997; Acton 1996), and it is expected that as Cen B becomes less active, changes in starspots, faculae, plages, and magnetic network modify the net radiative output by altering the temperature and density of the otherwise homogeneous stellar atmosphere. Unfortunately, given our estimates for the consistency within the individual FUSE spectra, little more can be said about this likely atmospheric temperature trend. The overall drop in FUV emission levels, though, is very likely indicative of a deep-rooted long-term magnetic activity cycle, since variations in atmospheric temperature alone would result in greater departures in the relative differences for the respective atomic species. That is, the reasonably large change in temperature that would be required to alone produce the factor of about 7 difference in the coronally-produced X-ray luminosities presented in Section 3, should also result in a more substantial change in certain FUV temperature sensitive ratios, such as ( / ). On the other hand, a decline in the overall level of magnetic activity in the star would be expected to reduce commensurately all emission fluxes, as has been addressed above for the case of the Sun.
In Figure 8, the relative fluxes of the key FUV emission lines, as determined with FUSE, are displayed over the same time period as the above X-ray observations. This corresponding drop in the FUV emissions, throughout the entire atmospheric structure of the star, indicate a true decrease in the level of magnetic activity, not merely a coronal temperature change.
4.1. Electron Pressures in the Transition Region
We carried out measurements of TR plasma electron pressures (Pe) using the same method described by Guinan et al. (2003) in a FUSE study of solar analogs. One interesting preliminary result for Cen B, derived from our analysis of the TR electron density sensitive / emission line ratio, infers that the Pe appears to remain essentially unchanged during the decline in magnetic activity defined by the X-ray fluxes from 2001 to 2006, but then drops significantly from 2006 to 2007, during magnetic quiescence. We find that at the magnetic activity “high-state” of 2001, 0.28, resulting in a log 14.15 (cgs). At the beginning of the “low-state” in 2006, 0.29, but then appears to abruptly decrease to 0.16 by 2007, resulting in an inferred lower electron pressure, logPe 13.5 (cgs).
By comparison, the “active” Sun (by measuring discrete active regions of the Sun, such as sunspots/plage regions) has an estimated C III -value of about 0.44 (Noyes et al., 1985; Doyle et al., 1985), with the “quiet” Sun at 0.29 (Dupree et al., 1976). Curiously, the proportional change for both Cen B and the Sun are comparable, i.e., (/) 1.67. It should be kept in mind, though, that these FUSE measures of are integrated over the star’s visible disk and would therefore be influenced by the distribution and the number of active emitting regions of differing sizes and activity strengths.
It would have been interesting to confirm this result for Cen B and follow possible Pe changes over more of this stars’ activity cycle, but with the demise of the FUSE satellite, this will no longer be possible in the FUV bandpass.
5. ULTRAVIOLET OBSERVATIONS OF CENTAURI B
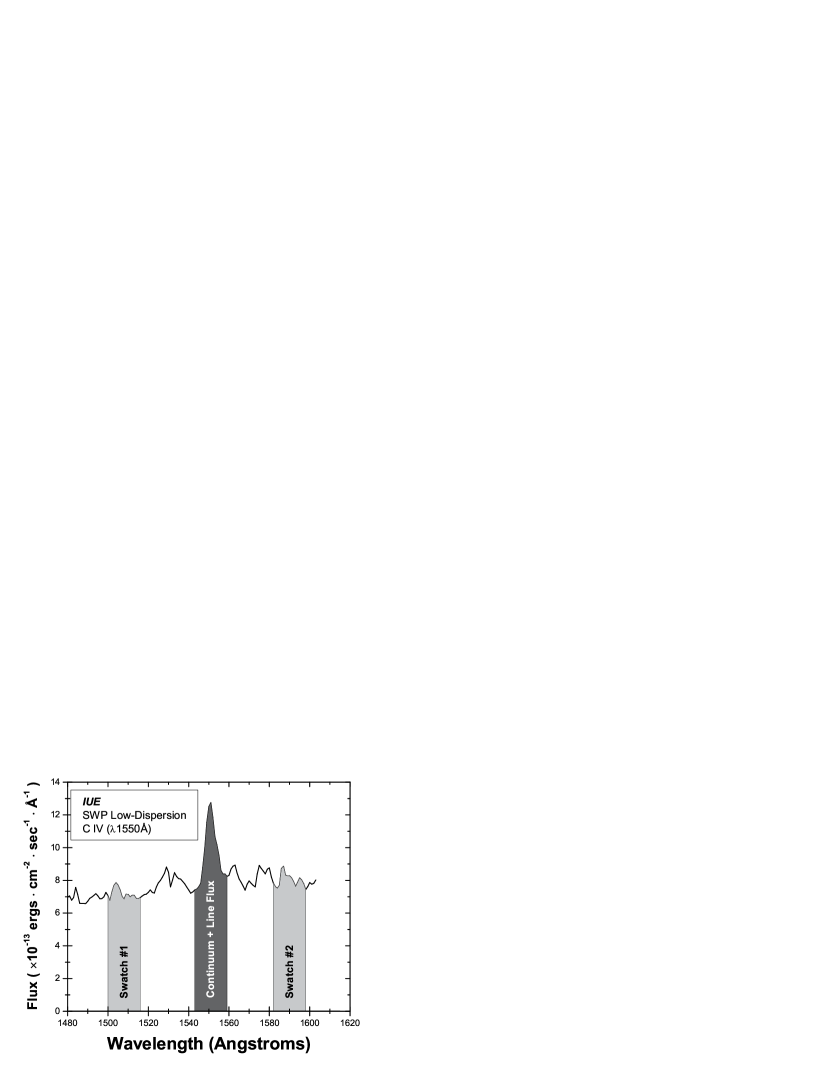
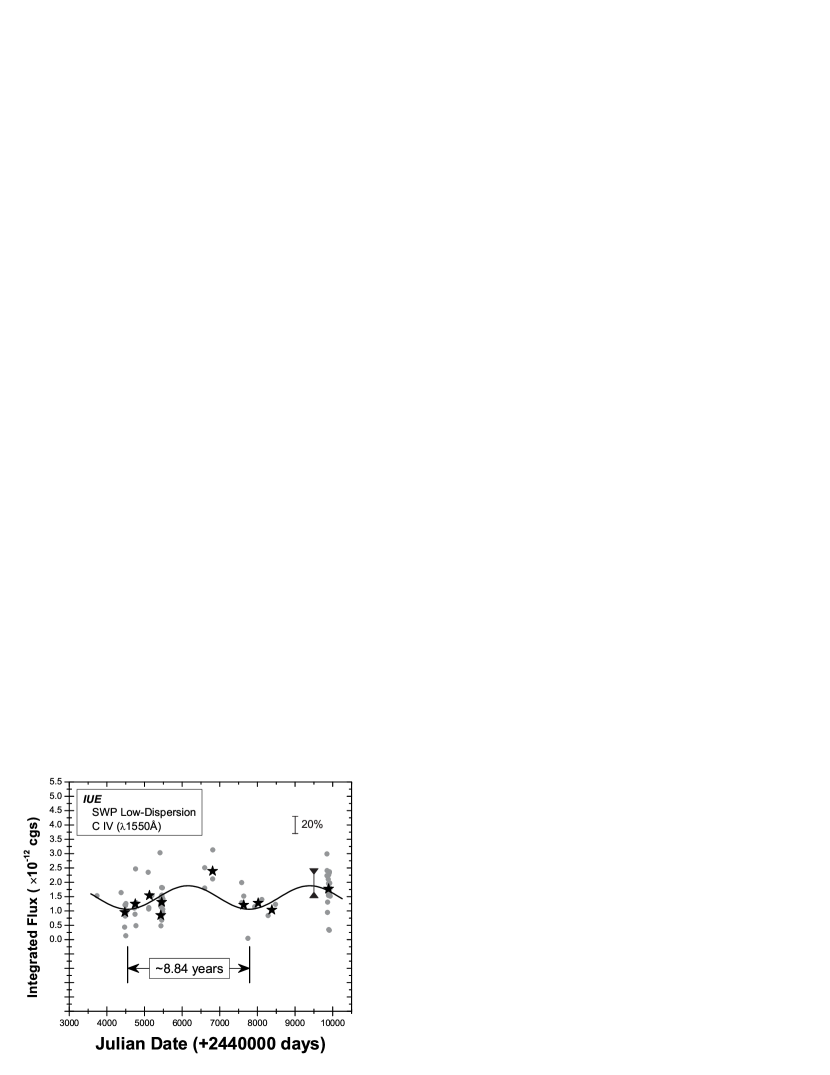
The International Ultraviolet Explorer (IUE) satellite covered wavelengths from 1150 to 3200Å, allowing us to analyze changes in the prominent C IV (1550Å) and Mg II h+k (2800Å) emission features from Cen B. The C IV emission occurs at temperatures from 50,000 to 100,000 K, typically found in the TR of the star. Mg II (8000-12,000K) typically originates in the stellar chromosphere. The longevity of the satellite results in a very large dataset of UV spectral data, critical to long temporal studies. We have utilized observations from 1978 August to 1995 July, providing us with an extensive timeline of C IV and Mg II information.
For Cen B, there are 90 low-dispersion (6-7Å), large aperture (922) IUE spectra obtained by the satellite’s short wave primary (SWP; 1150-1980Å) camera. Focusing on changes in the TR-produced C IV (1550Å) emission line over time, the spectra were reduced by first quadratically interpolating the intensity to each integer wavelength. Next, the center of the C IV line core was ascertained by searching for the maximum intensity value between the wavelength range of 1530 and 1565Å. The flux was then summed over a 16Å swatch around this peak value (8Å), resulting in integrated flux values for the C IV line, combined with the contribution of the continuum in this bandpass. To account for, and ultimately remove, this continuum flux from the C IV data, an average of the total flux of two bracketing 16Å swatches (1500-1516Å and 1582-1598Å) was then subtracted from the above line+continuum flux. This provided us with an accurate determination of the integrated C IV line emission for Cen B. Figure 9 diagrams both the C IV feature and the swatches used to determine the integrated line and continuum fluxes with a typical IUE SWP low-dispersion, large-aperture spectra. Table 7 lists the complete results.
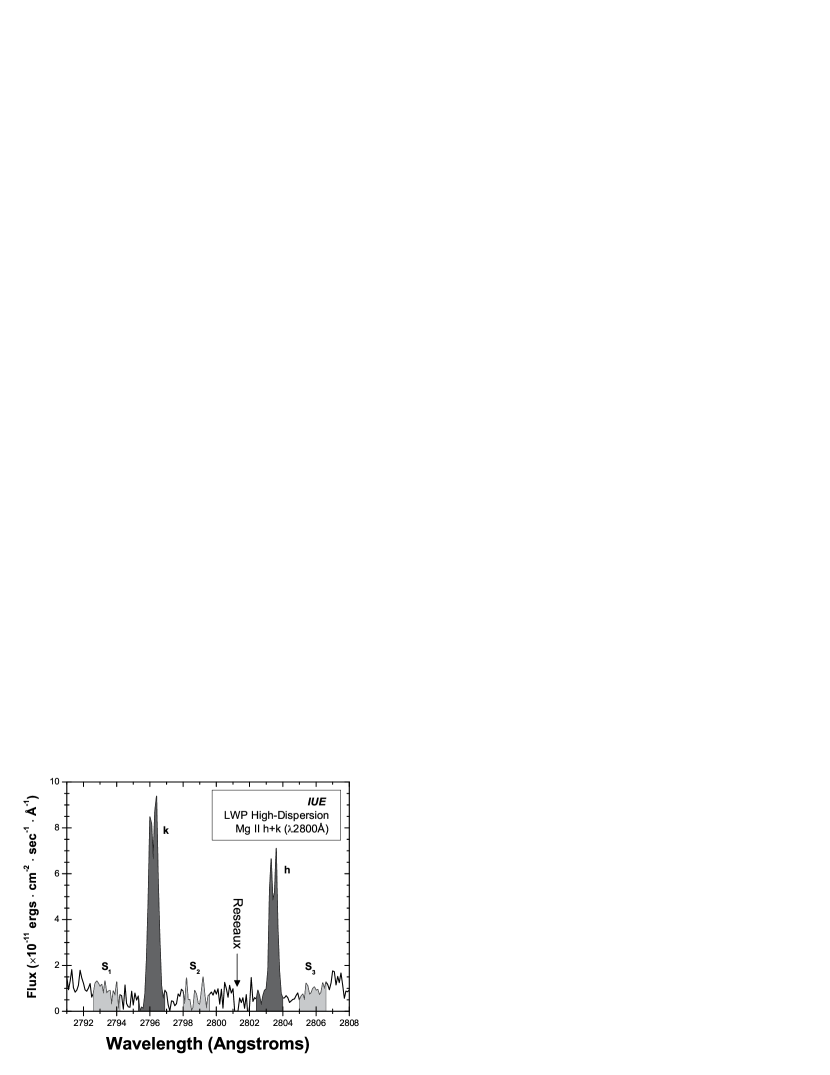
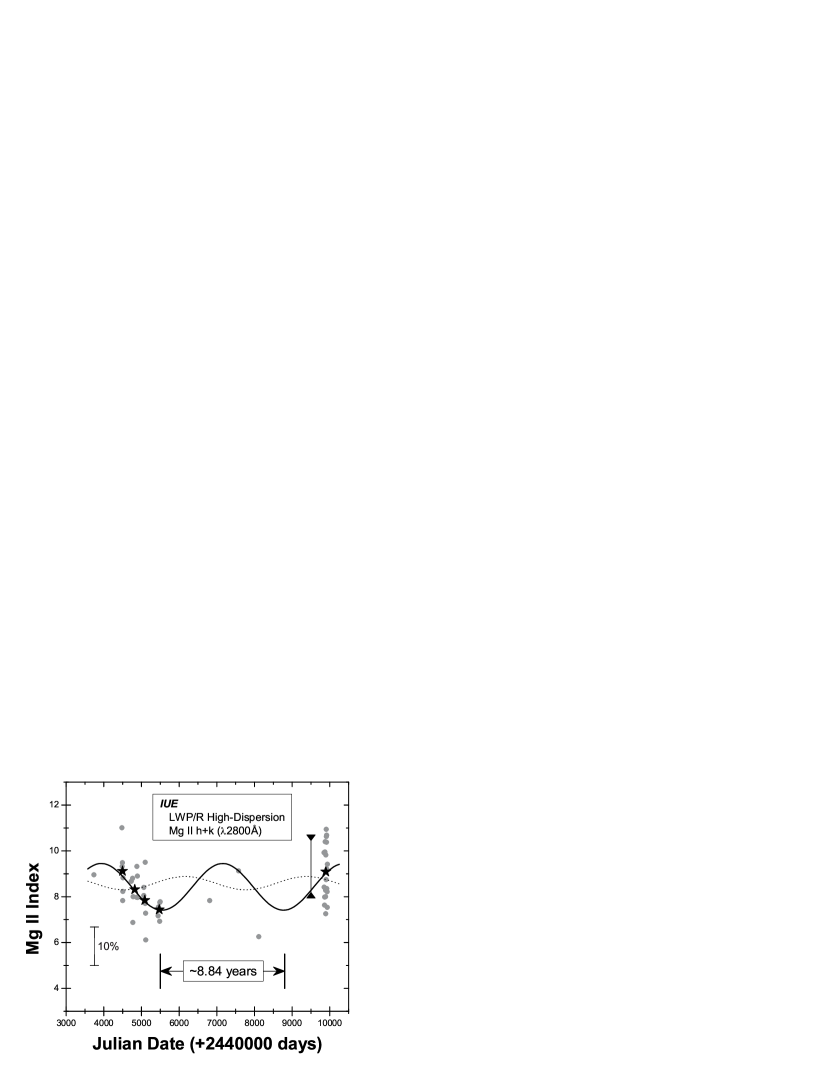
To analyze temporal variations in the chromospherically produced Mg II h+k (2803+2796Å) emission features over the same timeline, this study also included 60 high resolution (0.1-0.3Å), large aperture (1023) spectra from the IUE satellite’s long wave primary (LWP) and long wave redundant (LWR) cameras. Due to differences in the profile of these spectral features, it was necessary to reduce these data in a different manner. We used fixed wavelength regions to define the individual Mg II h+k line cores and three separate swatch regions. An Mg II “Index” was defined by dividing the integrated flux values for each line by a combination of the three continuum swatches, i.e.
In the above relation, the values h and k refer to the total integrated flux in the region of the emission features, 2802.4-2804.0Å and 2795.3-2796.9Å, respectively. The three swatches are defined to be S1 (2792.6-2794.2Å), S2 (2798.0-2799.6Å), and S3 (2805.0-2806.6Å). The swatch S2 is not centered directly between the h+k features to avoid the fiducial mark (reseaux) incorporated into the IUE vidicon detector. An example of this method for measuring the Mg II h+k emission line strength is shown in Figure 10, and Table 8 lists the complete results.
The IUE vidicon cameras had a maximum dynamic range of 256, though this was significantly limited by background noise and a low-level baseline intensity “pedestal.” Ayres (1997) point out that the maximum intrinsic S/N per pixel is 12:1. Due to the manner by which adjacent pixels were grouped in low resolution mode, Massa & Fitzpatrick (2000) demonstrate that an S/N 30:1 is ideally possible per spectral element. They also point to substantial systematic effects that remain in the IUE New Spectroscopic Image Processing System (NEWSIPS) data (used in this study), producing spectra that are only internally consistent to 10%-15%, at best. Unfortunately, the majority of these remaining systematics are time dependent. The flux sensitivity of the LWR camera, the worst case example, is shown to diminish by about 10% over its 5 years of service. Short-term temporal systematics also remain in the data, and can contribute to a “noise-like” uncertainty exceeding 10%.
In an attempt to assess the overall quality of the IUE data presented here, as it was reduced using the techniques outlined above, we selected several UV flux standard stars that were used as calibration standards for HST (see Bohlin et al. 1990). We measured all available spectra for the two stars that were the closest spectral type matches to Cen B, HD 186427 (G5 V) and HD 27836 (G1 V), along with the cool subgiant HD 2151 (G1 IV). We also subjected our reduction routines to sample spectra of the two IUE “prime standard” stars, HD 50753 (B3 IV) and HD 93521 (O9 V). With regards especially to the latter prime standard stars, these spectra were obtained uniformly throughout the life of the satellite, and therefore address the extent of the potentially remaining long- and short-term systematics in the NEWSIPS data, along with the internal consistencies (noisiness) within the individual IUE LWP/R and SWP spectra.
From this analysis we find that the internal consistency of the IUE NEWSIPS data, convolved with our method of data reduction, results in an uncertainty of better than about 20% for our integrated C IV line emission measures, and 10% for the individual Mg II h+k emission Index values. In addition, there were no discernable trends in the reduced spectra that were common to all of the measured standard stars that could have given rise to potential “false-positive” cycle determinations within the Cen B data set.
5.1. Long-term Magnetic Activity Cycle, Revisited
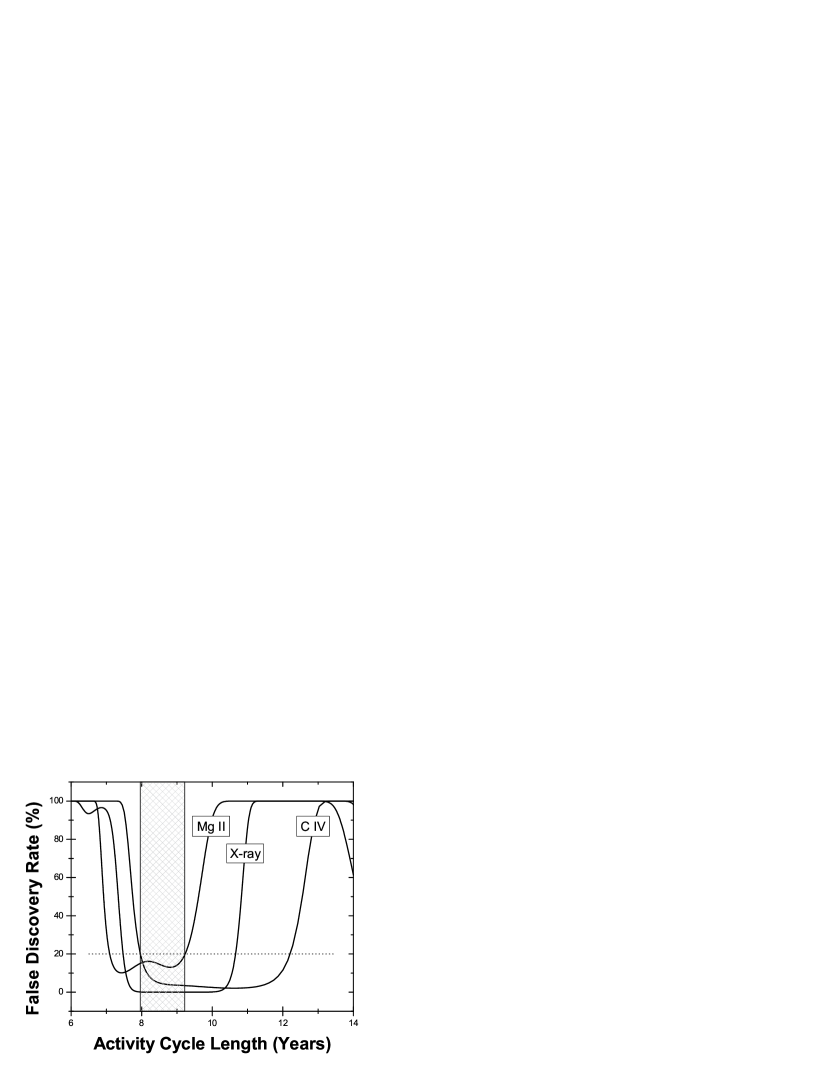
The long-lived (1978-1995) IUE satellite provides an opportunity to study Cen B’s magnetic activity over a relatively long period in the years preceding the current magnetic quiescence, as defined by the X-ray and FUV data described above (Sections 3 and 4). The results of the Lomb-Scargle periodogram analysis, with the complete C IV (1550Å) and Mg II h+k (2800Å) data sets along with the entire X-ray luminosity measures, are shown in Figure 11. If we require an FDR of better than 20%, the intersection of the three FDR functions results in an expected long-term activity cycle between 7.96 and 9.22 years.
In their analysis of the Mg II data, Buccino & Mauas (2008) determine a long-term activity cycle of 8.38 yr (3061 days). Their procedure involved transforming the mean continuum flux near the Mg II h+k emission lines to the corresponding Mount Wilson Ca II HK index, which was then combined with optically determined values.
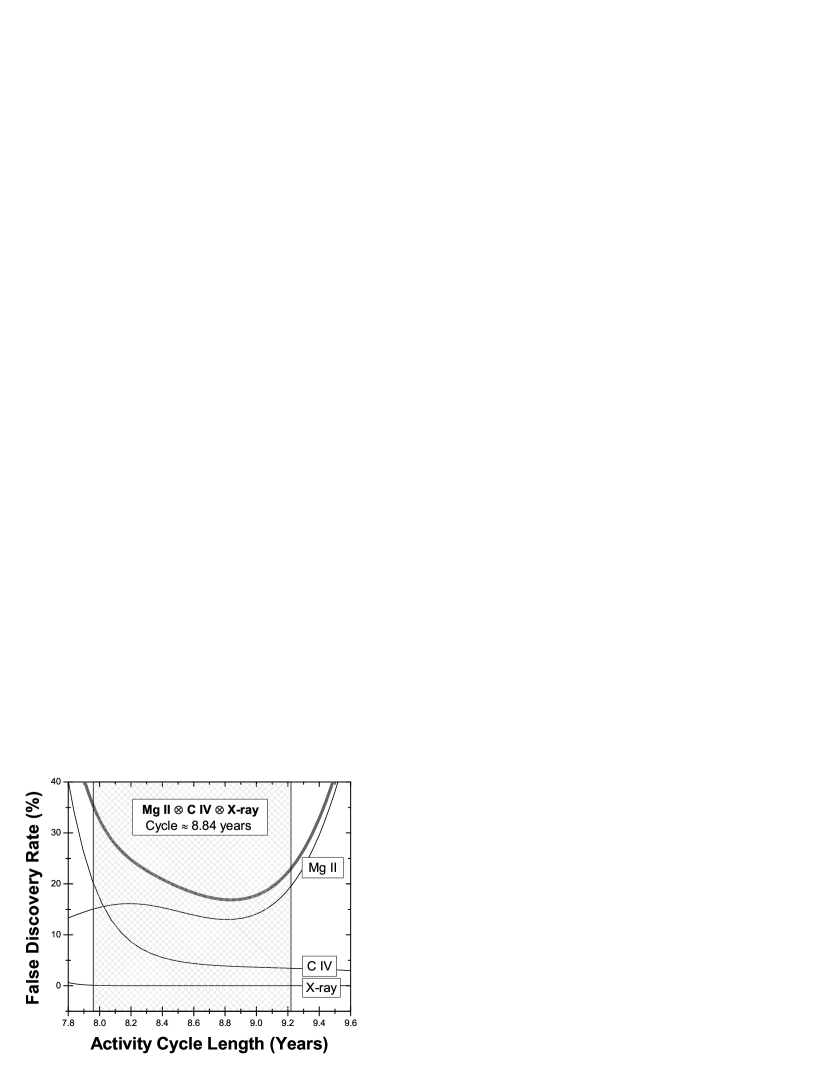
In this study, the convolution of all FDR distributions (see Figure 12) results in an “ultimate” best determination of Pcycle 8.84 years (3230 days) for the long-term activity cycle for Cen B. It should be noted, though, that strict comparison of the FDR functions for the individual X-ray and IUE data sets can be somewhat challenging. Though the IUE data is quantifiably noisier (producing less favorable FDRs), it encompasses multiple complete cycles (producing a much better constrained cycle duration).
An iterative grid search routine was employed to determine the appropriate light modulation amplitude and cycle phase for each of these datasets (X-ray, C IV, Mg II). Figure 13 shows the complete X-ray luminosity dataset with the best-fitting, 8.84 year period, light curve. In Figure 14, the C IV data set is shown with the appropriately modulated and phased light curve overplotted. With regard to cycle phasing, no special consideration was necessary to mesh the X-ray and IUE C IV data correctly. As seen, the earlier C IV activity cycling phases directly into the more contemporary X-ray observations.
It must also be noted that contained within these long-term light curves are the rotational modulation effects of stellar active regions. As determined below (Section 5.2), the ratio of the long-term magnetic activity cycle amplitude to the rotational modulation amplitude (A / A) is about 3.9, 0.80, and 0.5 for the X-ray, C IV, and Mg II observations, respectively. This implies that the X-ray data will be much more sensitive to the long-term magnetic activity changes than the rotational effects of active regions. Conversely, the Mg II Index appears to be the superior choice for more precisely determining Cen B’s rotation period, yielding the highest determinacy.
The long-term chromospheric Mg II Index dataset is shown in Figure 15. Though there is a paucity of data in the important middle regions of the timeline, the periodic cycling of 8.84 years (via Lomb-Scargle analysis; FDR 20%) would seem possible. Peculiarly, the computed best-fitting cycle phasing is significantly different to that of coronal X-ray and TR C IV observations (/2 0.31, corresponding to a cycle phase lag of 1000 days!). An attempt was made to “split the difference” between the cycle phasing of the Mg II and that of both the C IV and X-ray data sets using the method of minimum phase dispersion, but this only resulted in a compromise that visually appeared inadequate for all three data sets.
It is possible that since the measured amplitude attributable to rotationally
modulated Mg II h+k emission is significantly larger than the
variability due to overall long-term chromospheric activity changes, that the
effects of rotation modulation, combined with the insufficiently sampled
data is overwhelming the effects attributable to long-term activity, resulting
in a serendipitously measured 8.8 year period. Alternatively, it is
possible that this measured activity cycle length is indeed real and physical,
but is simply not synchronized with activity levels in the hotter TR
(C IV) and corona (X-ray). Considering the Sun’s behavior in which
the magnetic activity indicators are well-correlated (see, for example,
Lean 1997; Judge et al. 2003), this latter scenario for Cen B must
be considered unlikely.
5.2. Rotation Period, Revisited
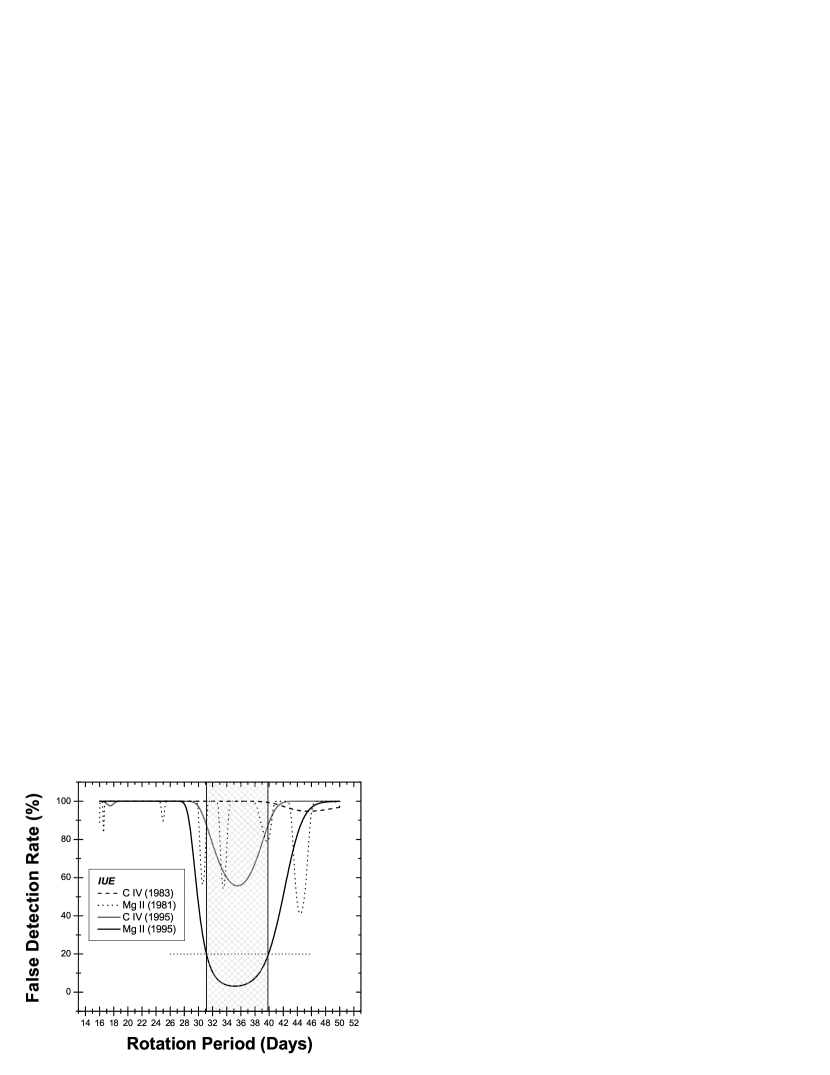
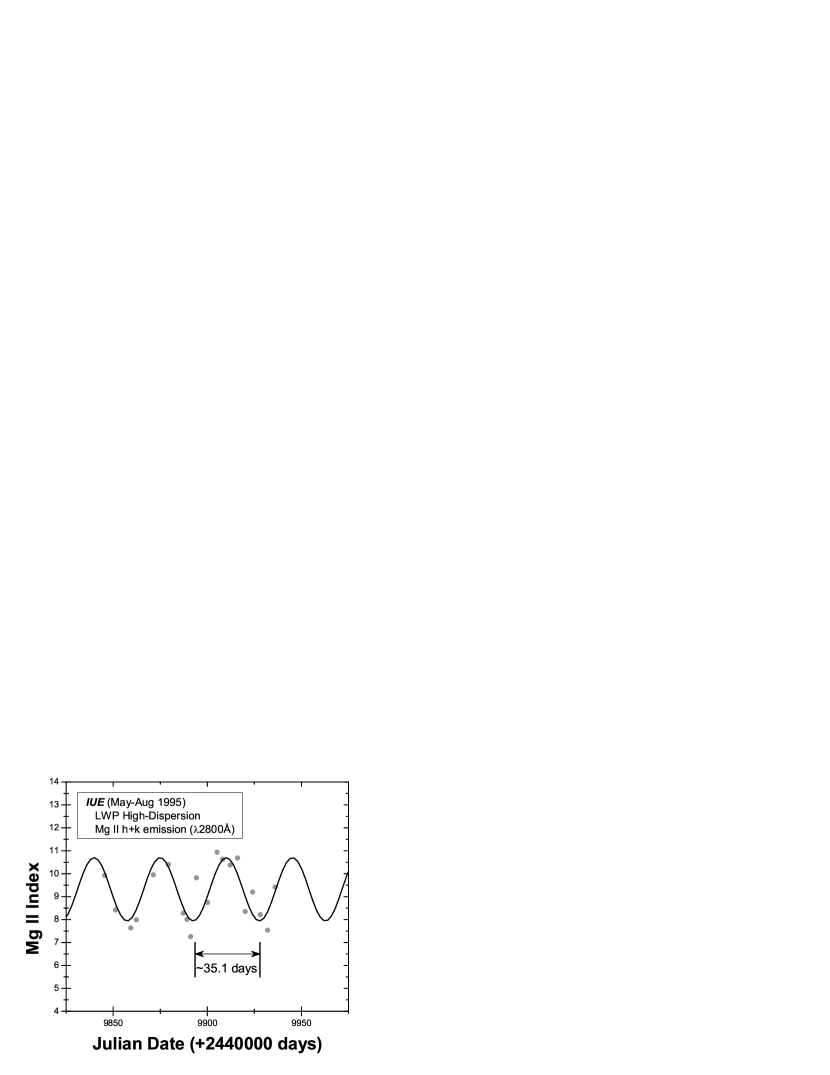
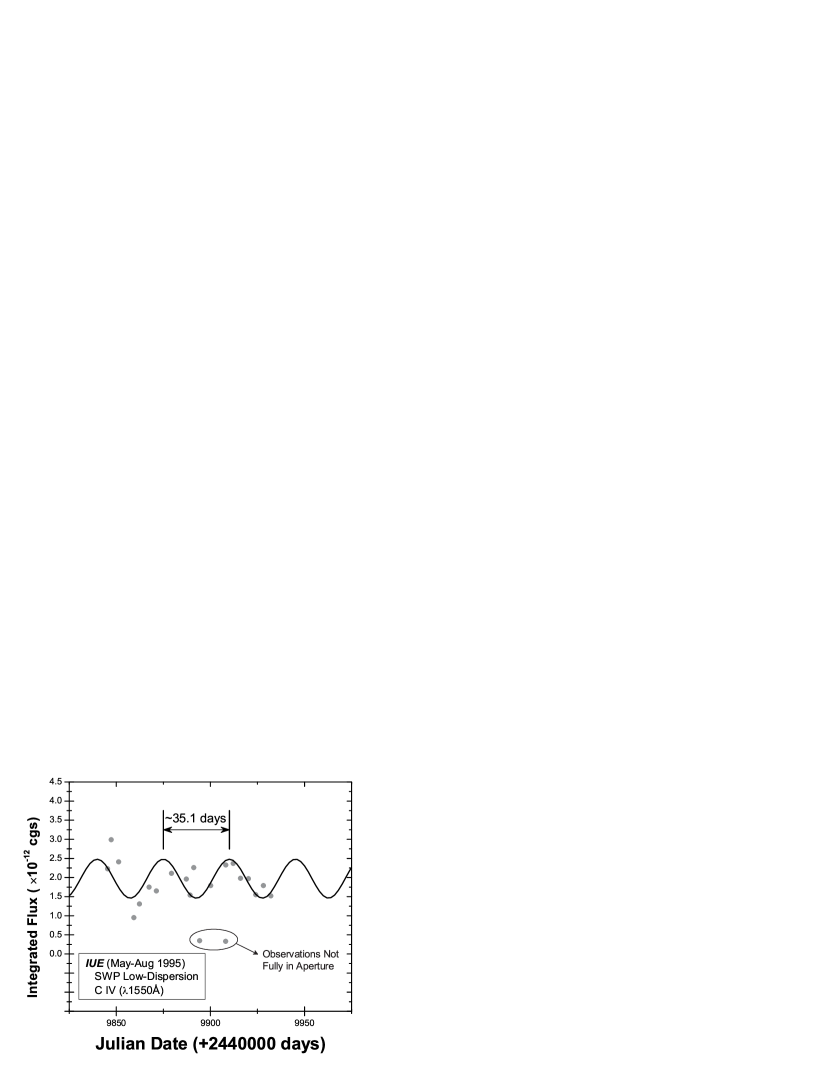
The last IUE campaign in 1995 provides us with appropriate data sets to search for Cen B’s rotation period, with sufficient observations of both Mg II h+k (20) and C IV (21) over the proper timeframe (90 days). These observations were carried out by two of us (E.F.G. and L.E.D.) as part of an IUE GO program. Additionally, we explored potentially viable sections in 1981 (Mg II) and 1983 (C IV).
These IUE datasets were analyzed using the same Lomb-Scargle method described above. In Figure 16, the FDR functions for both spectral features observed during the 1995 campaign, along with the two other epochs that might have contained, a priori, marginally sufficient data, are displayed. As is apparent, the 1995 Mg II h+k Index data indicate a Protation 35.1 day rotation period for Cen B with a high level of confidence (3% FDR). Due to the relatively broad nature of the FDR function, periods between about 31.1 and 39.9 days are plausible at the better than 20% FDR level. Though there is a higher degree of scatter (noise) within the data, the results of the analysis of the 1995 C IV flux variations substantively corroborate this 35.1 day rotation period, but with an expectedly higher predicted FDR. Figures 17 and 18 display the 1995 Mg II h+k Index and C IV emission flux data, respectively, overplotted with the appropriately modulated and phased light curve. Unfortunately, the 1981 and 1983 data sets were simply not adequately sampled, temporally, to derive any exacting rotation modulation information.
Previous spectroscopic determinations of the rotation rate of Cen B have been carried out by Jay et al. (1997; Protation = 36.9 days), and Buccino & Mauas (2008; 35.1 days). These two previous studies wholly utilize the 1995 IUE data set(s), but employ different data reduction techniques than this study. Both (thankfully!) arrive at essentially the same result as presented here. With regard to the possibility of spot (active region) creation/migration/destruction that may have occurred simultaneous to the observations, and/or the effects of differential rotation, the small differences between these rotation period values and that of the X-ray result above (Section 3.2; 37.8 days) must be considered negligible. Without prejudice to author or technique, the average rotation period of Cen B would therefore be Protation = 36.23 1.35 days.
As insightfully pointed out by the anonymous referee: Saar & Osten (1997) infer a rotation period of 42 days for Cen B using an empirical relationship between the ratio of the chromospheric emission of the Mt. Wilson Ca II HK line cores to total bolometric emission, R, and the Rossby number, R0, which is itself related to the rotation period of the star (see Noyes et al. 1984). The difference (14%) in the rotation period determined in this study and the estimate of Saar & Osten (1997) is likely in part due to intrinsic scatter in R at a given R0 (due to rotational modulation, activity cycles), plus problems in calibration of the R - R0 relationship, especially at low activity levels (Wright, 2004; Pace & Pasquini, 2004; Saffe et al., 2005; Saar, 2006). In particular, clear trends with metallicity are not included in the standard (Noyes et al., 1984) calibration (Wright, 2004; Saar, 2006). Cen B is rather metal rich, which pushes the inferred minimum R (and likely the whole calibration) to overly low values (Saar, 2006). With R too low (due to uncalibrated high metals), the Protation derived from R would be too large, as seen.
6. STATISTICAL TREATMENT OF PERIOD FDRs
To further address the robustness of the analytically derived Lomb-Scargle FDRs presented throughout this paper, Monte Carlo random permutation simulations (see, Dwass 1957) were carried out. Random permutation tests are restricted to cases where changing the temporal order of the data destroys the measured effect. In our case, power is the test statistic, since it is power that leads directly to the FDR value.
The technique involves randomly rearranging the data points, leaving the time spacing the same, rerunning the periodogram, and keeping track of the number of instances that the resultant power is greater than the original value. There are too many possible orderings to allow complete enumeration with the number of data points used in our respective period determinations, but fortunately, as pointed out by Dwass (1957), the Monte Carlo simulations are asymptotically equivalent to the full permutation test, provided the number of iterations is sufficiently large.
For our tests, the number of iterations was always N = 100,000. In all cases the resultant power frequency distributions were well represented with Gamma probability distributions that could be characterized by the standard shape (k) and scale () parameters, with a small offset (shift) along the power axis (X0). For these Gamma probability distribution, the mean power is then given by k+X0. The statistical p-value represents the fractional number of permutations that resulted in a greater power, and correspondingly better FDR. Therefore,
where cdf is the cumulative distribution function appropriate to the resultant Gamma probability distribution, evaluated at the desired power (minus X0). Shown in Figure 19 is the power frequency distribution for the 1995 IUE C IV data set (used for the determination of Cen B’s rotation rate), which incidentally has the highest (aka poorest) FDR reported in this study. As seen, the Monte Carlo random permutation test results in a “true” statistical FDR of 53%, compared to the 61% reported by Lomb-Scargle.
The results of all of the Monte Carlo simulations are shown in Table 9 along with the respective Lomb-Scargle FDR values. Note that the analytically determined values given by the Lomb-Scargle method appear to be comparable to the values given by the Monte Carlo simulations, but consistently overestimate the statistical FDRs.
7. CONCLUSIONS
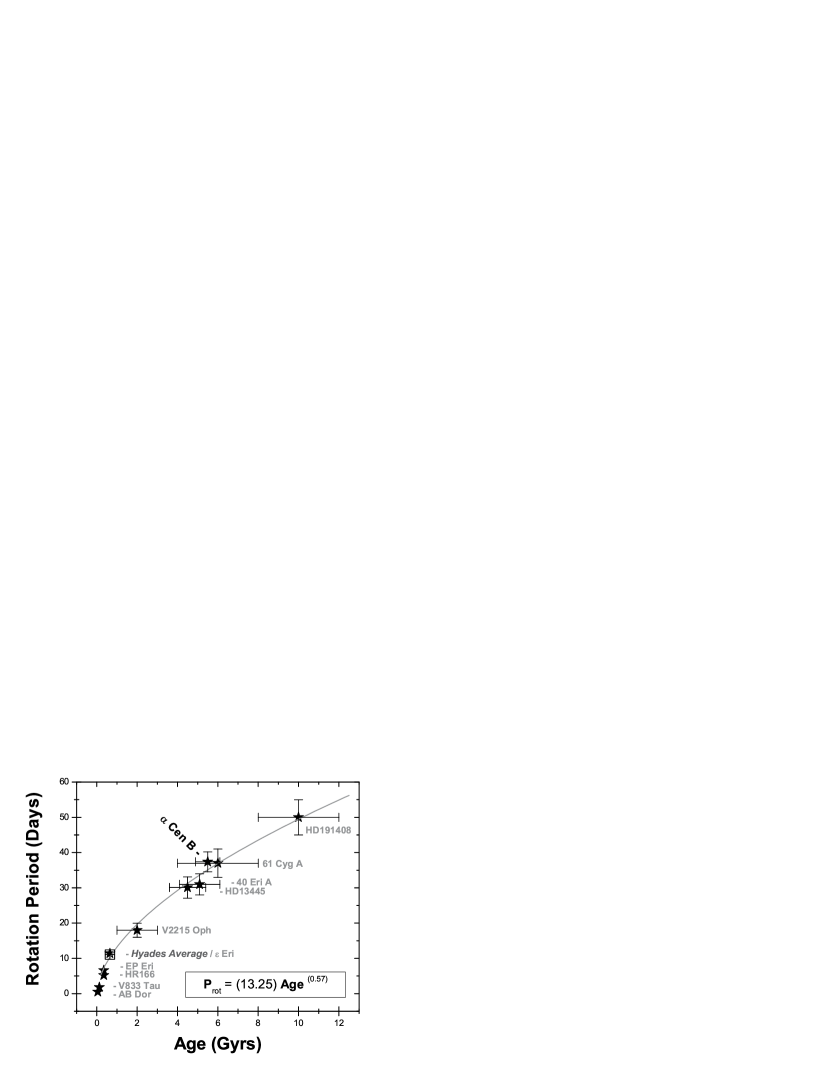
Independent analyses on the essentially complete sets of X-ray and FUV observations, along with the extensive IUE UV/NUV data sets, have yielded determinations of the long-term magnetic activity cycle length (Pcycle = 8.840.4 yr) and the rotation period (Protation = 36.21.4 days) of the nearby K dwarf, Cen B. Figure 20 places Cen B in context with the other stars in our dK star program (see also Table 1). We note that the rotation period result determined within this study agrees well with expectations for a typical 5.6 Gyr K1 V star.
References
- Acton (1996) Acton, L.W. 1996, in Cool Stars, Stellar Systems and the Sun (ASP Conf. Ser. 109), eds. R. Pallavicini and A.K. Dupree, 45
- Anosova et al. (1994) Anosova, J., Orlov, V.V., & Pavlova, N.A. 1994, A&A, 292, 115
- Ayres (1997) Ayres, T.R. 1993, PASP, 105, 538
- Ayres (1997) Ayres, T.R. 1997, J. Geophys. Res., 102, 1641
- Ayres (2009) Ayres, T.R. 2009, ApJ, 696, 1931
- Baliunas, et al. (1995) Baliunas, S.L., Donahue, R.A., Soon, W.H., Horne, J.,H., Frazer, J., Woodard-Eklund, L., Bradford, M., Rao, L.M., Wilson, O.C., Zhang, Q., Bennett, W., Briggs, J., Carroll, S.M., Duncan, D.K., Figueroa, D., Lanning, H.H., Misch, T., Mueller, J., Noyes, R.W., Poppe, D., Porter, A.C., Robinson, C.R., Russell, J., Shelton, J.C., Soyumer, T., Vaughan, A.H., & Whitney, J.H. 1995, ApJ, 438, 269
- Bean et al. (2006) Bean, J., McArthur, B.E., & Benedict, G.F. 2006, BAAS, 38, 932
- Benedict (2008) Benedict, G.F. 2008, BAAS, 40, 263
- Benedict et al. (2008) Benedict, G.F., McArthur, B.E., & Bean, J.L. 2008, in Proceedings of the International Astronomical Union, IAU Symposium, 248, 23
- Benedict et al. (1999) Benedict, G.F., McArthur, B., Chappell, D.W., Nelan, E., Jefferys, W.H., van Altena, W., Lee, J., Cornell, D., Shelus, P.J., Hemenway, P.D., Franz, O.G., Wasserman, L.H., Duncombe, R.L., Story, D., Whipple, A.L., & Fredrick, L.W. 1999, AJ, 118, 1086
- Benest (1988) Benest, D. 1988, A&A, 206, 143
- Bohlin et al. (1990) Bohlin, R.C., Harris, A.W., Holm, A.V., & Gry, C. 1990, ApJS, 73, 413
- Bonavita & Desidera (2007) Bonavita, M., & Desidera, S. 2007, A&A, 468, 721
- Buccino & Mauas (2008) Buccino, A.P., & Mauas, P.J.D. 2008, A&A, 483, 903
- Chmielewski et al. (1992) Chmielewski, Y., Friel, E., Cayrel de Strobel, G., & Bentolila, C. 1992 A&A, 263, 219
- Coughlin et al. (2010) Coughlin, J., Guinan, E.F., Engle, S.G., DeWarf, L., Hall, J.C., DePasquale, J., Thompson, R.R. 2010, BAAS, 42, 333
- Crawford et al. (1970) Crawford D.L., Barnes J.V., & Golson J.C. 1970, AJ, 75, 624
- Demarque et al. (1986) Demarque, P., Guenther, D.B., & van Altena, W.F. 1986, ApJ, 300, 773
- Dorren & Guinan (1994a) Dorren, J.D., & Guinan, E.F. 1994a, in The Sun as a Variable Star: Solar and Stellar Irradiance Variations (IAU Coll. 143), eds. J.M. Pap et al. (Cambridge: Cambridge University Press), 143, 206
- Dorren & Guinan (1994b) Dorren, J.D., & Guinan, E.F. 1994b, ApJ, 428, 805
- Dorren et al. (1994) Dorren, J.D., Guinan, E.F., & DeWarf, L.E. 1994, in Proc. Eighth Cambridge Workshop: Cool Stars, Stellar Systems, and the Sun, ed. J.-P. Caillault (Dordrecht: Kluwer), 64, 399
- Doyle et al. (1985) Doyle, J.G., Raymond, J.C., Noyes, R.W., & Kingston, A.E. 1985, ApJ, 297, 816
- Doyle et al. (2005) Doyle, M.T., O’Mara, B.J., Ross, J.E., & Bessell, M.S. 2005, Publications of the Astronomical Society of Australia, 22, 6
- Dupree et al. (1976) Dupree, A.K., Foukal, P.V., & Jordan, C. 1976, ApJ, 209, 621
- Dwass (1957) Dwass, M. 1957, Annals of Mathematical Statistics, 28, 181
- Eggen (1978a) Eggen, O.J. 1978a, ApJ, 226, 405
- Eggen (1978b) Eggen, O.J. 1978b, ApJS, 37, 251
- Eggen (1996) Eggen, O.J. 1996, AJ, 111, 466
- Eggenberger et al. (2004) Eggenberger, P., Charbonnel, C., Talon, S., Meynet, G., Maeder, A., Carrier, F., & Bourban, G. 2004, A&A, 417, 235
- Endl & Kürster (2008) Endl, M., & Kürster 2008, A&A, 488, 1149
- Endl et al. (2001) Endl, M., Kürster, M., Els, S., Hatzes, A.P., & Cochran, W.D. 2001, A&A, 374, 675
- Engle et al. (2009) Engle, S.G., Guinan, E.F., & Mizusawa, T. 2009, in Future Directions in Ultraviolet Spectroscopy: A Conference Inspired by the Accomplishments of the Far Ultraviolet Spectroscopic Explorer Mission (AIP Conf. Proc. 1135), 221
- Favata et al. (2008) Favata, F., Micela, G., Orlando, S., Schmitt, J.H.M.M., Sciortino, S., & Hall, J. 2008, A&A, 490, 1121
- Flannery & Ayres (1978) Flannery, B.P., & Ayres, T.R. 1978, ApJ, 221, 175
- Furenlid & Meylan (1990) Furenlid, I., & Meylan, T. 1990, ApJ, 350, 827
- Giménez (2000) Giménez, A. 2000, A&A, 356, 213
- Golub et al. (1982) Golub, L., Harnden, F.R., Jr., Pallavicini, R., Rosner, R., & Vaiana, G.S. 1982, ApJ, 253, 242
- Grießmeier et al. (2004) Grießmeier, J.-M., Stadelmann, A., Penz, T., Lammer, H., Selsis, F., Ribas, I., Guinan, E.F., Motschmann, U., Biernat, H.K., & Weiss, W.W. 2004, A&A, 425, 753
- Güdel et al. (1997) Güdel, M., Guinan, E.F., & Skinner, S.L. 1997, ApJ, 483, 947
- Güdel et al. (1998) Güdel, M., Guinan, E.F., & Skinner, S.L. 1998, in Cool Stars, Stellar Systems and the Sun (ASP Conf. Ser. 154), edss R.A. Donahue and J.A. Bookbinder, 1041
- Guedes et al. (2008) Guedes, J.M., Rivera, E.J., Davis, E., Laughlin, G., Quintana, E.V., & Fischer, D.A. 2008, ApJ, 679, 1582
- Guenther & Demarque (2000) Guenther, D. B., & Demarque, P. 2000, ApJ, 531, 503
- Guinan et al. (2009) Guinan, E.F., Engle, S.G., & DeWarf, L.E. 2009, in Future Directions in Ultraviolet Spectroscopy: A Conference Inspired by the Accomplishments of the Far Ultraviolet Spectroscopic Explorer Mission (AIP Conf. Proc. 1135), 244
- Guinan et al. (2003) Guinan, E.F., Ribas, I., & Harper, G.M. 2003, ApJ, 594, 561
- Haisch & Schmitt (1996) Haisch, B., & Schmitt, J.H.M.M. 1996, PASP, 108, 113
- Halliwell (1981) Halliwell, M. 1981, ApJS, 47, 243
- Hatzes et al. (1996) Hatzes, A.P., Kürster, M., Cochran, W.D., Dennerl, K., & Döbereiner, S. 1996, J. Geophys. Res., 101, 9285
- Hoffleit & Jaschek (1982) Hoffleit, D., & Jaschek, C. 1982, The Bright Star Catalogue, New Haven: Yale University Observatory (4th edition)
- Horne & Baliunas (1986) Horne, J.H., & Baliunas, S.L. 1986, ApJ, 302, 757
- Jay et al. (1997) Jay, J.E., Guinan, E.F., Morgan, N.D., Messina, S., & Jassour, D. 1997, BAAS, 29, 730
- Judge et al. (2003) Judge, P.G., Solomon, S.C., & Ayres, T.R. 2003, ApJ, 593, 534
- Kervella et al. (2003) Kervella, P., Thévenin, F., Segransan, D., Berthomieu, G., Lopez, B., Morel, P., & Provost, J. 2003, A&A, 404, 1087
- Komitov et al. (2010) Komitov, B., Duchlev, P., Stoychev, K., Dechev, M., & Koleva, K. 2010, arXiv:1008.0375v1 [astro-ph.SR]
- Kulikov et al. (2006) Kulikov, Y.N., Lammer, H., Lichtenegger, H.I.M., Terada, N., Ribas, I., Kolb, C., Langmayr, D., Lundin, R., Guinan, E.F., Barabash, S., & Biernat, H.K 2006, P&SS, 54, 1425
- Kürster et al. (1999) Kürster, M., Hatzes, A.P., Cochran, W.D., Döbereiner, S., Dennerl, K., & Endl, M. 1999, A&A, 344, L5
- Lammer et al. (2003a) Lammer, H., Lichtenegger, H.I.M., Kolb, C., Ribas, I., Guinan, E.F., Abart, R., & Bauer, S.J. 2003a, Icarus, 165, 9L
- Lammer et al. (2003b) Lammer, H., Selsis, F., Ribas, I., Guinan, E.F., Bauer, S.J., & Weiss, W.W. 2003b, ApJ, 598, 121L
- Lean (1991) Lean, J. 1991, Rev. Geophys, 29, 505
- Lean (1997) Lean, J. 1997, ARA&A, 35, 33
- Lomb (1976) Lomb, N.R. 1976, Ap&SS, 39, 447
- Massa & Fitzpatrick (2000) Massa, D., & Fitzpatrick, E.L. 2000, ApJS, 126, 517
- Micela & Marino (2003) Micela, G., & Marino, A. 2003, A&A, 404, 637
- Morel et al. (2000) Morel, P., Provost, J., Lebreton, Y., Th venin, F., & Berthomieu, G. 2000, A&A, 363, 675
- Murdoch et al. (1993) Murdoch, K.A., Hearnshaw, J.B., & Clark, M. 1993, ApJ, 413, 349
- Neuforge-Verheecke & Magain (1997) Neuforge-Verheecke, C., & Magain, P. 1997, A&A, 328, 261
- Noyes et al. (1984) Noyes, R.W., Hartmann, L.W., Baliunas, S.L., Duncan, D.K., & Vaughan, A.H. 1984, ApJ, 279, 763
- Noyes et al. (1985) Noyes, R.W., Raymond, J.C., Doyle, J.G., & Kingston, A.E. 1985, ApJ, 297, 805
- Orlando et al. (2001) Orlando, S., Peres, G., & Reale, F. 2001, ApJ, 560, 499
- Pace & Pasquini (2004) Pace, G., & Pasquini, L. 2004, A&A, 426, 1021
- Pallavicini et al. (1981) Pallavicini, R., Golub, L., Rosner, R., & Vaiana, G. 1981, Smithson. Astrophys. Obs., Spec. Rep., No. 392, Vol. II, p. 77
- The Hipparcos Catalog, Perryman et al. (1997) Perryman, M.A.C., Lindegren, L., Kovalevsky, J., Hog, E., Bastian, U., Bernacca, P.L., Creze, M., Donati, F., Grenon, M., Grewing, M., Van Leeuwen, F., Van Der Marel, H., Mignard, F., Murray, C.A., Le Poole, R.S., Schrijver, H., Turon, C., Arenau, F., Froeschle, M., & Petersen, C.S. 1997, A&A, 323, 49L (The Hipparcos Catalog)
- Pettersen (1980) Pettersen, B.R. 1980, A&A, 82, 53
- Porto de Mello et al. (2008) Porto de Mello, G.F., Lyra W., & Keller, G.R. 2008, A&A, 488, 653
- Pourbaix et al. (1999) Pourbaix, D., Neuforge-Verheecke, C., & Noels, A. 1999, A&A, 344, 172
- Pourbaix et al. (2002) Pourbaix, D., Nidever, D., McCarthy, C., Butler, R.P., Tinney, C.G., Marcy, G.W., Jones, H.R.A., Penny, A.J., Carter, B.D., Bouchy, F., Pepe, F., Hearnshaw, J.B., Skuljan, J., Ramm, D., & Kent, D. 2002, A&A, 386, 280
- Press & Rybicki (1989) Press, W.H., & Rybicki, G.B. 1989, ApJ, 338, 277
- Quintana et al. (2007) Quintana, E.V., Adams, F.C., Lissauer, J.J., & Chambers, J.E. 2007, ApJ, 660, 807
- Raassen et al. (2003) Raassen, A.J.J., Ness, J.-U., Mewe, R., van der Meer, R.L.J., Burwitz, V., & Kaastra, J.S. 2003, A&A, 400, 671
- Radick et al. (1987) Radick, R.R., Thompson, D.T., Lockwood, G.W., Duncan, D.K., & Baggett, W.E. 1987, ApJ, 321, 459
- Ribas et al. (2005) Ribas, I., Guinan, E.F., Güdel, M., & Audard, M. 2005, ApJ, 622, 680
- Robrade et al. (2005) Robrade, J., Schmitt, J.H.M.M., & Favata, F. 2005, A&A, 442, 315 (astro-ph/0508260)
- Robrade et al. (2007) Robrade, J., Schmitt, J.H.M.M., & Hempelmann, A. 2007, Memorie della Societa Astronomica Italiana, 78, 311
- Rutten & Schrijver (1987) Rutten, R.G.M., & Schrijver, C.J. 1987, A&A, 177, 155
- Saar (2006) Saar, S.H. 2006, American Astronomical Society, SPD Meeting #37, BAAS, 38, 240
- Saar & Osten (1997) Saar, S.H., & Osten, R.A. 1997, MNRAS, 284, 803
- Saffe et al. (2005) Saffe, C., Gómez, M., & Chavero, C. 2005, A&A, 443, 609
- Scargle (1982) Scargle, J.D. 1982, ApJ, 263, 835
- Schmitt (1997) Schmitt, J.H.M.M. 1997, A&A, 318, 215
- Schrijver (1983) Schrijver, C.J. 1983, A&A, 127, 289
- Ségransan et al. (2003) Ségransan, D., Kervella, P., Forveille, T., & Queloz, D. 2003, A&A, 397, L5
- Soederhjelm (1999) Soederhjelm, S. 1999, A&A, 341, 121
- Solanki et al. (2004) Solanki, S.K., Usoskin, I.G., Kromer, B., Schüssler, M., Beer, J. 2004, Nature, 431, 1084
- Thebault et al. (2009) Thebault, P., Marzari, F., & Scholl, H. 2009, MNRAS, 393, 21
- Thévenin et al. (2002) Thévenin, F., Provost, J., Morel, P., Berthomieu, G., Bouchy, F., & Carrier, F. 2002, A&A, 392, 9L
- Vaiana & Rosner (1978) Vaiana, G. S., & Rosner, R. 1978, ARA&A, 16, 393
- van Leeuwen (2007) van Leeuwen, F. 2007, Hipparcos, the New Reduction of the Raw Data, Astrophysics and Space Science Library, Vol. 350, (Dordrecht: Springer)
- Wiegert & Holman (1997) Wiegert, P.A., & Holman, M.J. 1997, AJ, 113, 1445
- Woods et al. (2005) Woods, T.N., Eparvier, F.G., Bailey, S.M., Chamberlin, P.C., Lean, J., Rottman, G.J., Solomon, S.C., Tobiska, W.K., & Woodraska, D.L. 2005, J. Geophys. Res., Volume 110, Issue A1, CiteID A01312
- Wright (2004) Wright, J.T. 2004, AJ, 128, 1273
- Wyatt et al. (2007) Wyatt, M.C., Clarke, C.J., & Greaves, J.S. 2007 MNRAS, 380, 1737
- Yildiz (2007) Yildiz, M. 2007, MNRAS, 374, 1264
- Yildiz (2008) Yildiz, M. 2008, MNRAS, 388, 1143

| Object | HD | Sp. | Dist. | Age | Age | |||
| Name | Number | Type | (mag) | (K) | (pc) | (days) | (Gyr) | Indicator |
| Sun 1 | G2 V | -26.74 | 5777 | 1 AU | 25.38 | 4.6 | Isotopic Dating | |
| AB Dor 1 | 36705 | K1 V | 6.93 | 5260 | 14.9 | 0.514 | 0.05 | AB Dor Moving Group |
| V833 Tau | 283750 | K2 V | 8.42 | 4600 | 17.9 | 1.81 | 0.13 | Pleiades Str |
| HR 08 | 166 | K0 V | 6.13 | 5400 | 13.7 | 5.2 | 0.35 | UMa Str |
| EP Eri | 17925 | K1 V | 6.03 | 5100 | 10.4 | 6.6 | 0.35 | UMa Str |
| Eri 1 | 22049 | K2 V | 3.73 | 5050 | 3.22 | 11.4 | 0.65 | Hyades Str |
| Hyades Average 2 | 11.071.54 | 0.65 | Hyades Str | |||||
| V2215 Oph | 156026 | K5 V | 6.34 | 4480 | 5.4 | 18 | 2.0 | Activity/Rotation Relation |
| 40 Eri A | 26965 | K1 V | 4.43 | 5300 | 5.04 | 313 | 5.1 | Age of WD Companion |
| HR 637 1 | 13445 | K1 V | 6.12 | 5240 | 10.9 | 30.1 | 4.5 | Age-Activity Relation |
| Cen B | 128621 | K1 V | 1.33 | 5316 | 1.347 | 36.231.35 | 5.60.6 | Isochrones of Cen A (Flannery & Ayres 1978) |
| 61 Cyg A | 201091 | K5 V | 5.22 | 4450 | 3.4 | 37 | 6.02 | 61 Cyg Moving Group (Eggen 1996) |
| HR 7703 | 191408 | K3 V | 5.31 | 4893 | 6.05 | 50 | 10.02 | HVel star (Old Disk) |
| Property | Sun | Cen A | Cen B | Cen C |
|---|---|---|---|---|
| (Sol) | HD 128620 | HD 128621 | (Proxima Cen) | |
| Spectral type | G2 V | G2 V | K1 V | dM5e |
| V aa Hoffleit & Jaschek 1982. | -26.74 | -0.01 | 1.33 | 11.05 |
| (B-V) aa Hoffleit & Jaschek 1982. | 0.648 | 0.71 | 0.88 | 1.97 |
| (b-y) bb Crawford et al. 1970 (A+B), Eggen 1978b (A,B). | 0.403 | 0.414 | 0.524 | |
| Temperature (K) cc Porto de Mello et al. 2008, cf Neuforge-Verheecke & Magain 1997; Morel et al. 2000 (A, B), and cf Ségransan et al. 2003 (C). | 5779 | 5847 | 5316 | 3050 |
| Fe/H dd Porto de Mello et al. 2008 (A, B); Pettersen 1980 (C). | 0.0 | 0.25 | 0.25 | (0.25) |
| Mass (M⊙) ee See Eggen 1978a; Halliwell 1981; Demarque et al. 1986; Anosova et al. 1994; Pourbaix et al. 2002; Yildiz 2008 (A, B), cf Ségransan et al. 2003 (C). | 1.00 | 1.09 | 0.90 | 0.123 |
| Radius (R⊙) ff Kervella et al. 2003 (A, B), Ségransan et al. 2003 (C). | 1.00 | 1.22 | 0.86 | 0.145 |
| Age (Gyr) gg See Flannery & Ayres 1978; Demarque et al. 1986; Guenther & Demarque 2000; Thévenin et al. 2002; Eggenberger et al. 2004; Yildiz 2007, 2008. | 4.58 | 5.6 | 5.6 | 5.6 |
| Prot (days) hh Equatorial (Sun), L.E. DeWarf, (2010, in preparation) (A), this study (B), Engle et al. 2009 (C). | 25.38 | 15 - 20 | 36.231.35 | 83.1 |
| Bandpass | Log LX,min | Log LX,max | Lmax/Lmin | Ref |
|---|---|---|---|---|
| (keV) | (erg s-1 | (erg s-1) | Ratio | |
| 0.15 - 4.0 | 26.0 | 27.4 | 25.1 | 1 |
| 0.15 - 4.0 | 27.0 | 28.0 | 10.0 | 2,3 |
| 0.15 - 4.0 | 27.2 | 27.8 | 4.0 | 4,5 |
| 0.04 - 12.4 | 25.5 | 27.0 | 31.6 | 6 |
| 0.1 - 4.0 | 25.6 | 27.1 | 32.6 | 7 |
| 0.1 - 2.4 | 26.7 | 27.3 | 4.0 | 8 |
| 0.2 - 2.0 | 26.8 | 27.4 | 4.0 | 9 |
| 0.1 - 2.4 | 26.0 | 27.7 | 50.0 | 10 |
| 0.1 - 2.4 | 26.8 | 27.9 | 12.6 | 11 |
| Object | HD | Observation | Aperture | Exposure |
| Name | Number | Date | (s) | |
| Cen A | HD 128620 | 2001 Jun 25 | MDRS | 15,332 |
| Cen B | HD 128621 | 2001 Jun 24 | MDRS | 22,742 |
| Cen A | HD 128620 | 2006 May 5 | MDRS | 12,606 |
| Cen B | HD 128621 | 2006 May 6 | MDRS | 9245 |
| Cen A+B | 2006 May 4 | LWRS | 5316 | |
| Cen A | HD 128620 | 2007 Jun 18 | MDRS | 13,289 |
| Cen B | HD 128621 | 2007 Jun 19 | MDRS | 3565 |
| Atomic | Wavelength | Integration Range | Integrated Emission Flux cc Integrated emission flux units: ( 10-11 erg cm-2 s-1). | ||
|---|---|---|---|---|---|
| Species | (Å) | (Å) | 2001.45 | 2006.34 | 2007.47 |
| C ii aa Individually combined flux values for the C ii doublet at 1036.337 and 1037.018Å. | 1036+7 | 1036.00 - 1037.25 | 1.170.68 | 0.49 | 0.330.02 |
| C iii | 977.020 | 976.50 - 977.50 | 4.120.34 | 1.700.37 | 2.090.68 |
| C iii bb Blended fluxes from C iii multiplet (six transitions) around 1176Å. | 1176 | 1174.50 - 1176.75 | 2.980.60 | 1.250.53 | 1.110.03 |
| O vi | 1031.925 | 1031.50 - 1032.50 | 4.150.76 | 1.470.49 | 1.410.29 |
| O vi | 1037.614 | 1037.25 - 1038.00 | 2.130.33 | 0.630.34 | 0.680.22 |
| Atomic | Wavelength | Temperature | Stellar | Integrated Emission Flux Ratios | |
|---|---|---|---|---|---|
| Species | (Å) | (K) | Region | (2001.45)/(2006.34) | (2001.45)/(2007.47) |
| C ii aa Individually combined fluxes from C ii doublet at 1036.337 and 1037.018Å. | 1036+7 | 20000 | Chromosphere/TR | 2.36 | 3.572.07 |
| C iii | 977.020 | 50000 | TR | 2.430.56 | 1.980.66 |
| C iii bb Blended fluxes from C iii multiplet (six transitions) around 1176Å. | 1176 | 50000 | TR | 2.381.12 | 2.680.55 |
| O vi | 1031.925 | 300000 | TR | 2.831.07 | 2.920.81 |
| O vi | 1037.614 | 300000 | TR | 3.371.90 | 3.121.12 |
| SWP LL a | Julian Date | Integrated CIV Flux | SWP LL a | Julian Date | Integrated CIV Flux | SWP LL a | Julian Date | Integrated CIV Flux |
|---|---|---|---|---|---|---|---|---|
| Seq. No. | (+2440000 days) | (10-12 cgs) | Seq. No. | (+2440000 days) | (10-12 cgs) | Seq. No. | (+2440000 days) | (10-12 cgs) |
| SWP02320 | 3737.959 | 1.53 | SWP19772 | 5445.297 | 1.51 | SWP38115 | 7925.409 | 1.15 |
| SWP09035 | 4377.873 | 1.64 | SWP19837 | 5452.462 | 1.82 | SWP39442 | 8115.062 | 1.40 |
| SWP09818 | 4468.679 | 0.44 | SWP19839 | 5452.522 | 1.13 | SWP40690 | 8283.598 | 0.84 |
| SWP09928 | 4479.767 | 1.21 | SWP19882 | 5457.317 | 0.68 | SWP42233 | 8481.140 | 1.23 |
| SWP10016 | 4488.001 | 0.83 | SWP19885 | 5457.411 | 1.54 | SWP54631 | 9845.357 | 2.23 |
| SWP10093 | 4495.008 | 1.19 | SWP19886 | 5457.437 | 1.32 | SWP54647 | 9847.250 | 2.99 |
| SWP10164 | 4500.007 | 0.14 | SWP19912 | 5461.205 | 1.55 | SWP54673 | 9851.222 | 2.41 |
| SWP10193 | 4503.913 | 1.26 | SWP19915 | 5461.315 | 1.53 | SWP54724 | 9859.348 | 0.95 |
| SWP10214 | 4507.016 | 0.95 | SWP19950 | 5465.213 | 1.49 | SWP54744 | 9862.267 | 1.31 |
| SWP13887 | 4729.243 | 1.10 | SWP19953 | 5465.326 | 1.34 | SWP54793 | 9867.384 | 1.75 |
| SWP13988 | 4742.330 | 1.27 | SWP20015 | 5472.325 | 0.88 | SWP54844 | 9871.317 | 1.65 |
| SWP14038 | 4748.399 | 0.89 | SWP20018 | 5472.429 | 1.81 | SWP54975 | 9879.303 | 2.11 |
| SWP14202 | 4762.165 | 2.47 | SWP20019 | 5472.456 | 1.37 | SWP55042 | 9887.234 | 1.96 |
| SWP14256 | 4770.169 | 0.49 | SWP20064 | 5479.397 | 1.34 | SWP55051 | 9889.205 | 1.54 |
| SWP14302 | 4778.165 | 1.29 | SWP20066 | 5479.468 | 0.97 | SWP55060 | 9891.155 | 2.26 |
| SWP16922 | 5097.375 | 2.35 | SWP20088 | 5483.311 | 1.06 | SWP55114 | 9894.225 | 0.35 |
| SWP16997 | 5109.428 | 1.07 | SWP20140 | 5489.344 | 1.42 | SWP55178 | 9900.169 | 1.79 |
| SWP17027 | 5113.416 | 1.12 | SWP20141 | 5489.371 | 1.34 | SWP55233 | 9908.106 | 0.33 |
| SWP17697 | 5197.129 | 1.54 | SWP28488 | 6596.263 | 2.51 | SWP55234 | 9908.166 | 2.33 |
| SWP19478 | 5411.515 | 3.03 | SWP28489 | 6596.291 | 1.80 | SWP55269 | 9912.140 | 2.37 |
| SWP19663 | 5431.350 | 0.86 | SWP30092 | 6809.515 | 2.12 | SWP55307 | 9915.995 | 1.98 |
| SWP19664 | 5431.378 | 1.23 | SWP30100 | 6810.569 | 3.13 | SWP55338 | 9920.172 | 1.97 |
| SWP19702 | 5435.459 | 0.48 | SWP35607 | 7579.908 | 1.99 | SWP55357 | 9924.103 | 1.55 |
| SWP19705 | 5435.543 | 1.44 | SWP35608 | 7579.934 | 1.29 | SWP55377 | 9928.172 | 1.79 |
| SWP19727 | 5439.473 | 1.26 | SWP36037 | 7636.431 | 1.52 | SWP55405 | 9932.069 | 1.52 |
| SWP19729 | 5439.536 | 1.14 | SWP36808 | 7746.006 | 0.05 |
| LWP/R HL a | Julian Date | Mg II h+k | LWP/R HL a | Julian Date | Mg II h+k | LWP/R HL a | Julian Date | Mg II h+k |
|---|---|---|---|---|---|---|---|---|
| Seq. No. | (+2440000 days) | Index | Seq. No. | (+2440000 days) | Index | Seq. No. | (+2440000 days) | Index |
| LWR02095 | 3737.873 | LWR12908 | 5059.353 | LWP30740 | 9859.341 | 7.63 | ||
| LWR02096 | 3737.898 | 8.96 | LWR12909 | 5059.384 | LWP30763 | 9862.311 | 7.99 | |
| LWR02097 | 3737.919 | LWR13193 | 5097.379 | 7.71 | LWP30835 | 9871.311 | 9.96 | |
| LWR08526 | 4468.691 | LWR13220 | 5100.398 | 9.50 | LWP30863 | 9879.299 | 10.40 | |
| LWR08640 | 4479.760 | 11.01 | LWR13221 | 5100.428 | LWP30916 | 9887.261 | 8.28 | |
| LWR08722 | 4487.996 | 9.32 | LWR13222 | 5100.463 | LWP30930 | 9889.233 | 8.00 | |
| LWR08778 | 4495.006 | 9.49 | LWR13277 | 5109.425 | 7.28 | LWP30940 | 9891.134 | 7.26 |
| LWR08830 | 4500.004 | 7.83 | LWR13303 | 5113.413 | 6.12 | LWP30946 | 9894.202 | 9.82 |
| LWR08858 | 4503.910 | 8.23 | LWR13958 | 5197.127 | LWP30962 | 9900.163 | 8.75 | |
| LWR08884 | 4507.013 | 8.83 | LWR15736 | 5439.566 | 7.17 | LWP31015 | 9905.220 | 10.94 |
| LWR10517 | 4729.239 | 8.67 | LWR15826 | 5452.553 | 7.55 | LWP31038 | 9908.159 | 10.63 |
| LWR10795 | 4762.162 | 8.81 | LWR16023 | 5483.308 | 6.93 | LWP31078 | 9912.134 | 10.38 |
| LWR10854 | 4770.166 | 6.88 | LWR16049 | 5486.227 | 7.75 | LWP31093 | 9916.022 | 10.69 |
| LWR10928 | 4778.162 | 8.00 | LWR16120 | 5496.172 | 7.78 | LWP31139 | 9920.166 | 8.35 |
| LWR11603 | 4870.114 | 7.98 | LWP09929 | 6809.583 | 7.83 | LWP31161 | 9924.096 | 9.20 |
| LWR11643 | 4878.035 | 9.32 | LWP15073 | 7579.762 | 9.13 | LWP31179 | 9928.164 | 8.22 |
| LWR11762 | 4890.068 | 8.90 | LWP15074 | 7579.795 | LWP31206 | 9932.061 | 7.54 | |
| LWR11803 | 4896.049 | 7.97 | LWP18561 | 8114.983 | 6.26 | LWP31240 | 9936.058 | 9.42 |
| LWR12906 | 5059.299 | 8.41 | LWP30640 | 9845.381 | 9.93 | |||
| LWR12907 | 5059.328 | 8.06 | LWP30691 | 9851.198 | 8.42 |
| Lomb-Scargle | Monte Carlo Permutation Test | |||||||
| Data Set | Period a | Power b | FDR c | k (shape) | (scale) | X0 | Mean d | p-value e |
| Long-term magnetic activity cycle | ||||||||
| X-ray | 3230 | 16.90 | 0 | 5.96 | 0.53 | 0.28 | 3.44 | 0 |
| C iv | 3230 | 7.75 | 3.8 | 5.17 | 0.62 | 0.46 | 3.69 | 1.14 |
| Mg ii | 3230 | 5.96 | 13.0 | 4.89 | 0.63 | 0.14 | 3.24 | 4.44 |
| Rotation modulation | ||||||||
| X-ray | 37.8 | 10.11 | 0.1 | 5.88 | 0.40 | 1.21 | 3.59 | 0 |
| C iv | 35.1 | 3.18 | 60.5 | 10.77 | 0.25 | 0.69 | 3.33 | 53.11 |
| Mg ii | 35.1 | 6.28 | 4.9 | 6.16 | 0.38 | 1.15 | 3.47 | 0.85 |