Quiet-Sun intensity contrasts in the near ultraviolet as measured from Sunrise
Abstract
We present high-resolution images of the Sun in the near ultraviolet spectral range between 214 nm and 397 nm as obtained from the first science flight of the 1-m Sunrise balloon-borne solar telescope. The quiet-Sun rms intensity contrasts found in this wavelength range are among the highest values ever obtained for quiet-Sun solar surface structures – up to 32.8 % at a wavelength of 214 nm. We compare with theoretical intensity contrasts obtained from numerical magneto-hydrodynamic simulations. For 388 nm and 312 nm the observations agree well with the numerical simulations whereas at shorter wavelengths discrepancies between observed and simulated contrasts remain.
Subject headings:
Sun: general — Sun: atmosphere — Sun: granulation1. Introduction
Quiet-Sun intensity fluctuations provide fundamental information on the thermal structure of the convective overshoot region at the solar surface. A large number of measurements of the quiet-Sun intensity fluctuations have been made in the visible spectral range, starting in the 1950s (Frenkiel & Schwarzschild, 1955) and reaching to comparisons between recent seeing-free observations from the Solar Optical Telescope (SOT) on the Hinode satellite, which provide contrast values comparable to those from state-of-the-art numerical simulations (e.g., Danilović et al., 2008; Mathew et al., 2009; Wedemeyer-Böhm & Rouppe van der Voort, 2009). Overviews of the results of former measurements are given by Beckers & Parnell (1969) and Sánchez Cuberes et al. (2000). Although many intensity contrast measurements are based on data obtained after careful correction of atmospheric and/or instrumental effects, it turns out that insufficient knowledge of optical aberrations and straylight still are the major obstacles for accurate contrast measurements.
In the near ultraviolet (NUV), the intensity fluctuations of the solar surface region have been hitherto largely unknown, owing to the lack of reliable imaging data. The strong dependence of the Planck function in the NUV to the temperature makes the intensity highly sensitive to temperature fluctuations. Therefore, intensity contrasts also represent important diagnostics to probe the validity of numerical simulations of convection at granular scales.
From an observational point of view, it is well known that seeing effects and straylight contributions increase towards shorter wavelengths. Ground-based NUV observations are, additionally, hampered by strong atmospheric absorption (mainly by stratospheric ozone). Below the atmospheric cut-off at about 315 nm (see Gandorfer, 2005), observations cannot be carried out from the ground.
In the present study we show for the first time high-resolution imaging data and intensity fluctuations in the NUV region down to 214 nm. These data were obtained during the first science flight of the balloon-borne 1-m Sunrise observatory (see Barthol et al., 2010; Martínez Pillet et al., 2010; Berkefeld et al., 2010; Solanki et al., 2010). We present disk-center quiet-Sun NUV intensity contrasts obtained with the Sunrise Filter Imager (SuFI, see Gandorfer et al., 2010) onboard Sunrise.
2. Observations
The first science flight of the balloon-borne Sunrise telescope was carried out between June 8 and June 13, 2009, from Kiruna, Sweden, to Somerset Island, Canada. The average cruise altitude was about 36 km, i.e., at the upper boundary of the stratospheric ozone layer, so that high resolution images in the NUV could be obtained. The spectral regions observed by SuFI are 214 nm, 300 nm, 312 nm (close to the bandhead of the OH molecule), 388 nm (bandhead of the CN molecule), and 396.8 nm (Ca II line core). The widths (FWHM) of the corresponding SuFI filters are 10 nm, 5 nm, 1.2 nm, 0.8 nm, and 0.18 nm, respectively. The passbands within CN and OH bandheads were selected because of their high temperature sensitivity, especially UV OH lines which are favorable for imaging of both the quiet photosphere and sunspots (Berdyugina et al., 2003). The filters are mounted in a filter wheel that allows for sequential observations of the five wavelength channels.
SuFI is equipped with a 2k 2k CCD detector (PixelVision BioXight) at an effective focal length of 121 m. The camera pixel pitch is 12 m corresponding to (at 300 nm) on the sky. For post-facto correction of low-order optical aberrations by means of phase-diversity wavefront sensing (PD), SuFI was equipped with a device providing a focussed and a defocussed image, each on one half of the detector. The effective field of view (FOV) is thus limited to about .
The exposure times for the SuFI observations were strongly wavelength-dependent and ranged from 75 ms in the CN channel up to 30 s in the 214 nm channel. In this latter channel, the intensity level was high enough for detection only around maximum solar elevation and maximum balloon altitude. Therefore, observations in the 214 nm channel were only carried out around local noon.
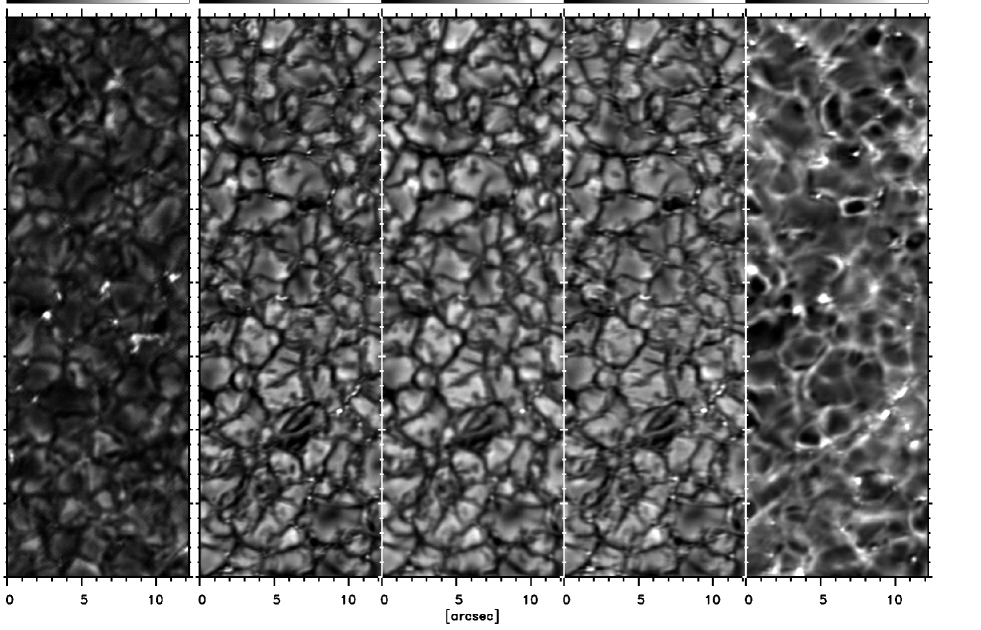
Here we show data obtained on June 11, 2009, between 20:00 UT and 21:00 UT (300 nm, 312 nm, 388 nm, and 397 nm) and on June 9, 2009, between 14:00 UT and 15:00 UT (all SuFI channels). Examples of single images obtained in the 5 SuFI wavelength channels are shown in Fig. 1.
3. Data analysis
The raw (“level 0”) SuFI images were corrected for dark and flat fields. Dedicated flat-field images were obtained by moving the telescope during exposure. For flat field correction of the science images accumulations of all flat-field and science images obtained in an interval of hours around the observation time were used. In addition, clusters of bad detector pixels were eliminated by applying a local median filter. Residual inhomogeneities originating from scratches at the entrance window of the SuFI camera were removed by local smoothing using low-pass filters.
The flat- and dark-field corrected SuFI images (henceforth labelled as “level 1” data) were reconstructed by means of a PD algorithm. We used a PD code originally described by Löfdahl & Scharmer (1994) and further developed as described by Bonet et al. (2004) and Vargas Domínguez (2008). In order to optimize the reconstruction of the SuFI data, several additional features were included, which will be described together with a performance study of the new PD code in a forthcoming publication (Hirzberger et al., 2010, in prep.).
In contrast to ground-based observations, the contribution of atmospheric influences to the total wavefront aberrations at balloon altitudes is small compared to instrumental effects. Therefore, we expect isoplanatic conditions, i.e. constant wavefront aberration across the SuFI FOV. Temporal variations of the wavefront deformations are assumed to arise only from changes of the instrument’s temperatures and from slowly varying mechanical deformations, which both are mainly correlated with the solar elevation. These assumptions allow a homogeneous reconstruction of the SuFI images. We thus included a procedure, which permits averaging the fitted Zernike coefficients across the entire FOV as well as over all images within a certain time span (usually one hour). Subsequently, all images taken during this time span were reconstructed with constant and highly reliable wavefront errors. PD reconstruction of individual images is, henceforth, denoted as “level 2” reduction, while images reconstructed with averaged wavefront errors are labelled as “level 3”.
4. Results
4.1. Disk-center intensity contrasts
The quiet-Sun disk-center rms intensity contrasts, , derived from the data obtained on June 11, 2009 are plotted in Fig. 2. In each spectral channel, for 180 consecutive images (approximately 24 min) the image stabilization system (Sunrise Correlating Wavefront Sensor, CWS; see Berkefeld et al., 2010) was locking in closed loop. The obtained intensity contrasts show considerable temporal fluctuations which are partially caused by the evolution of the solar structures and p-modes but also by a variation of the image quality. The image quality is affected, first, by the limited overall stability given by the gondola pointing and the image stabilization in presence of wind gusts and vibrations (Berkefeld et al., 2010), and, secondly, by residual artifacts, such as scratches and bad pixels in the level-1 images (see Sect. 3), which are amplified by the PD reconstruction. After visual inspection, the influence of the latter is considered to be negligible in the data presented here.
In addition to the temporal fluctuations, a rather constant offset of approximately % (depending on wavelength) of the intensity contrasts from level-2 to level-3 data is evident. This offset is expected since for the level-2 data always the local best fits to the wavefront aberrations are used for reconstruction (which also may cause local over-reconstructions), whereas the averaged wavefronts used for reconstructing the level-3 data may locally underestimate the wavefront errors (e.g. due to a small amount of anisoplanatism).
Irrespective of the effect of the image processing methods, the photospheric intensity contrasts shown in Fig. 2 are among the highest quiet-Sun contrasts ever measured. The contrast variations within the time series are to a lesser extent related to granular evolution than to the varying image quality due to residual pointing errors. This sometimes leads to artifacts due to local over-reconstruction and thus to unrealistically high contrast values. In the majority of images this effect, however, tends to result in reduced intensity contrasts (by smearing out solar surface structures). In order to allow for this systematic reduction of contrasts and to clip outliers, we consider the “mean-plus-one-sigma” values, , as reliable maximum contrast measurements. Here, denotes the temporally averaged rms contrast and denotes the corresponding standard deviation. The mean-plus-one-sigma values are overplotted in Fig. 2 and given in Tab. 1.
Figure 3 shows the intensity contrasts of 15 images from the 214 nm and 300 nm channels of the June 9 data. As a result of the long exposure time at 214 nm, the number of reliable images obtained during the observing period is limited to that small number. The mean-plus-one-sigma rms contrasts of the June 11 data are marked by arrows. Due to higher residual pointing errors, which caused some smearing of the images, the June 9 data are of slightly worse quality than the June 11 data. This particularly affects the 214 nm data. Nevertheless, the obtained intensity contrasts in the 214 nm channel are the highest photospheric quiet-Sun contrasts ever measured.
4.2. Intensity contrasts from simulations
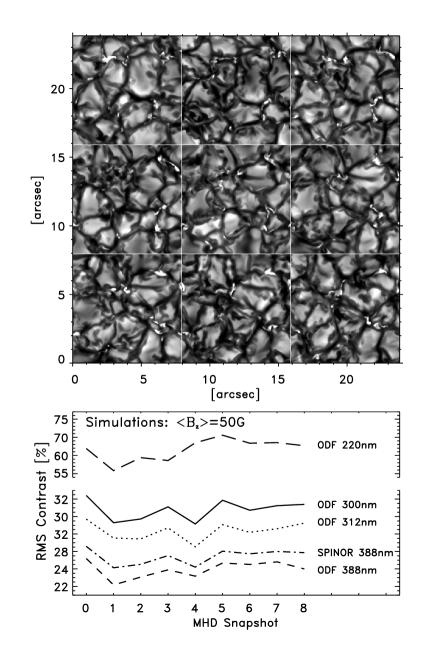
In order to compare with the measured intensity contrasts, we have calculated NUV intensity maps from numerical magneto-hydrodynamic (MHD) simulations of the quiet solar photosphere (Vögler et al., 2005). We used snapshots from a simulation run with a mean vertical magnetic field strength of = 50 G and a horizontal cell size of 20.8 km. The intensity maps were calculated by using the spectral synthesis code ATLAS9 (Kurucz, 1993) which specifies the opacity distribution functions (ODFs, Strom & Kurucz, 1966) in the SuFI 300 nm, 312 nm, and 388 nm channels. With the current implementation for computing ODFs, we are unable to calculate reliable intensities below a wavelength of 220 nm. In order to estimate the simulated contrast at 214 nm, we tentatively applied the ODF for 220 nm to the MHD snapshots. In addition, in the SuFI 388 nm channel a full spectral synthesis with the SPINOR code (Solanki, 1987; Frutiger et al., 2000; Berdyugina et al., 2003), including all available atomic and molecular line parameters within the SuFI 388 nm spectral bandpass have been performed.
Nine synthetic intensity images at 300 nm and the corresponding for all SuFI channels are shown in Fig. 4. Owing to the small area (6 Mm Mm) of the MHD box, the simulated contrasts show a temporal variation with a standard deviation of about 1 % (except for the 220 nm spectral region where the value is about 3 %). The contrasts obtained with SPINOR in the 388 nm channel are consistently about 1.3 % higher than those obtained by using ODFs. This small difference, comparable to the temporal variation of , indicates that the ODF-based spectral synthesis in the other spectral channels may not be completely unrealistic, although NLTE effects have not been taken into account. The mean contrasts obtained from the MHD simulations are also given in Tab. 1.
5. Discussion and conclusions
The NUV intensity contrasts obtained from Sunrise/SuFI data are systematically lower than the values from MHD simulations by several percent (but nearly a factor of two at 214 nm). Since the spatial resolution of both datasets is similar and because the instrumental aberrations have been removed by means of PD reconstruction, three possible sources for the discrepancy remain: (i) inaccurate physics in the simulations, (ii) omission of NLTE effects in the intensity calculations, (iii) scattered light. Before we can estimate the importance of NLTE effects or the need to improve the simulations, we need to judge the influence of scattered light on the measured contrasts.
The amount of scattered light in the SuFI data has not yet been fully assessed. A first estimate for the 300 nm, 312 nm and 388 nm SuFI channels was derived from limb observations. The straylight components of the modulation transfer function obtained from limb profiles at the different wavelengths were applied to the numerical simulations to estimate the effect of straylight on the rms intensity contrasts (see Tab. 1; details will be presented by Feller et al. (2010, in prep.)). For 214 nm and 397 nm we were not able, yet, to obtain a straylight estimate due to the lack of limb observations (214 nm) and due to the ubiquitous presence of spicules (397 nm). At 312 nm and 388 nm, the synthetic images after stray light contamination display contrast values that lie between the level-2 and the level-3 data. At these wavelengths, the simulations thus give results consistent with the measurements. At 300 nm the simulations give a value of 25.5 % that is still 1.3 % higher than the 24.2 % obtained from the level-2 data.
Estimates of scattered light contributions in (also seeing free) data obtained with Hinode/SOT were carried out by Mathew et al. (2009) and Wedemeyer-Böhm & Rouppe van der Voort (2009). They found a significant increase of the intensity contrasts in the visible Hinode channels, after deconvolving with point-spread functions for scattered light. For the 388 nm spectral region Mathew et al. (2009) found a quiet-Sun intensity contrast of 21.8 % after removing scattered light, which is very similar to the mean-plus-one-sigma value of our level-2 data from June 11, 2009 (cf. Tab. 1). Therefore, we conclude that after applying straylight correction to the SuFI-388 nm data, the obtained contrasts will exceed those obtained by Mathew et al. (2009) from Hinode data and will be comparable to synthetic contrasts achieved from MHD data.
The consistency between the measured and the numerically simulated contrasts indicates that the temperature fluctuations in the lower photosphere are correctly described by the hydrodynamical simulations, which predict values of between 2 % and 5 % on surfaces of constant optical depth (at 500 nm) between and . Taken together with the reproduction of shifts and asymmetries of spectral lines (e.g. Nordlund et al., 2009) and inverse granulation (Cheung et al., 2007) by simulation results, our contrast data thus provide evidence for an extension of the convective overshoot to a height of roughly 300 km above the average level of optical depth unity, at which height the rms fluctuations of the vertical velocity reach a local minimum after a steep decrease (by about a factor of 4) from their maximum slightly below the visible surface (optical depth unity).
Direct translation of rms contrasts into e.g. temperature stratification of the solar photosphere can be carried out only by means of simplified models estimating the brightness temperature of atmospheric features (e.g. Solanki & Unruh, 1998; Sobotka et al., 2000). In the NUV the rms intensity contrast of broad band images as obtained with Sunrise/SuFI is, however, only partly a function of height. It depends just as much on the temperature sensitivity of the Planck function and of the lines in the SuFI passbands, the atomic species, ionization stages and in the case of molecular transitions, the dissociation energy of the molecules.
In summary, we conclude that the data obtained from the first science flight of Sunrise/SuFI are of resounding quality. They show the highest quiet-Sun photospheric intensity contrasts ever measured, even without correcting for scattered light.
| June 9 | June 11 | MHD | MHD straylight | |||||
|---|---|---|---|---|---|---|---|---|
| level 2 | level 3 | level 2 | level 3 | ODF | SPINOR | ODF | SPINOR | |
| 214 | 32.79 () | 27.78 () | - | - | 61.27∗ | - | - | - |
| 300 | 22.23 () | 20.03 () | 24.19 () | 21.67 () | 30.76 | - | 25.50 | |
| 312 | 21.91 () | 19.45 () | 23.81 () | 20.40 () | 28.34 | - | 22.03 | - |
| 388 | 19.16 () | 17.27 () | 21.52 () | 18.05 () | 23.94 | 25.27 | 18.60 | 19.93 |
| 397 | 22.64 () | 20.11 () | 25.56 () | 22.22 () | - | - | - | - |
∗Mean at 220 nm.


References
- Barthol et al. (2010) Barthol, P., Gandorfer, A., Solanki, S.K., Schüssler, M., Chares, B., et al. 2010 (submitted to Solar Phys.)
- Beckers & Parnell (1969) Beckers, J.M. & Parnell, R.L. 1969, Solar Phys., 9, 39
- Berdyugina et al. (2003) Berdyugina S.V., Solanki S.K., Frutiger C. 2003, A&A, 412, 513
- Berkefeld et al. (2010) Berkefeld, T., Bell, A., Doerr, H.P., Feger, B., Friedlein, R., et. al. 2010, (submitted to Solar Phys.)
- Bonet et al. (2004) Bonet, J.A., Márquez, I., Muller, R., Sobotka, M., & Tritschler, A. 2004, A&A, 423, 737
- Cheung et al. (2007) Cheung, M.C.M., Schüssler, M., & Moreno Insertis, F. 2007, A&A, 461, 1163
- Danilović et al. (2008) Danilović, S., Gandorfer, A., Schüssler, M., Solanki, S.K., Vögler, A., Katsukawa, Y., & Tsuneta, S. 2008, A&A, 484, L17
- Feller et al. (2010) Feller, A., Hirzberger, J., Riethmüller, T.L., Gandorfer, A., et al. 2010 (in prep.)
- Frenkiel & Schwarzschild (1955) Frenkiel, F.N. & Schwarzschild, M. 1955, ApJ, 121, 216
- Frutiger et al. (2000) Frutiger, C., Solanki, S.K., Fligge, M., & Bruls, J.H.M.J. 2000, A&A, 358, 1109
- Gandorfer (2005) Gandorfer, A. 2005,The second Solar spectrum: A high spectral resolution polarimetric survey of scattering polarization at the solar limb in graphical representation. Volume III: 3160 Å to 3915 Å, vdf, Zürich
- Gandorfer et al. (2010) Gandorfer, A., Grauf, B., Barthol, P., Riethmüller, T.L., Solanki, S.K., et al. 2010, Solar Phys. (in press)
- Hirzberger et al. (2010) Hirzberger, J., Feller, A., Riethmüller, T.L., Gandorfer, A., Solanki, S.K. 2010 (in prep.)
- Kurucz (1993) Kurucz, R. 1993, ATLAS9 Stellar Atmosphere Programs and 2 km/s grid, Kurucz CD-ROM No. 13, Smithsonian Astrophysical Observatory, Cambridge, Mass.
- Löfdahl & Scharmer (1994) Löfdahl, M.G. & Scharmer, G.B. 1994, A&AS, 107, 243
- Mathew et al. (2009) Mathew, S.K., Zakharov, V., & Solanki, S.K. 2009, A&A, 501, L19
- Martínez Pillet et al. (2010) Martínez Pillet, V., del Toro Iniesta, J.C., Alvarez-Herrero, A., Domingo, V., Bonet Navarro, J.A., et al. 2010 (submitted to Solar Phys.)
- Nordlund et al. (2009) Nordlund, Å., Stein, R.F., & Asplund, M. 2009, LRSP, 6, 2
- Sánchez Cuberes et al. (2000) Sánchez Cuberes, M., Bonet, J.A., & Vázquez, M. 2000, ApJ 538, 940
- Sobotka et al. (2000) Sobotka, M., Vázquez, M., Sánches Cuberes, M., Bonet, J.A., & Hanslmeier, A. 2000, 544, 1155
- Solanki (1987) Solanki, S.K. 1987, Ph.D, Thesis, ETH Zürich
- Solanki & Unruh (1998) Solanki, S.K. & Unruh, Y. 1998, A&A, 335, 709
- Solanki et al. (2010) Solanki, S.K., Barthol, P., Danilović, S., Feller, A., Gandorfer, A., et al. 2010, ApJL, (in press)
- Strom & Kurucz (1966) Strom, S. E., & Kurucz, R. 1966, AJ, 71, 181
- Vargas Domínguez (2008) Vargas Domínguez, S. 2008. Ph.D. thesis, Instituto de Astrofísica de Canarias, La Laguna
- Vögler et al. (2005) Vögler, A., Shelyag, S., Schüssler, M., Cattaneo, F., Emonet, T., & Linde, T. 2005, A&A, 429, 335
- Wedemeyer-Böhm & Rouppe van der Voort (2009) Wedemeyer-Böhm, S. & Rouppe van der Voort, L. 2009, A&A, 503, 225