Hadron transverse momentum distributions and TMD studies
Abstract
Charged hadron differential distributions from muon-induced deep inelastic scattering, DIS, on a 6LiD target are presented as function of the DIS variables , , and the hadron variables and . They can be used as benchmark to verify the reliability of theoretical model. The distributions are fitted with a Gaussian function at different kinematic intervals. With a Gaussian ansatz for the transverse momentum dependent parton distributions, TMDs, the intrinsic transverse momentum of the partons is extracted.
1 Introduction
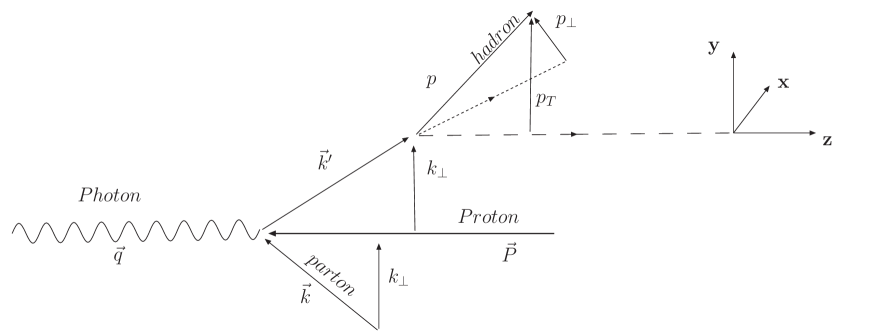
Semi Inclusive Deep Inelastic Scattering (SIDIS) reactions provide much information about the structure of the nucleon and the hadronization of partons. Parton intrinsic transverse momentum affects the transverse momentum of the produced hadron. The kinematic variables of the produced hadron are shown in figure 1, where the transverse momentum is determined w.r.t. the virtual photon. The transverse momentum distributions from unpolarized scattering are often the first verification of the reliability of a theoretical model. The shape of the distributions depends on many effects, e.g. contribution from intrinsic transverse momentum to the TMDs and transverse momentum of hadron to the fragmentation functions (FFs) and gluon radiation. These effects depend on kinematic variables such as the Bjorken variable , the invariant mass squared of the hadronic system, the negative 4-momentum squared of the virtual photon and the virtual photon energy fraction carried by the hadron. After integrating over the azimuthal angles, four variables are needed to describe the kinematics of the measured hadron: two inclusive (, ) and two hadronic (, ).
2 The COMPASS Experiment
The COMPASS experiment has been set up at the M2 muon beam line of the CERN SPS [1]. Polarized 160 GeV muons with an intensity of s spill and a polarization of 80% are scattered off a polarized 6LiD target. The target consists of two cells of opposite polarization which was reversed every 8 h. The unpolarized sample is therefore the combination of the data from the two cells. The COMPASS spectrometer is a large acceptance two-stage spectrometer which covers the kinematic range from quasi-real photo production to the DIS region. Both stages use hadron calorimeters and absorber walls for muon identification. The data presented here were taken during the year of 2004.
3 Hadron kinematic distributions
The charged hadron identification is kept as as simple as possible.
The particles coming out of the primary vertex are either identified as hadron or muons.
From these hadrons, the selection requires that they create signals in the detector situated upstream and downstream of the first magnet.
This ensures that the track momentum and charge are well defined by the bending of the magnetic field.
The COMPASS ability to identify hadrons, with a RICH detector, was not used, but is intended for further analysis.
In order to correct for event losses caused by the non-uniform acceptance of the COMPASS spectrometer,
a full Monte Carlo (MC) simulation has been performed.
The events were generated with LEPTO, transported through the COMPASS detector simulation program COMGEANT
and the reconstruction software CORAL.
From this MC sample, 4-dimensional acceptance tables have been determined.
Although very similar, positive and negative hadrons have different tables.
The systematic error has been estimated to 5%. Only statistical errors are shown in the figures.
In this analysis, the hadrons are separated into 23 intervals in (from 1 to 10 GeV/c2) and (from 0.004 to 0.12)
further subdivided into 8 intervals in (from 0.2 to 0.8).
4 Results
Hadron muoproduction has been studied for many years and the EMC experiment [5] covered a similar kinematic range as COMPASS.
An interesting comparison with previous data is the ratio of positive and negative hadrons because the acceptance is canceled to a good approximation.
The hadron multiplicity ratios are shown in figure 2.
COMPASS results show clearly the and -dependence,
where the fraction of positive hadrons increases with (getting closer to the valence region) and (more related to the struck parton).
This agrees with the model of valence quarks where the positive quarks have a higher electric charge.
4.1 distributions
According to [4], the average over all should depend linearly on the center of mass energy squared, . They have verified their prediction with results from three fixed target experiments: JLab, HERMES and COMPASS. The value used for COMPASS was not corrected for acceptance, the value is corrected here as shown in figure 3. The authors of [4] note that the average should depend linearly on rather than . The dependence is shown in figure 4 which is more compatible with a linear dependence on than on . The relation is not well established and, as mentioned in [4], the linear dependence on for Drell-Yan which inspired their SIDIS prediction, could also be a linear dependence on . Figure 4 suggests the latter is more accurate.
4.2 Gaussian fit of the distributions and intrinsic transverse momentum
Using the Gaussian ansatz which assumes a Gaussian distribution of the intrinsic transverse momentum and of the transverse momentum acquired during fragmentation, the cross section is proportional to (cf. [2]):
| (1) |
where
| (2) |
The functions and are the usual (integrated) distribution and fragmentation functions, respectively.
The distributions and fits for two (, ) intervals and for all intervals are shown in figure 5.
The fit is performed on the low interval [0.1, 0.85] GeV/c in order to stay away from pQCD effect.
The fitted as function of are shown in figure 6 for low and high .
A similar behavior was already observed by HERMES in [6] for the average (not from a fit but from a standard average).
It is interesting to compare the average from the previous section (figure 4)
with the fitted for the middle shown in figure 7.
Contrary to the average aver all , there is no clear -dependence of the fitted
(for 0.10.85 GeV/c) which is suppose to be unaffected by pQCD.
The -dependence of the fitted is of particular interest because of its relation to the intrinsic transverse momentum through equation (2). The fitted for different for two (, ) intervals are shown in figure 8. The relation between and is certainly not linear as in equation (2). If a -dependence of the transverse momentum acquired during fragmentation, , is added such that
| (3) |
where and , the relation can be nicely fitted as shown in figure 8.
From this fit, the intrinsic momentum, , for various (, ) intervals can be extracted. The extracted as function of are shown in figure 9 and as function of , comparing results from positive and negative hadrons, are shown in 10.
5 Conclusion
The differential distributions of charged hadrons produced by muons scattered off a 6LiD target have been determined for various kinematic intervals.
The low have been fitted with a Gaussian at different
such that the intrinsic transverse momentum could be extracted in the framework of the Gaussian ansatz.
The non linear relation between the fitted and have been reproduced
by adding a z-dependence of the transverse momentum acquired during fragmentation.
The extracted shows a clear dependence on and a possible dependence on ,
although less conspicuous for higher , where the framework is more reliable.
Also, is systematically higher for positive hadrons compared to negative hadrons.
This suggests a flavor dependence of the intrinsic transverse momentum.
This behavior could be further investigated using COMPASS ability to identify hadrons;
kaon identification could provide access to characteristics of the strange quark TMDs.
Acknowledgment
I would like to thank Dr. Alessandro Bacchetta for his helpful comments.
References
- [1] Abbon, P. and others, Nucl. Instrum. Meth.A577, (2007) 455-518
- [2] Anselmino, M. and others, Phys. Rev. D71, (2005) 074006
- [3] Anselmino, M. and Boglione, M. and Prokudin, A. and Turk, C., Eur. Phys. J. A31, (2007) 373-381
- [4] Schweitzer, P. and Teckentrup, T. and Metz, A., Phys. Rev. D81, (2010) 094019
- [5] Ashman, J. and others, Z. Phys. C52, (1991) 361-388
- [6] Jgoun, Anton on behalf of the HERMES collaboration, Talk given at 36th Rencontres de Moriond on QCD and Hadronic Interactions, (2001)