11email: nhuelamo@cab.inta-csic.es 22institutetext: Laboratoire d’Astrophysique, Observatoire de Grenoble, BP 53, F-38041 Grenoble, Cedex 9, France 33institutetext: Astronomy Dpt., 601 Campbell Hall, UC Berkeley, CA 94720 Berkeley, USA 44institutetext: European Southern Observatory, Karl-Schwarzschild-Straße 2, D-85748 Garching, Germany 55institutetext: Instituto de Astrofísica de Andalucía, CSIC, Apdo. 3004, E-18080, Granada, Spain 66institutetext: Calar Alto Observatory, Centro Astronómico Hispano Alemán, Almería, Spain 77institutetext: European Southern Observatory, Alonso de Córdova 3107, Casilla 19, Vitacura, Santiago, Chile 88institutetext: Atacama Large Millimeter/Submillimeter Array, Joint ALMA Office, Av. Apoquindo 3650, Piso 18, Las Condes, Santiago, Chile. 99institutetext: Max-Planck-Institut für Astronomie, Koenigstuhl 17, D-69117 Heidelberg, Germany
Multi-wavelength study of the disk around the very low-mass star Par-Lup3-4††thanks: Based on observations obtained at the European Southern Observatory using the Very Large Telescope in Cerro Paranal, Chile, under programs 381.C-0283(A) and 71.C-0429(B).
Abstract
Context. Par-Lup3-4 is a very low-mass star (spectral type M5) in the Lupus III star-forming region. It shows spectroscopic evidence of accretion and mass-loss. In the optical and near-infrared, the object is underluminous by 4 mag when compared to objects of similar mass in the same association.
Aims. The aim of this work is to characterize the circumstellar environment of Par-Lup3-4 to better understand the origin of its underluminosity.
Methods. We have analyzed high angular resolution near-IR observations and searched for extended emission from a disk and/or an envelope. We have studied the spectral energy distribution (SED) of the target from the optical to the sub-millimeter regime, and compared it to a grid of radiative transfer models of circumstellar disks. Since the target is strongly variable, we modeled two different near-infrared datasets.
Results. The SED of Par-Lup3-4 resembles that of objects with edge-on disks seen in scattered light, that is, a double peaked-SED and a dip at 10 m. The diffraction-limited infrared observations do not show obvious extended emission, allowing us to put an upper limit of 20 AU to the disk outer radius. Par-Lup3-4 is probably in a Class II (rather than a Class I) evolutionary stage, which is indicated by the lack of extended emission together with the non detection of a strong 9.8m silicate in absorption. This last feature is indeed seen in emission. We fitted the whole SED of Par-Lup3-4 with a single disk model. Our modeling predicts a disk inclination of 81°6°, which agrees well with previous estimates, and provides a natural explanation for the under-luminosity of the target. The detection of the silicate feature in emission at such a high inclination might be related to a more complex disk structure (e.g. asymmetries, inhomogeneities) than the one assumed here. Our analysis allows us to put constraints on the disk inner radius, Rin 0.05 AU, which is very close to the dust sublimation radius, and the maximum size of the dust grains, amax 10 m, which indicates that dust processing has already taken place in Par-Lup3-4. Some of the derived disk parameters vary depending on the modeled near-infrared data-set, which emphasizes the importance of taking variability into account when modeling the SED of young stellar objects.
Key Words.:
stars: pre-main sequence – stars: circumstellar matter– stars: individual([CFB2003] Par-Lup3-4)1 Introduction
A large number of very low-mass stars (VLMSs) and brown dwarfs (BDs) in star-forming regions (SFR) are surrounded by circumstellar disks (see review by Luhman et al., 2007). Several studies have shown that these objects can undergo a Classical T Tauri phase that is characterized by accretion and mass-loss processes, like those observed in more massive pre-main sequence (PMS) low-mass stars (see e.g Luhman et al., 1997; Fernández & Comerón, 2001; Natta et al., 2004; Barrado y Navascués & Jayawardhana, 2004; Mohanty et al., 2005).
Over the last few years, several authors have reported the detection of young VLMS and BDs with a very peculiar phenomenology (e.g., LS-RCrA1, Par-lup-3-4, KPNO-Tau 12, 2MASSJ04381486+2611399, reported respectively by Fernández & Comerón, 2001; Comerón et al., 2003; Luhman et al., 2003, 2007): these objects show spectral features that ate characteristic of accretion, in some cases of jets and outflows, and all of them are under-luminous when compared to objects of similar spectral type and ages in the same SFR.
Fernández & Comerón (2001) and Comerón et al. (2003) have discussed three possible scenarios to explain this under-luminosity: (i) accretion-modified evolution, as described by e.g. Hartmann et al. (1997); Baraffe et al. (2009); (ii) embedded Class I sources extincted by a dusty envelope; (iii) Class II objects whose disks are seen near edge-on and block part of the stellar light.
Par-Lup3-4 is a very low-mass star discovered in the course of a near-infrared survey in the Lupus III cloud (source 0529.9-5737, Nakajima et al., 2000). It is an M5 star with a rich emission-line spectrum displaying features commonly associated with accretion and outflow (Comerón et al., 2003). It is under-luminous by almost 4 mag when compared with other objects of similar spectral type and age in the same star-forming region. The low luminosity places the star in the 50 Myr isochrone on the H-R diagram, that is, much older than the age estimated for other members of the Lupus III SFR (well below 5 Myr, Comerón et al., 2003).
Fernández & Comerón (2005) presented deep optical imaging and spectroscopy of Par-Lup3-4 obtained with FORS1 and UVES at the Very Large Telescope. The Hα and narrow-band [S ii] images revealed extended emission associated with a jet, which can be traced up to 42 from the star. The faint jet, designated as HH 600, is detected on each side of the central star, with the southeastern component displaying a bright knot well detected in both H and [S ii] as far as 13 from the star. These images make of Par-Lup3-4 one of the least massive stellar objects known to excite a jet. The optical spectrum shows a double peak [S ii] line profile with the peaks separated by 40 km/s, suggesting that the jet is seen at a small angle with respect to the plane of the sky. Assuming velocities for the emission knots similar to those commonly found in jets of more massive young stellar objects (T Tauri stars, 100-150 km/s), Fernández & Comerón (2005) have derived an orientation of the jet between 8°and 12° (0° being the plane of the sky), suggesting that the associated disk is seen nearly edge-on.
The availability of new infrared and sub-millimeter data of Par-Lup3-4 gives us the opportunity of characterizing its circumstellar environment and study if its under-luminosity can be explained by the presence of an edge-on disk or an envelope. In addition, we can check the consistency with the results derived using optical spectroscopy by Fernández & Comerón (2005). In this work, we present diffraction-limited near-infrared observations of Par-Lup3-4, together with mid-IR spectroscopic and sub-millimeter data. We have used all these observations and archival or published data to build and model the spectral energy distribution (SED) of the target. In Sect. 2, we give an overview of all the observational data. The main properties of the SED and its modeling are described in Sect. 3 and 4. The analysis and main results are described in Sect. 5, while the main conclusions are summarized in Sect. 6.
2 Par-Lup3-4 observational data
2.1 High angular resolution near-IR observations of Par-Lup3-4
| Date | Filter | Exp. Time | Seeing | Airmass |
|---|---|---|---|---|
| [s] | [”] | |||
| 22/06/2008 | 600 | 0.60-0.62 | 1.12 | |
| 22/06/2008 | 1800 | 0.65-0.62 | 1.10 | |
| 22/06/2008 | 1440 | 0.85-0.91 | 1.23 |
Par-Lup3-4 was observed in service mode on 2008 June 22 with NAOS-CONICA (NACO), the Adaptive Optics (AO) facility and near-IR camera at the Very Large Telescope (VLT). The object is too faint to be used as a reference star for the adaptive optics wavefront sensor, and a nearby star was used instead (Par-Lup3-3, =9.54 mag, located at 244 southwest of the target).
The target was observed in the and broad band filters to search for extended emission from the disk (and envelope), and in the 2.12 m narrow band filter, to search for H2 (1-0 S (1)) emission from shocks related to its jet. The S27 camera was used for the Ks and NB2.12 observations and the L27 camera for the L’ observations, leading to a nominal pixel scale of 27 mas/pix and a total field of view of 27″ 27″. Observations in the and filter were made with the infrared wavefront sensor and the N90C10 dichroic that sends 10% of the light to the science camera and 90% to the wavefront sensor. The L’ observations were carried out with the near-IR wavefront sensor and the JHK dichroic that sends the JHK light of the reference star to the wavefront sensor.
The Ks and NB2.12 observations were made in jitter mode with 10 random positions and a jitter width of 7”. The L’ band observations were made in jitter mode as well, with 48 random positions within a 7” jitter box. The total exposure times add up to 600 s, 1800 s, and 1440 s in the Ks, NB2.12, and L’ filters, respectively.
The NACO data were processed with the Eclipse software (Devillard, 1997) following the standard reduction steps, that is, dark-subtraction, flat-fielding, bad pixel correction, sky subtraction, and image stacking. Table 1 gives an overview of the observational settings and properties.
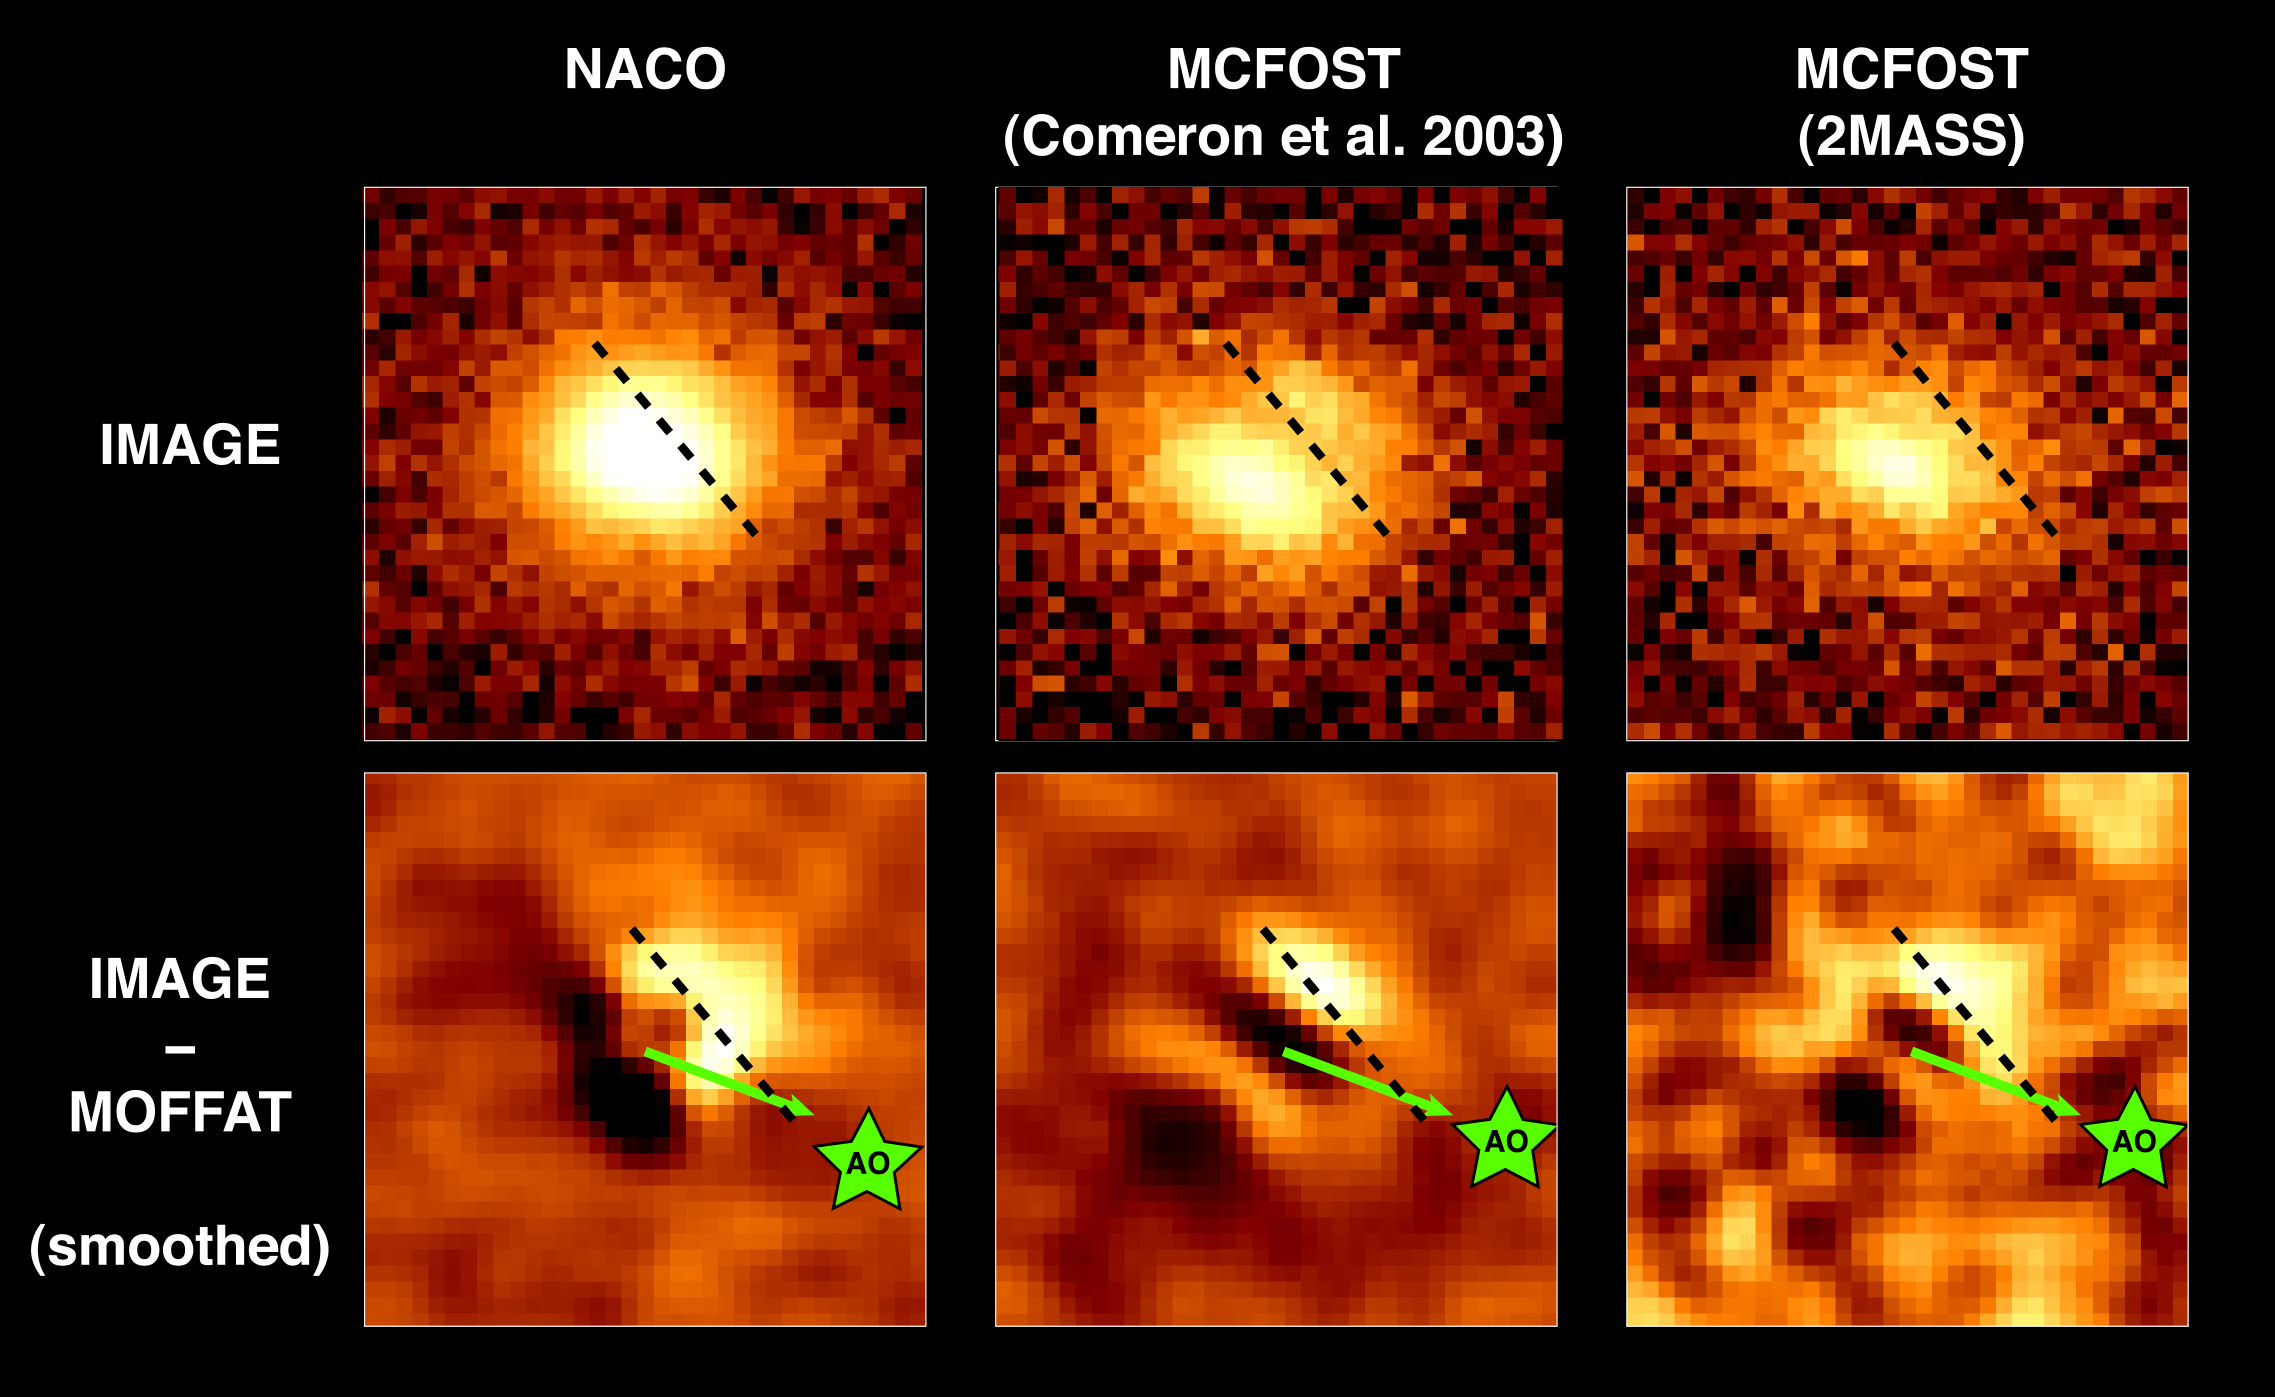
Par-Lup3-4 is detected in the three NACO filters. The target is seen slightly elongated in the direction of the reference star. This elongation could be caused by the adaptive optics correction, given that the wavefront sensing reference star was not the target itself and the PSF is expected to suffer from anisoplanatism. To study this elongation and the presence of extended emission, we have performed PSF-subtraction and analyzed the residuals.
Because no PSF star could be obtained, we fitted Par-Lup3-4 -band image with a MOFFAT function and subtracted it. The result is shown in the left panels of Fig. 1. The PSF-subtracted image shows asymmetric residuals, with a faint extended nebulosity in the northwest quadrant. The nebulosity is not aligned in the direction of the reference star, but is closer to the expected position of the disk, at a position angle of 40 North to East, that is, perpendicular to the jet (Fernández & Comerón, 2005). In any case, the signal-to-noise ratio of the dataset is not sufficient to conclude that the disk is spatially resolved. The Ks-band residuals allow us to derive an upper limit for the disk angular radius of 01. For the L’ image, a MOFFAT fit on the NACO image shows that indeed no significant residuals remain in the northwestern quadrant. This is mostly owing to the much lower signal-to-noise ratio of the L’ image (115 instead of 600).
2.2 Mid-infrared spectroscopy
Par-Lup3-4 was observed with the Spitzer Infrared Spectrograph (IRS, Houck et al., 2004) as part of program 40134 (P.I. Luhman) during cycle 7. The source was observed in staring mode at low resolution at both short and long wavelengths. We retrieved the public data and first processed them using the c2d package, which is fully described in Lahuis et al. (2006). Two different extraction methods are available: full aperture extraction or optimal PSF extraction. The second method is less sensitive to bad pixels or bad data samples than the first method which provides spectra with fewer spikes. We used the spectrum and corresponding uncertainties obtained with the PSF extraction method. The c2d pipeline furthermore corrects for possible pointing errors that can lead to important offsets between different modules.
The short wavelength spectrum ranging from 5 to 14m agrees well with the overlapping IRAC photometry, but the long wavelength spectrum was clearly problematic with a 14 m flux that was inconsistent with the overlapping short wavelength spectrum, and a 24 m flux inconsistent with the MIPS photometry.
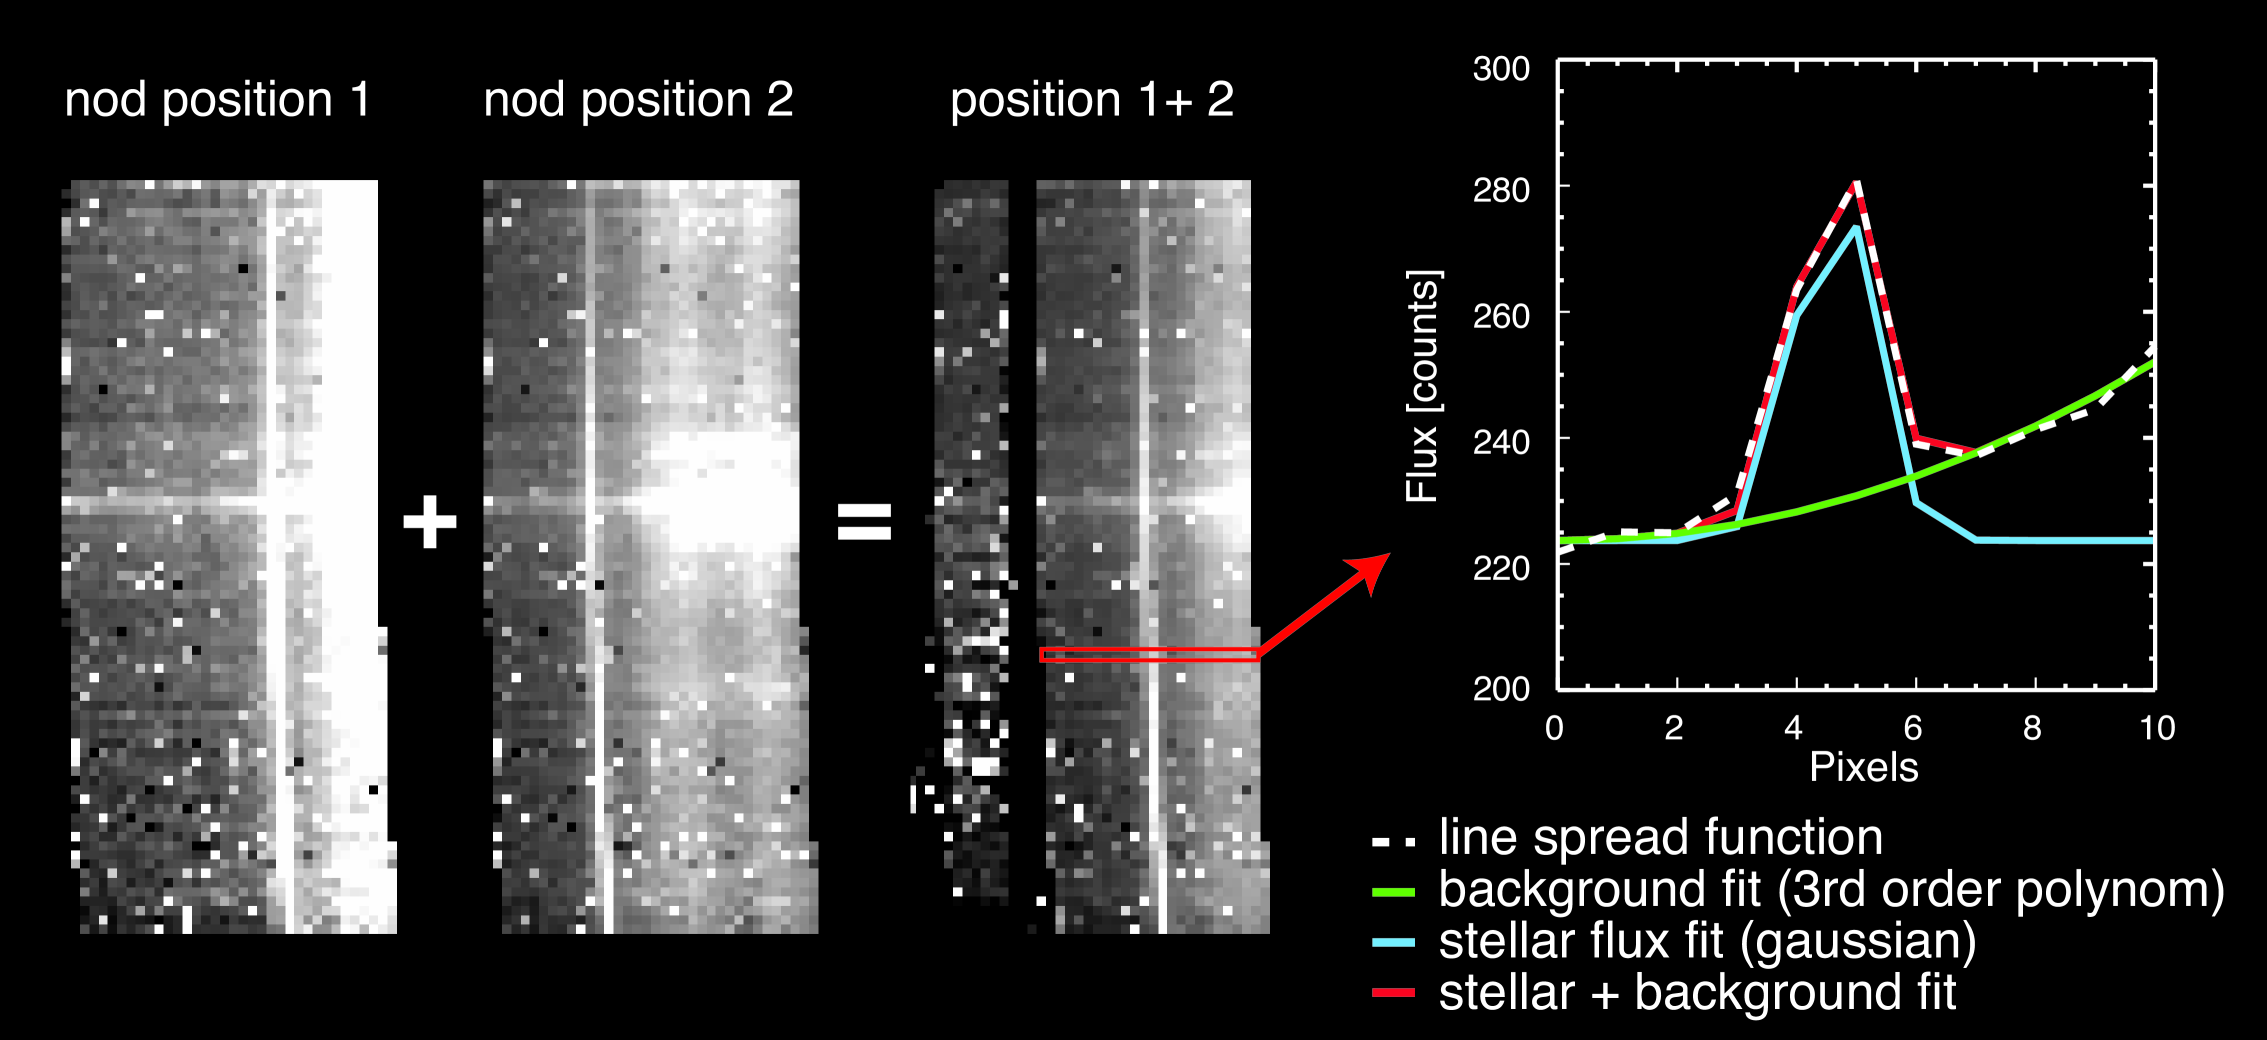
A careful inspection of the 2-D spectra reveals that the short wavelength spectrum looks relatively clean and normal, while the long wavelength 2-D spectrum displays a strong and spatially variable background that does not cancel after subtracting the two nodding positions, which explains the problematic extraction with the automated c2d pipeline (see Fig. 2). A different extraction strategy was required, and we proceeded as follows: the two nodding positions were aligned and combined rather than subtracted one from the other. Obvious rogue pixels close to the stellar spectrum were cleaned manually with the IRSCLEAN package within the Interactive Data Language (IDL). Then, a synthetic line spread function made of a Gaussian (for the source’s signal) plus a third order polynomial function (for the background) was fitted to each line of the 2D spectrum. The corresponding synthetic background was then subtracted from the original image, which was subsequently processed following the recommended procedure with the Spitzer IRS Custom Extraction (SPICE) software. The whole procedure is presented schematically in Fig. 2. Unfortunately, uncertainties cannot be easily propagated during this complex process. While it is difficult to assess the reliability of the resulting spectrum, we note that it very well matches the short wavelength spectrum on one side and the MIPS 24 m photometry on the other side. Since we are not interested in the detailed study of the different features and lines present in the spectrum but in the general shape and slope of the spectrum, we finally smoothed the spectrum using a Gaussian kernel with a width of 5 pixels.
2.3 Submilimeter observations with APEX/LABOCA
The Lupus III region was observed at 870m with LABOCA, the bolometer array installed on the Atacama Pathfinder EXperiment (APEX111This work is partially based on observations with the APEX telescope. APEX is a collaboration between the Max-Plank-Institute fur Radioastronomie, the European Southern Observatory, and the Onsala Space Observatory.) telescope. The angular resolution of each bolometer is 19.51′′, and the total field of view (FOV) of the array is 11.4′11.4′
We retrieved the data from the ESO archive. Observations were performed on 2007 August 01 and 02 during the ESO program 079.F-9302A (P.I. Hatchell), and on 2008 June 01, 02, 03, and 04 during the program 081.F-9318A (P.I. Hatchell). The total on-source integration time was 29 hours. A spiral raster mapping was used as observing pattern, providing a fully sampled and homogeneously covered map in an area of diameter 25′20′, centered at = 16h09m00.00s, = -39o06′30.0′′(J2000.0).
The data were acquired under relatively good weather conditions (zenith opacity values at 870 m ranged from 0.25 to 0.44, with a mean value of 0.31). The telescope pointing was checked every hour, finding an rms pointing accuracy of 2′′. Focus settings were checked once per night and during the sunset. Calibration was performed using observations of Mars, Saturn, and Jupiter, as well as secondary calibrators. The absolute flux calibration uncertainty is estimated to be 11.
We reduced the data with the BOlometer Array Analysis Software (BoA) and the MiniCRUSH program (see Kovács 2008). The pre-processing steps consisted of flagging dead or cross-talking channels, frames with too high telescope accelerations and with unsuitable mapping speed, as well as temperature drift correction using two blind bolometers. The data reduction process included flat-fielding, opacity correction, calibration, correlated noise removal, and de-spiking. Every scan was visually inspected to identify and discard corrupted data. Finally, the individual maps were coadded and smoothed to a final angular resolution of 276. We optimized the data reduction to recover faint and point-like sources. As a result, we obtained a 1 point source sensitivity of 4.5 mJy.
Par-Lup3-4 is not detected in the LABOCA observations, and we derive a 3- upper limit for its 870m continuum emission of 13.5 mJy.
2.4 Optical, near-infrared, and mid-IR photometry
| Filter | Magnitude | Epoch | Reference |
| [mag] | |||
| 21.90.3 | 2002-03-22 | Comerón et al. (2003) | |
| 19.780.15 | 2002-03-22 | Comerón et al. (2003) | |
| 18.970.59 | 2003-04-25 | Merín et al. (2008) | |
| 18.30.1 | 2002-03-22 | Comerón et al. (2003) | |
| 18.180.05 | 2003-04-25 | Merín et al. (2008) | |
| 15.700.03 | 1998-03-12 | Nakajima et al. (2000) | |
| 16.040.21 | 1999-06-04 | DENIS | |
| 15.460.06 | 2000-03-30 | 2MASS | |
| 16.420.05 | 2002-07-20 | Comerón et al. (2003) | |
| 14.720.02 | 1998-03-12 | Nakajima et al. (2000) | |
| 14.260.04 | 2000-03-30 | 2MASS | |
| 15.090.05 | 2002-07-20 | Comerón et al. (2003) | |
| 13.700.01 | 1998-03-12 | Nakajima et al. (2000) | |
| 13.580.19 | 1999-06-04 | DENIS | |
| 13.300.04 | 2000-03-30 | 2MASS | |
| 13.820.10 | 2002-07-20 | Comerón et al. (2003) | |
| Filter | Flux | Epoch | Reference |
| [mJy] | |||
| IRAC1 (3.6 m) | 3.110.05 | 2004-08-24 | Chapman et al. (2007) |
| IRAC2 (4.5 m) | 3.250.04 | 2004-08-24 | Chapman et al. (2007) |
| IRAC3 (5.8 m) | 2.340.04 | 2004-08-24 | Chapman et al. (2007) |
| IRAC4 (8.0 m) | 1.740.04 | 2004-08-24 | Chapman et al. (2007) |
| MIPS1 (24 m) | 27.90.3 | 2004-08-24 | Chapman et al. (2007) |
| MIPS2 (70 m) | 492.053.6 | Merín et al. (2008) |
Par-Lup3-4 has been observed in different filters and epochs. Table 2 gives an overview of the compiled photometry of the source in different filters.
Comerón et al. (2003) presented simultaneous optical , , and photometry. Merín et al. (2008) have provided photometry. The target shows variability in the band despite the large photometric errors. In this paper, we will only consider the simultaneous optical observations by Comerón et al. (2003).
Four independent studies report near-infrared (near-IR) measurements: the DENIS and 2MASS surveys (Epchtein et al., 1997; Cutri et al., 2003), Nakajima et al. (2000) and Comerón et al. (2003). Par-Lup3-4 is variable at near-IR wavelengths as already reported by Comerón et al. (2003). Such a strong variability (0.5-1 mag) is not uncommon among T Tauri stars, and it can be attributed to a combination of changes in the accretion process and disk properties, as reported in previous studies of these objects (e.g. Mendoza, 1968; Appenzeller & Mundt, 1989; Skrutskie et al., 1996; Eiroa et al., 2002; Watson & Stapelfeldt, 2007).
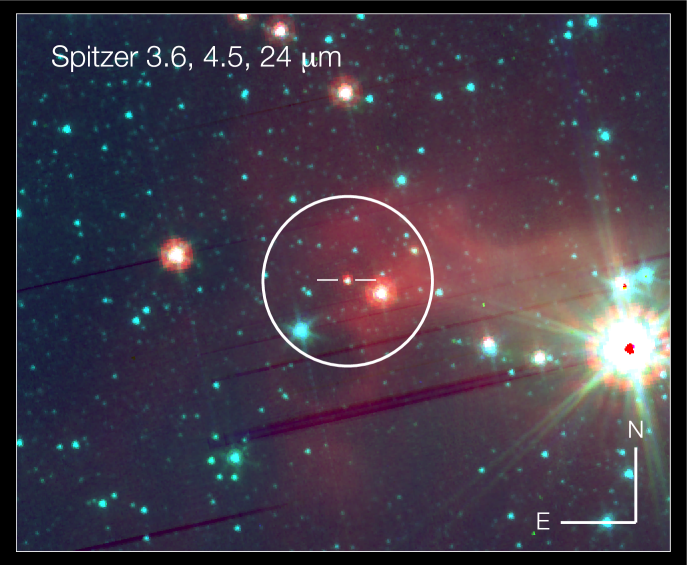
Par-Lup3-4 was observed with the Spitzer Space Telescope on 2004 August 24 in the course of the Cores to Disks (c2d) Legacy Program (Program 175, P.I. Evans, Chapman et al., 2007, and Fig. 3). It is reported in the c2d catalog in the four IRAC filters (3.6, 4.5, 5.8 and 8.0 m) and with MIPS at 24 and 70 m (Chapman et al., 2007; Merín et al., 2008). A mid-IR image of the region is displayed in Fig. 3.
3 The SED of Par-Lup3-4
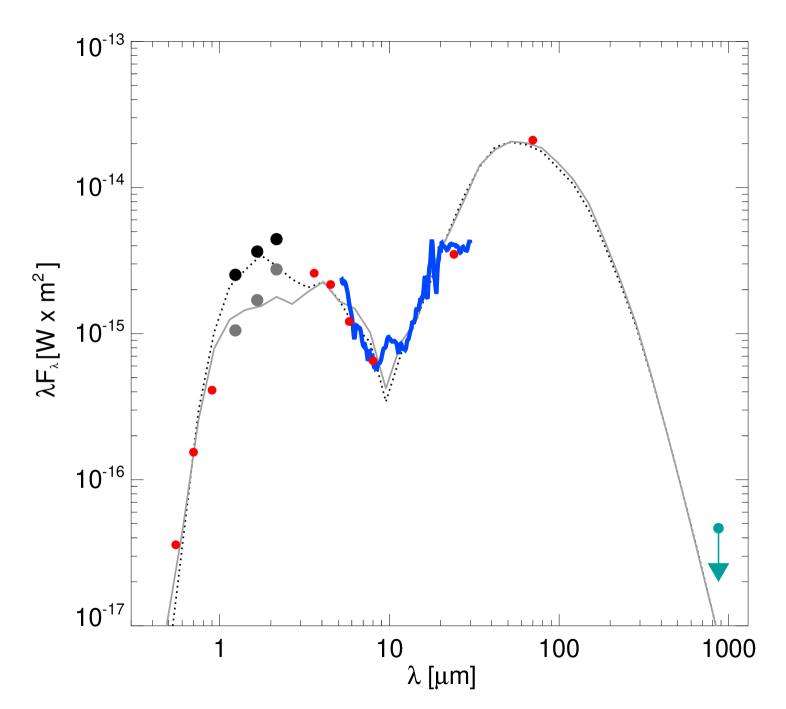
The SED of Par-Lup3-4 is displayed in Fig. 4. We have overplotted the two most extreme near-IR datasets given in Table 2 to show its strong variability. The most remarkable feature of the SED is its overall shape: two-peaks at near- and mid-IR wavelengths and a dip around 8m. This shape is typical of edge-on disks obscuring the central star (e.g. Stapelfeldt & Moneti, 1999; Wood et al., 2002; Duchêne et al., 2010). Because the disk is optically thick at short wavelengths, the visible and near-IR stellar light is blocked and the emission at these wavelengths is dominated by scattered light. At longer wavelengths (24 m) the dust emission penetrates the mostly optically thin disk, resulting in a steep positive slope.
Since the object is observed in scattered light at shorter wavelengths, we cannot derive a visual extinction using its colors. This and the double-peak SED prevent us from using the classical SED indexes that combine near and mid-IR data (e.g. Lada & Wilking, 1984; Luhman et al., 2008) to shed light on its evolutionary stage.
The Spitzer IRS spectrum allows us a more detailed study of the SED, at least from 5 to 15 microns, where the signal is properly background-corrected. The most interesting feature in this range is the silicate band at 9.8 micron, which can provide information about the evolutionary status of the object, the disk inclination, and the properties of the dust.
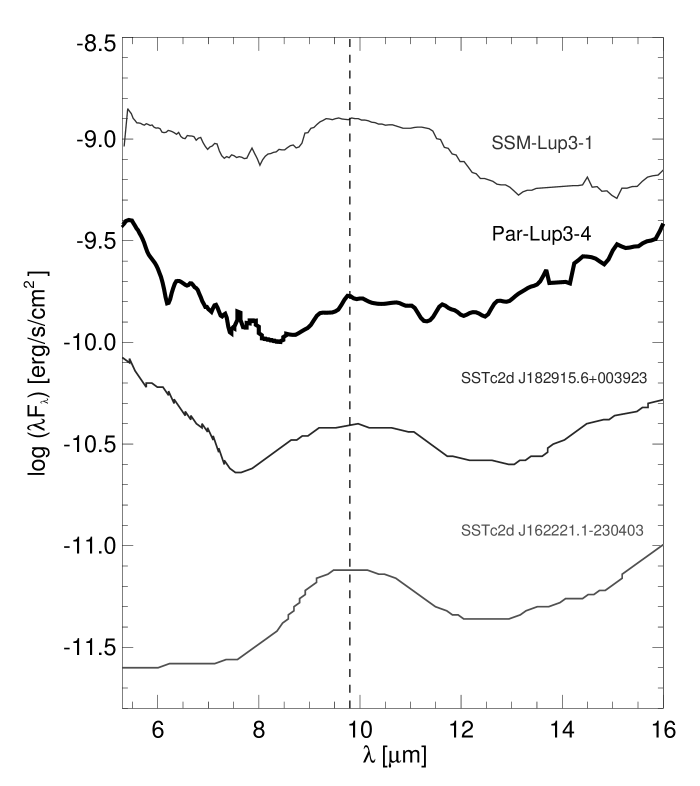
Figure 5 shows the SL IRS spectrum of Par-Lup3-4. First, note that we do not detect a strong and deep silicate feature in absorption, as expected for Class I objects surrounded by thick envelopes (e.g. Watson et al., 2004; Furlan et al., 2008). A strong CO2 absorption band at 15.2 m is not detected either, although the problems with the background subtraction at those wavelengths prevent us from drawing firm conclusions about this feature. The mid-IR spectrum points toward an evolutionary stage closer to Class II than Class I, which is consistent with the lack of extended emission from an envelope in the NACO/ observations.
The shape and strength of the silicate feature strongly depends on the disk inclination and the presence of small grains in the surface of the disk. For edge-on disks, the study of the silicate feature is more complicated because the SED normally shows a dip at 10 microns, which is not related to the feature itself, but to the high inclination of the disk (see e.g. Pontoppidan et al., 2007). For Par-Lup3-4, the spectrum slope is inverted between 7m and 14 m and displays a dip at 8.5m. A flux enhancement is observed between 9.8m and 11m (Fig. 5) and, although not expected in disks at high inclinations, seems to be related to the silicate feature in emission. Indeed, Merín et al. (2010) have recently presented several close to edge-on disks that also show this feature in emission. Two of them are included in Fig. 5 for comparison. A third stellar object from the same star-forming region and with an estimated disk inclination of °, SSM-Lup3-1, has also been overplotted for comparison (Merín et al., 2007). The shape of the Par-Lup3-4 spectrum resembles that of SSTc2d J182915.6+003923 (see Fig. 5), a K7-type star in Serpens with a disk inclination of (Merín et al., 2010). Understanding the dust properties of Par-Lup3-4 (e.g. grain size distribution, crystalline vs amorphous species) would require a higher quality spectrum and a more detailed analysis, including a more refined grid of models for the continuum than those presented in this work, and also a careful modeling of the mineralogy. Such an analysis goes beyond the scope of this paper, which aims at understanding the underluminosity of the target.
4 SED modeling
We have modeled the SED of Par-Lup3-4 in order to characterize its circumstellar environment. As explained in Sect. 4, the IRS spectrum allows us to rule out the presence of a thick envelope. We therefore neglect the contribution of a possible envelope remnant, and model the SED assuming that the target is surrounded only by a disk.
Because several epochs are available for the near-IR photometry, and as the source displays a significant variability in this wavelength range, we have modeled two datasets: the faintest and brightest sets of near-IR photometry, from Comerón et al. (2003) and 2MASS, respectively. In both cases, the solution is certainly not unique, but constraints can be drawn on some parameters. The lack of additional and simultaneous epoch observations in the other wavelength ranges prevents us from studying the impact of optical (which is commonly observed in young late-type stars) or mid-IR variability (which may be also common in these objects, e.g. Robberto et al., 2005; Morales-Calderón et al., 2009) in our best model solutions.
4.1 MCFOST radiative transfer models
SED calculations were performed using the 3D radiative transfer code MCFOST (Pinte et al., 2006), which includes multiple scattering, passive dust heating, and continuum thermal re-emission.The model consists of a central star surrounded by a parametric disk described by power-laws.
– Disk structure: The models consider a flared density structure with a Gaussian vertical profile, , and power-law distributions for the surface density, , and the scale height, , where is the radial coordinate in the equatorial plane, and the scale height at the reference radius AU. These assumptions lead to a general expression for the density at any point in the disk:
| (1) |
The disk extends from an inner cylindrical radius to an outer limit . The radiative transfer calculations are performed in full 3D, although the disk structure is axisymmetric (2D).
– Grain properties: The models consider homogeneous porous spherical grains and use the dielectric constants described by Mathis & Whiffen (1989) in their model A, which follows interstellar-like relative abundance of elements. The grain sizes are distributed according to the power-law , with and the minimum and maximum sizes of grains, discussed below. The interstellar values from Mathis & Whiffen (1989) are m and m. The mean grain density is g.cm-3. In this work, is considered as a free parameter in an attempt to constrain the amount of dust processing in the disk. Extinction and scattering opacities, scattering phase functions and Mueller matrices are calculated using the Mie theory. Finally, note that we have not tried to vary the grain composition to fit the silicate feature observed in the IRS spectrum.
4.2 Stellar parameters
The distance to the Lupus SFR has been derived in different works and show values that can range between 100-300 pc (see extensive discussion by Comerón, 2008). For this paper, we have adopted an average distance of 140 pc to Par-Lup3-4.
For our analysis, we have used the NextGen (Baraffe et al., 1998) synthetic photospheric spectrum of a star with Teff=3 100 K (as derived from optical spectroscopy by C03) and 1 Myr, which is the estimated age of the Lupus III association according to different works (e.g. Comerón et al., 2003; Makarov, 2007; Merín et al., 2008).
The shape of the SED (and the modeling presented in the analysis below) indicates that Par-Lup3-4 is seen in scattered light in the optical and near-IR range. As a consequence, the extinction toward the central star and its luminosity (radius) cannot be reliably derived with the optical spectrum or the optical and near-IR colors. This value, however, will be determined by our modeling.
For the remainder of our analysis, we have considered Par-Lup3-4 to have a stellar radius of 1.3 R⊙ and a mass of 0.13, as predicted by the NextGen models for a 3 100 K star at an age of 1 Myr. To account for uncertainties in the distance and the main properties of the central source (e.g. radius, age), a scaling factor q (see Table 3) has been applied to the synthetic SED to match the observed one.
4.3 Disk parameters
Table 3 gives a summary of the parameter space covered for the disk model. Because the target does not show an obvious extension in our NACO observations, we have fixed the outer disk radius to 20 AU, which is a conservative value based on the residuals of the NACO images at a distance of 140 pc.
The grid adds up to a total of 409 500 models on the IAC Condor® High Throughput Computing facility and the UC Berkeley Clustered computing facility. Although we have computed the SED only at the wavelengths at which we have available photometry, the thermal equilibrium computation allows for photons of all wavelengths to travel through the disk.
| Parameter | Min | Max | Number | Sampling | Description |
| of values | |||||
| MCFOST input parameters | |||||
| [m] | 0.005 | 0.005 | 1 | fixed | minimum grain size |
| [m] | 1 | 100 | 5 | log | maximum grain size |
| -1.5 | -0.5 | 3 | linear | surface density index | |
| Mdisk [M☉] | 10-7 | 10-5 | 6 | log | disk dust mass |
| h0@100AU [AU] | 10 | 30 | 6 | linear | scale height |
| Rin [AU] | 0.05 | 1.0 | 5 | log | inner radius |
| Rout [AU] | 20 | 20 | 1 | fixed | outer radius |
| 1.05 | 1.35 | 5 | linear | flaring angle index | |
| [°] | 0 | 90 | 10 | linear in cosi | inclination |
| [mag] | 0 | 10 | 10 | extinction | |
| 0 | 2 | 5 | scaling factor | ||
| 2MASS | Comeron-2003 | |
| [m] 1 | 100 | 100 |
| 1 | -0.5 | -0.5 |
| Mdisk [10-6 M⊙] | 0.25 | 0.63 |
| h0@10 AU [AU] | 1.28 | 2.29 |
| Rin [AU] | 0.05 | 0.05 |
| 1.275 | 1.125 | |
| [°] | 81 | 81 |
| [mag] | 3.5 | 2.0 |
| 0.7 | 0.7 | |
| reduced- | 19.9 | 13.4 |
1 Note that these two parameters are at the limit of the explored range of values.
5 Analysis and main results
5.1 Bayesian analysis
We have performed a comparison of the synthetic SEDs with the observations. The best fit has been defined as that with the lowest and was found by a complete exploration of the parameter space within the ranges described in Table 3. Note that based on our experience with the code, a conservative Monte Carlo noise of 10% has been included in the models. Because there are degeneracies between parameters, we have not attempted to refine the best model, which is defined as the closest grid point (that is, a local minimum in the parameter space). Instead, we have performed a Bayesian analysis using the reduced to get an estimate of the validity range for each of the explored parameters (Press et al., 1992; Lay et al., 1997; Pinte et al., 2007). The results from this analysis provide the most probable disk parameters.
A relative probability exp(– /2) is calculated for each individual model. The relative likelihood for each of the parameters is obtained by adding the individual probabilities of all the models with a given parameter value. In other words, these probabilities are the result of a marginalization of the parameter space successively over all dimensions and not a cut through the parameter space. In that sense, they account for potential correlations and interplay between parameters, and quantitative error bars can be extracted from them.
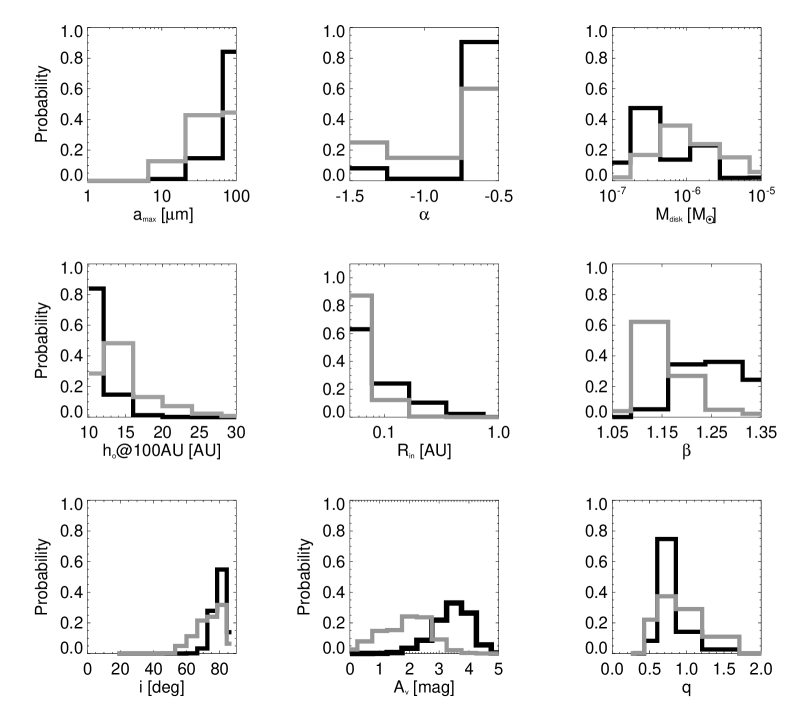
The results from the Bayesian analysis are presented in Fig. 6, where we display histograms with the probability for different disk parameters. We now discuss what constraints on the properties of the disk can be extracted from this analysis.
5.2 Disk properties
We can reproduce the observed SED of Par-Lup3-4 with a single disk model (see Fig.4). The MCFOST model fits the overall shape of the SED (see Fig. 4), although it does not reproduce the 10 m silicate feature (see subsection 5.3).
Figure 6 shows that the most probable value of the inclination is =81°. A Gaussian fitting to the probabilities provides values of 769 degrees and 804 degrees for C03 and 2MASS, respectively. These values agree very well with the inclination derived by Fernández & Comerón (2005) based on spectral lines related to the stellar jet (78°82°).
Our Bayesian analysis shows that the overall shape of the SED can only be reproduced when including grains with a10 m. This result points towards dust processing within the disk of Par-Lup3-4, as already observed in other low mass members of the same association (e.g. SST-Lup3-1, Merín et al., 2007) or in other associations of similar ages (e.g. Bouy et al., 2008; Luhman et al., 2007).
For the inner disk radius, the best and most probable disk models provide R0.05 AU. For the assumed dust composition and disk geometry (from the best model), the constraint on the internal radius corresponds to the distance where the temperature reaches the sublimation temperature (T1 400 K).
Although fixed to 20 AU, we have further investigated the outer disk radius by comparing the synthetic images of the best MCFOST models (both C03 and 2MASS) with the -band NACO images (see Section 2.1). The corresponding synthetic images were rebinned to the NACO S27 camera pixel scale, and then convolved with a synthetic NACO PSF obtained with the NAOS PS222NAOS Preparation Software software for the configuration and conditions of our observations, and additional Poisson noise was added to match the signal-to-noise ratio of the NACO image. The results are shown in the middle and right panels of Fig. 1. The synthetic images are made of a bright south-eastern nebulae and a faint north-western nebulae, separated by a dark lane typical of high inclination disks. After subtraction of a MOFFAT PSF on these synthetic images the faint north-western nebulosity appears more clearly, as in the PSF-subtracted NACO images, and align close to the disk direction. Although the comparison of the observed and modeled data suggests the disk is marginally resolved, more sensitive data is needed to confirm this point.
The dust mass in the disk is only loosely constrained to Mdust10M⊙, that is, MdiskMJup assuming the typical gas to dust ratio of 100. We have compared this value with the upper limit obtained from the sub-mm data alone: assuming optically thin dust continuum emission, we estimate the upper limit for the total mass (gas+dust) from Par-Lup3-4 with
where is the flux density at 870m, is the distance to the source, 870 is the dust opacity per unit mass column density at 870m, and is the Planck function at 870m for a dust temperature (Hildebrand, 1983). Adopting a 3 flux density upper limit of 13.5 mJy, a distance of 140 pc (see Section 5.2), a =0.015 cm2 gr-1 (following Ossenkopf & Henning 1994), and a =15-20 K (see Tachihara et al. 2007), we derive an upper limit for the total mass of 1.9-3.0 depending on the adopted dust temperature.
Hence, the disk mass from our modeling is one order of magnitude smaller than the upper limit obtained with APEX observations alone, and is similar to that found in other disks around very-low mass objects, e.g. SSM-Lup3-1 and 2M 0438+2611, with masses of 0.1 MJup and 0.3-0.6 MJup (see Merín et al., 2007; Luhman et al., 2007, respectively).
The surface density index shows a value closer to - 0.5 (only three values were covered by our analysis), which is consistent with that found in disks around T Tauri stars (Dutrey et al., 1996; Kitamura et al., 2002; Andrews & Williams, 2005).
In the current state of the observations, we cannot derive any firm constraint on the flaring angle index, , or the scale height . However, we note that the derived scale height for the 2MASS model, 1.28 AU at 10 AU, is consistent with the hydrostatic scale height calculated from the modeled temperature structure of the disk (h0 1.05 AU). This does not apply to the C03 model, with a derived scale height of 2.29@10AU and a hydrostatic scale height of 1.04 AU.
The visual extinctions, , values are different depending on the near-IR dataset, 2.00.9 and 3.50.6 mag for C03 and 2MASS data, respectively. In the case of the C03 model, the value is 3.6 mag smaller than that derived using near-IR colors (see Comerón et al., 2003), a method that does not work properly in the case of edge-on disks. For comparison, we have estimated the extinction caused by the cloud using an adaptive grid star-count method developed by Cambresy et al. (1997). We have used the 2MASS database instead of DENIS, since the former increases the number of objects in , doubles the spatial resolution and deepens mag in the J-band. From the sample of 2MASS objects in the region of interest, we have rejected those classified as Lupus III members or candidate members (Wichmann et al., 1997a, b; Krautter et al., 1997; Comerón et al., 2003; López Martí et al., 2005; Gondoin, 2006) and those having Hipparcos distances lower than 100 pc to avoid foreground objects. We have chosen and a squared degrees field outside the cloud to derive the relationship between the local projected density and the limiting magnitude assumed in an unobscured area. The derived extinctions in the direction of Par-Lup3-4 are =1.53, =0.94, =0.87, which translates into =5.4 mag, following Rieke & Lebofsky (1985). The difference between this value and those coming from our modeling might suggest that the object is not placed at the most distant edge of the region but closer to the center of the cloud. This assumes that the C03 data represents the quiescent state of the source. However, a proper optical and infrared monitoring of Par-Lup3-4 is needed to identify this quiescent state and estimate the visual extinction associated with it.
The scaling factor, q, is smaller than 1.0 (we obtain a value of 0.7 for the two models, placing the object at 98 pc). This can be the result of a combination of uncertainties, in particular, an error in the assumed distance, in the age (the star can be younger than 1 Myr old), and the error of the stellar radius derived using evolutionary models.
Finally, our analysis of the two near-IR datasets illustrates the strong effect of variability on the SED modeling. While the disk inclination and the maximum grain size do not depend on the near-IR dataset used, other parameters such as the scale height or the flaring angle are significantly affected by variability. The SED modeling based on a single-epoch photometric dataset should therefore be interpreted with caution. The degeneracy related to variability can be partially addressed by using simultaneous observations at all wavelengths, but also by a better coverage of the electromagnetic spectrum, and by spatially resolved images of the disk at various wavelengths.
5.3 The disk model and the IRS spectrum of Par-Lup3-4
We can reproduce the overall shape of the SED of Par-Lup3-4 with a single-disk model at an inclination of 80 degrees, in good agreement with the value found by Fernández & Comerón (2005). Our model cannot reproduce the observed silicate feature, but this is not surprising because, as explained before, we did not make a special treatment of the feature and used the dielectric constants from Mathis & Whiffen (1989), which have a small silicate emission.
Although the presence of a close to edge-on disk can explain most of the observed properties of Par-Lup3-4 (e.g. underluminosity, double-peak SED), it is inconsistent with the detection of the silicate feature in emission. At such a high inclination the feature is expected to be in absorption because the light emitted by the disk is scattered to the observer and the strong peak in the scattering cross-section of grains is obliterated by an even stronger absorption feature in the albedo, even for pure silicate grains.
Although the detection of the 10m silicate feature in emission in Par-Lup3-4 is unexpected, it was recently reported in several close to edge-on disks studied by Merín et al. (2010). The puzzling presence of this feature could be related to a more complex disk structure (e.g. with asymmetries and inhomogeneities) than the one assumed in theoretical models, or even to a presence of an optically thin (unlike those of embedded protostars) residual envelope. Spatially resolved observations are needed to explore any of these possibilities.
6 Conclusions
We have analyzed new infrared and radio observations of the very low-mass object Par-Lup3-4. We have modeled its SED and characterized its circumstellar environment. Our main results can be summarized as follows:
-
1.
The SED of Par-Lup3-4 shows two emission peaks with a dip at 10 microns, and a weak silicate feature in emission. This shape can be interpreted as that of a star+disk system seen in a way that our direct line of sight is blocked by disk material, resulting in scattered light reaching the observer at all wavelengths shortward of 10 m. The presence of this close to edge-on disk can explain the apparent under-luminosity of the target.
-
2.
High angular infrared observations do not reveal extended emission from a thick envelope, but a possible marginal detection of the disk in scattered light. This, and the non-detection of the 9.8m silicate feature in absorption, suggests that Par-Lup3-4 is not a Class I, but a Class I/II or Class II object.
-
3.
A detailed Monte Carlo modeling of the SED has allowed us to constrain some of the disk properties, in particular it allowed us to derive a most probable inclination of 81°, which agrees very well with previous estimates based on its associated jet. As in the case of several close to edge-on disks studied by Merín et al. (2010), we detect silicates in emission at a high disk inclination. This might be related to a more complex disk structure that includes e.g. asymmetries and inhomogeneities.
- 4.
-
5.
Stellar variability affects the results of our SED modeling, which provides different results for some of the disk parameters, e.g. flaring angle or scale height, for different near-IR datasets.
New measurements including deeper spatially resolved images of the scattered light (e.g with ), and far-IR and (sub)mm detections (e.g with Herschel), would lead to better constraints on the disk properties and on the formation of this very low-mass object. A more detailed analysis of the Spitzer IRS spectrum would provide more information about the origin and nature of the emission seen at 9.8m. Indeed, the presence of this feature in emission at such a high inclination calls for more studies of mid-IR spectra of close to edge-on disks, both on the theoretical and observational side. Finally, a careful monitoring at optical, near-IR, and mid-IR wavelengths would provide important information about the nature of the variability (disk homogeneity, accretion, outflows) and its effect on SED modeling.
Acknowledgements.
This research has been funded by Spanish grants MEC/ESP2007-65475-C02-02, MEC/Consolider-CSD2006-0070, and CAM/PRICIT-S2009ESP-1496. MF was supported by the Spanish grants AYA2006-27002-E and AYA2007-64052. IdG is partially supported by Ministerio de Ciencia e Innovación (Spain), grant AYA 2008-06189-C03 (including FEDER funds), and by Consejería de Innovación, Ciencia y Empresa of Junta de Andalucía, (Spain). C. Pinte acknowledges funding from the European Commission’s seventh Framework Program as a Marie Curie Intra-European Fellow (PIEF-GA-2008-220891). The authors are very grateful to Angel Vicente for his support and help in using the computer resources at IAC. This research would not have been possible without access to the computing facilities provided by the Instituto Astrofísica de Canarias and the UC Berkeley Clustered Computing center at the Department of Electrical Engineering and Computer Sciences. The authors wish to acknowledge the contribution from Intel Corporation, Hewlett-Packard Corporation, IBM Corporation, and the National Science Foundation grant EIA-0303575 in making hardware and software available for the CITRIS Cluster, which was used in producing these research results. Finally, we acknowledge financial support from Programme National de Physique Stellaire (PNPS) of CNRS/INSU, France and Agence Nationale pour la Recherche (ANR) of France under contract ANR-07-BLAN-0221. This research has made use of the Condor®, developed and provided by the Condor Project at the University of Wisconsin Madison (http://www.condorproject.org/).References
- Andrews & Williams (2005) Andrews, S. M. & Williams, J. P. 2005, ApJ, 631, 1134
- Appenzeller & Mundt (1989) Appenzeller, I. & Mundt, R. 1989, A&A Rev., 1, 291
- Baraffe et al. (1998) Baraffe, I., Chabrier, G., Allard, F., & Hauschildt, P. H. 1998, A&A, 337, 403
- Baraffe et al. (2009) Baraffe, I., Chabrier, G., & Gallardo, J. 2009, ApJ, 702, L27
- Barrado y Navascués & Jayawardhana (2004) Barrado y Navascués, D. & Jayawardhana, R. 2004, ApJ, 615, 840
- Bouy et al. (2008) Bouy, H., Huélamo, N., Pinte, C., et al. 2008, ArXiv e-prints, 803
- Cambresy et al. (1997) Cambresy, L., Epchtein, N., Copet, E., et al. 1997, A&A, 324, L5
- Chapman et al. (2007) Chapman, N. L., Lai, S.-P., Mundy, L. G., et al. 2007, ApJ, 667, 288
- Comerón (2008) Comerón, F. 2008, The Lupus Clouds, ed. Reipurth, B., 295–+
- Comerón et al. (2003) Comerón, F., Fernández, M., Baraffe, I., Neuhäuser, R., & Kaas, A. A. 2003, A&A, 406, 1001
- Cutri et al. (2003) Cutri, R. M., Skrutskie, M. F., van Dyk, S., et al. 2003, VizieR Online Data Catalog, 2246, 0
- Devillard (1997) Devillard, N. 1997, The Messenger, 87, 19
- Duchêne et al. (2010) Duchêne, G., McCabe, C., Pinte, C., et al. 2010, ApJ, 712, 112
- Dutrey et al. (1996) Dutrey, A., Guilloteau, S., Duvert, G., et al. 1996, A&A, 309, 493
- Eiroa et al. (2002) Eiroa, C., Oudmaijer, R. D., Davies, J. K., et al. 2002, A&A, 384, 1038
- Epchtein et al. (1997) Epchtein, N., de Batz, B., Capoani, L., et al. 1997, The Messenger, 87, 27
- Fernández & Comerón (2001) Fernández, M. & Comerón, F. 2001, A&A, 380, 264
- Fernández & Comerón (2005) Fernández, M. & Comerón, F. 2005, A&A, 440, 1119
- Furlan et al. (2008) Furlan, E., McClure, M., Calvet, N., et al. 2008, ApJS, 176, 184
- Gondoin (2006) Gondoin, P. 2006, A&A, 454, 595
- Hartmann et al. (1997) Hartmann, L., Cassen, P., & Kenyon, S. J. 1997, ApJ, 475, 770
- Hildebrand (1983) Hildebrand, R. H. 1983, QJRAS, 24, 267
- Houck et al. (2004) Houck, J. R., Roellig, T. L., Van Cleve, J., et al. 2004, in Presented at the Society of Photo-Optical Instrumentation Engineers (SPIE) Conference, Vol. 5487, Optical, Infrared, and Millimeter Space Telescopes. Edited by Mather, John C. Proceedings of the SPIE, Volume 5487, pp. 62-76 (2004)., ed. J. C. Mather, 62–76
- Kitamura et al. (2002) Kitamura, Y., Momose, M., Yokogawa, S., et al. 2002, ApJ, 581, 357
- Kovács (2008) Kovács, A. 2008, in Society of Photo-Optical Instrumentation Engineers (SPIE) Conference Series, Vol. 7020, Society of Photo-Optical Instrumentation Engineers (SPIE) Conference Series
- Krautter et al. (1997) Krautter, J., Wichmann, R., Schmitt, J. H. M. M., et al. 1997, A&AS, 123, 329
- Lada & Wilking (1984) Lada, C. J. & Wilking, B. A. 1984, ApJ, 287, 610
- Lahuis et al. (2006) Lahuis, F., Kessler-Silacci, J. E., Evans, N. J., I., et al. 2006, Tech. rep., Spitzer Science Center
- Lay et al. (1997) Lay, O. P., Carlstrom, J. E., & Hills, R. E. 1997, ApJ, 489, 917
- López Martí et al. (2005) López Martí, B., Eislöffel, J., & Mundt, R. 2005, A&A, 440, 139
- Luhman et al. (2007) Luhman, K. L., Adame, L., D’Alessio, P., et al. 2007, ApJ, 666, 1219
- Luhman et al. (2008) Luhman, K. L., Allen, L. E., Allen, P. R., et al. 2008, ApJ, 675, 1375
- Luhman et al. (2003) Luhman, K. L., Briceño, C., Stauffer, J. R., et al. 2003, ApJ, 590, 348
- Luhman et al. (1997) Luhman, K. L., Liebert, J., & Rieke, G. H. 1997, ApJ, 489, L165+
- Makarov (2007) Makarov, V. V. 2007, ApJ, 658, 480
- Mathis & Whiffen (1989) Mathis, J. S. & Whiffen, G. 1989, ApJ, 341, 808
- Mendoza (1968) Mendoza, E. E. 1968, ApJ, 151, 977
- Merín et al. (2007) Merín, B., Augereau, J.-C., van Dishoeck, E. F., et al. 2007, ApJ, 661, 361
- Merín et al. (2010) Merín, B., Brown, J. M., Oliveira, I., et al. 2010, ApJ, 718, 1200
- Merín et al. (2008) Merín, B., Jorgensen, J., Spezzi, L., et al. 2008, ArXiv e-prints, 803
- Mohanty et al. (2005) Mohanty, S., Jayawardhana, R., & Basri, G. 2005, ApJ, 626, 498
- Morales-Calderón et al. (2009) Morales-Calderón, M., Stauffer, J. R., Rebull, L., et al. 2009, ApJ, 702, 1507
- Nakajima et al. (2000) Nakajima, Y., Tamura, M., Oasa, Y., & Nakajima, T. 2000, AJ, 119, 873
- Natta et al. (2004) Natta, A., Testi, L., Muzerolle, J., et al. 2004, A&A, 424, 603
- Ossenkopf & Henning (1994) Ossenkopf, V. & Henning, T. 1994, A&A, 291, 943
- Pinte et al. (2007) Pinte, C., Fouchet, L., Ménard, F., Gonzalez, J.-F., & Duchêne, G. 2007, A&A, 469, 963
- Pinte et al. (2006) Pinte, C., Ménard, F., Duchêne, G., & Bastien, P. 2006, A&A, 459, 797
- Pontoppidan et al. (2007) Pontoppidan, K. M., Stapelfeldt, K. R., Blake, G. A., van Dishoeck, E. F., & Dullemond, C. P. 2007, ApJ, 658, L111
- Press et al. (1992) Press, W. H., Teukolsky, S. A., Vetterling, W. T., & Flannery, B. P. 1992, Numerical recipes in FORTRAN. The art of scientific computing (Cambridge: University Press, —c1992, 2nd ed.)
- Rieke & Lebofsky (1985) Rieke, G. H. & Lebofsky, M. J. 1985, ApJ, 288, 618
- Robberto et al. (2005) Robberto, M., Beckwith, S. V. W., Panagia, N., et al. 2005, AJ, 129, 1534
- Skrutskie et al. (1996) Skrutskie, M. F., Meyer, M. R., Whalen, D., & Hamilton, C. 1996, AJ, 112, 2168
- Stapelfeldt & Moneti (1999) Stapelfeldt, K. & Moneti, A. 1999, in ESA Special Publication, Vol. 427, The Universe as Seen by ISO, ed. P. Cox & M. Kessler, 521–+
- Tachihara et al. (2007) Tachihara, K., Rengel, M., Nakajima, Y., et al. 2007, ApJ, 659, 1382
- Watson & Stapelfeldt (2007) Watson, A. M. & Stapelfeldt, K. R. 2007, AJ, 133, 845
- Watson et al. (2004) Watson, D. M., Kemper, F., Calvet, N., et al. 2004, ApJS, 154, 391
- Wichmann et al. (1997a) Wichmann, R., Krautter, J., Covino, E., et al. 1997a, A&A, 320, 185
- Wichmann et al. (1997b) Wichmann, R., Sterzik, M., Krautter, J., Metanomski, A., & Voges, W. 1997b, A&A, 326, 211
- Wood et al. (2002) Wood, K., Lada, C. J., Bjorkman, J. E., et al. 2002, ApJ, 567, 1183