The peculiar Horizontal Branch of NGC 2808.
Abstract
We present an accurate analysis of the peculiar Horizontal Branch (HB) of the massive Galactic globular cluster NGC 2808, based on high-resolution far-UV and optical images of the central region of the cluster obtained with HST. We confirm the multimodal distribution of stars along the HB: 4 sub-populations separated by gaps are distinguishable. The detailed comparison with suitable theoretical models showed that (i) it is not possible to reproduce the luminosity of the entire HB with a single helium abundance, while an appropriate modeling is possible for three HB groups by assuming different helium abundances in the range that are consistent with the multiple populations observed in the Main Sequence; (ii) canonical HB models are not able to properly match the observational properties of the stars populating the hottest end of the observed HB distribution, the so called “blue hook region.” These objects are probably “hot-flashers,” stars that peel off the red giant branch before reaching the tip and ignite helium at high . Both of these conclusions are based on the luminosity of the HB in the optical and UV bands and do not depend on specific assumptions about mass loss.
keywords:
Globular clusters: individual (NGC 2808); stars: evolution – Horizontal Branch; ultraviolet: stars1 INTRODUCTION
Galactic globular clusters (GCs) are very old (age –13 Gyr) stellar systems populated by – stars. Initially GCs were thought to be prime examples of simple stellar populations, i.e., populations of coeval stars born with the same initial chemical composition. That situation began to change in the late 70’s with the first spectroscopic surveys that disclosed star-to-star chemical variations of light element abundances within individual clusters (e.g., Cohen 1978). These variations are now known to be present in a large fraction of GCs and appear in the form of well defined anticorrelations between the abundances of C-N, Na-O and Mg-Al pairs, that cannot be explained in terms of evolutionary/mixing effects (see, e.g., Gratton et al. 2000, Carretta et al. 2008, 2009). In addition there is growing observational evidence for helium (He) abundance variations within a few clusters which we discuss below. The presence of specific chemical patterns supports a scenario invoking multiple star formation events in some, perhaps most, GCs. These took place at the very beginning of the cluster evolution on relatively short time-scales, of the order of Myr. The younger generations could have been born out of gas enriched by the winds of intermediate mass Asymptotic Giant Branch stars (AGBs; e.g., Ventura et al. 2009) or massive fast rotating stars (Decressin et al. 2007) formed during the first star formation episode. Dynamical simulations, e.g., by D’Ercole et al. (2008) and Decressin et al. (2008), have investigated how these winds could have been retained by the clusters an incorporated into future generations of stars.
One of the challenges facing self-enrichment scenarios in a few clusters is that they must be able to account for appreciable differences in the helium mass fraction () between different generations, with reaching values up to twice the primordial abundance while at the same time not appreciably altering the abundances of most other elements like iron. A notable exception is Centauri (NGC 5139), where the Main Sequence (MS) splitting detected by Bedin et al. 2004 has been interpreted as due to He variation (with the richest population having ; Piotto et al. 2005) and where at least five distinct populations with different iron content and possibly different ages have been revealed (Pancino et al. 2002, Ferraro et al. 2004, Sollima et al. 2005, Villanova et al. 2007, Calamida et al. 2009). However Cen may not be a genuine GC, but rather the remnant of a dwarf galaxy partially disrupted by the interaction with the Milky Way (Bekki & Freeman 2003, Mackey & Van den Bergh 2005). A similar system (Terzan 5) harboring two distinct populations with different iron content and (possibly) ages has been recently found in the Galactic Bulge (Ferraro et al. 2009). Similarly, this system is suspected to be not a genuine GC, but instead the remnant of a larger system that contributed to the formation of the Galactic Bulge. A milder evidence of internal spread of the metal content ( [Fe/H] ) has been observed also in M22 (Marino et al. 2009; Da Costa et al. 2009).
In the context of the multi-population scenarios, one of the most puzzling cases is that of NGC 2808. The first photometric observations (Harris 1974, Ferraro et al. 1990) revealed a Horizontal Branch (HB) with a very complex structure. The cluster HB is well populated both at colours redder than the RR Lyrae instability strip and along its hot blue tail (BT) that covers a range of mag below the mean level of the instability strip. This morphology is not easily explained in terms of the cluster metallicity (), since it is well outside the common paradigm that links red HBs to metal-rich GCs and blue-HBs to metal-poor systems. In this sense NGC 2808 is similar to other very massive (and much more metal rich) GCs, like NGC 6388 and NGC 6441 (Rich et al. 1997, Busso et al. 2007, Dalessandro et al. 2008). The cluster colour-magnitude-diagram (CMD) also shows puzzling discontinuities in the stellar distribution along the BT (Sosin et al. 1997, also Bedin et al. 2000, Castellani et al. 2006, Iannicola et al. 2009) similar to those found in several other GCs (Ferraro et al. 1998).
D’Antona et al. (2005) first noticed a broadening of the NGC 2808 MS which was incompatible with photometric errors. They suggested that the MS consisted of two components with the same age and [Fe/H], but different initial He abundances, with for the He-rich component. The complex MS structure was confirmed by an accurate photometric and proper motion analysis with deep Hubble Space Telescope (HST) data (Piotto et al. 2007). They found that the MS of NGC 2808 splits into three sub-populations, all with age Gyr and for the red-MS, for the mean-MS and for the blue-MS. D’Antona et al. (2005) further hypothesized that the complex HB is connected to the MS components with different He abundances. 111Even though NGC 2808 is one of the most massive clusters and shows the presence of three distinct stellar populations characterized by quite different He abundances, ther is no evidence of appreciable [Fe/H] variations (Carretta et al. 2006). However their HB morphology analysis was performed in the optical bands where the increase of the bolometric corrections at high effective temperature turns the HB into an almost vertical structure (rather than horizontal) when K. Along this vertical part of the HB, models with different initial He abundance tend to overlap, and the identification of sub-populations with different initial is not independent of assumptions about the amount of mass lost along the RGB phase. Ferraro et al. (1998) and Rood et al. (2008) suggest that the optimal diagram for the study of blue HB stars is the (, ) CMD in the HST filter system. In this CMD the hottest HB stars are the most luminous and lie along almost horizontal sequences, whose luminosity is very sensitive to the initial abundance irrespective of the precise value of the stellar mass.
Here we present an accurate photometric study of the central regions of NGC 2808, based on high-resolution HST observations in far-UV and optical filters. With evolutionary models and constraints on the initial distribution coming from the analysis of the multiple MS, we investigate the complex structure of the HB of this massive GC. The paper is structured as follows. Section 2 describes the observational data, their reduction and calibration, Sect. 3 presents an analysis of the observed properties of the cluster HB, and Sect. 4 details their interpretation in term of theoretical models. A summary and the conclusions follow in Sect. 5.
2 Observations and data reduction
We used a set of images (Prop. 6864, P.I. Fusi Pecci) covering optical to far-UV wavelengths, obtained with the Wide Field Planetary Camera 2 (WFPC2) on board the HST. The WFPC2 is a mosaic made of four pixels cameras, with angular resolutions of pixel for the Planetary Camera (PC) and pixel for the three Wide Field Cameras (WF2, WF3 and WF4). The optical dataset consists of images, three with exposure time sec and two with sec, plus images with exposure time sec. The far-UV database comprises images with sec each. All the images have the same pointing, with the cluster centre roughly centred in the PC (see Figure 1). We combined the images using the IRAF task imcombine in order to improve the signal to noise ratio and decontaminate them from cosmic rays, which are particularly prominent in long exposure data. For a given passband and exposure time we adopted the resulting median frame as reference image for the data reduction. As done in our previous work (see for example Dalessandro et al. 2009), the data reduction of the optical images was performed using the ROMAFOT package (Buonanno et al. 1983), specifically developed to perform accurate photometry in crowded regions (Buonanno & Iannicola 1984). Because of under-sampling problems related to the Point Spread Function (PSF) of stars in the far-UV images, we used aperture photometry performed with the publicly available software Source Extractor (SExtractor, Bertin & Arnouts 1996). The adopted aperture radii were 2 pixels (corresponding to ) for the WF chips and 3 pixels () for the PC. For the WF cameras, because of strong vignetting problems affecting the upper right corners of all the images, the regions have been excluded from the analysis. In each filter for every star detected, the photometric error has been defined as the standard deviation of all the measures obtained.
The final star list includes all the sources detected in at least 2 filters. Hot stars detected in and not automatically found in the optical data were force-fitted in the optical images. This procedure added 10–15 HB stars in the F336W and F555W images. These stars are typically a magnitude fainter than the TO level in the optical CMD (Fig. 2). This approach allowed us to sample in a proper way both the cool sequences (like MS and RGB) thanks to the optical bands, and the very hot ones (extremely blue HB stars) because of the sensitivity of the far-UV bands to high temperatures.
Our photometric strategy assured a very high degree of completeness in our samples. In particular, selecting stars where they are the brightest and then finding the corresponding stars in the plane where they are faint, guarantees an high completeness level in each plane. The F160BW images are not affected at all by crowding problems, allowing a quite trivial detection of all hotter objects. As a consistency check we counted the intermediate-temperature HB samples in both the optical and UV planes. The samples are virtually identical (240 stars in the optical and 243 in the UV catalogue).


2.1 Photometric calibration, astrometry and centre of gravity
The WFPC2 photometric catalogue has been placed onto the absolute GSCII astrometric system by using the procedures described in Ferraro et al. (2001, 2003). To maximize the number of stars in the WFPC2 Field of View (FOV) adopted as reference for the roto-traslation procedures, we used the photometric catalogue described by Fabbri et al. (2010) that was obtained with the Wide Field Imager (WFI) at the 2.2 m ESO-MPI La Silla telescope, as secondary astrometric standard list. With the help of the CataXcorr package, developed by Paolo Montegriffo at the Bologna Astronomical Observatory, we found some hundreds of stars in common between the WFPC2 and the WFI catalogues. These were used to obtain a very accurate astrometric solution. At the end of the procedure the typical error is both in Right Ascension () and Declination ().
All the magnitudes were transformed to the VEGAMAG photometric system using the procedure described in detail by Holtzman et al. (1995) with the gain settings and ZeroPoints listed in Tab. 28.1 of the HST data handbook. The resulting CMDs are shown in Figs. 2 and 3.
We determined the centre of gravity () of NGC 2808 with an iterative procedure (Montegriffo et al. 1995) by averaging the absolute positions ( and ) of stars lying within from a given point, starting from the centre reported by Harris (1996). As done in previous papers (see Lanzoni et al 2007 for an example) we selected four different sub-samples of stars with different magnitude limits (, 19.5, 19 and 18.5) to avoid incompleteness effects in the central region. The average of the four derived values has been adopted as and it is located at and , northeast from the centre quoted by Harris (1996).
3 The observed horizontal branch populations
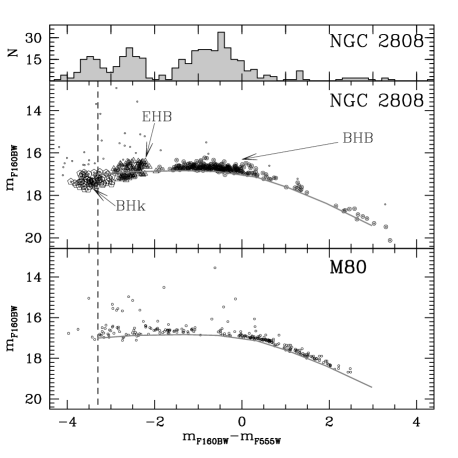
In the canonical view, the HB is expected to be populated by stars with different masses, decreasing from cold to hot effective temperatures, all undergoing central He-burning and shell H-burning. Given that the mass of the He-core at the start of the HB phase (Zero Age Horizontal Branch–ZAHB) is almost constant () and equal to the core mass at the He-flash, the location of each star along the HB is essentially determined by the mass of the surrounding envelope that survives the mass-loss episodes during the RGB phase. From the observational point of view, the first physical parameter affecting the HB morphology is the metallicity. Metal rich clusters usually have red HBs, while the metal-poor ones tend to have HBs populated at bluer colours. However, at least one additional, or second, parameter is required to explain the observed colour distributions of HB stars in Galactic GCs. This second parameter problem has received much attention during the last four decades (see for example Gratton et al. 2010 and references therein). Age has been the most commonly discussed second parameter (Lee et al. 1994; Dotter et al. 2010; Gratton et al. 2010). Very recent work by Gratton et al. (2010) and Dotter et al. (2010) shows that age as a global second parameter can account for general HB parameters such as mean colour and length of the HB. However, HB morphologies show a diversity which cannot be fully characterized by mean properties. Sets of clusters with similar metallicities (M3/M13/M80, see Ferraro et al. 1998; 47 Tuc/NGC 6388/NGC 6441, Rich et al. 1997) have HBs distinguished by gaps and long blue tails. Features like these have prompted discussion of additional parameters like mass-loss efficiency during the RGB (Rood et al. 1993; Ferraro et al. 1998; Dotter 2008) or initial He abundance differences (D’Antona et al. 2002). The situation is still more complicated because deviations from the general behaviour arise due to internal second or third parameters that may vary from cluster to cluster. In this context NGC2808 is a particulary interesting case which certainly requires an accurate and detailed comparison between observations and state-of-the-art theoretical models. As shown in Figs 2 and 3, the HB of NGC 2808 is characterized by a well populated red clump and, on the blue side, a well populated and extended blue sequence reaching down to , almost 2 magnitudes fainter than the MS turn-off (TO).
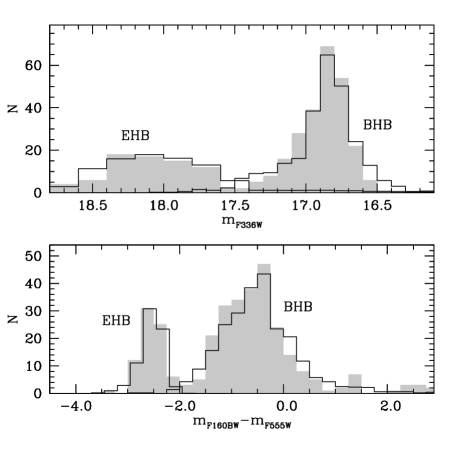
By combining observations in optical and far-UV bands we can sample HB stars according to their temperatures and spectral type. The strategy adopted here is to select stars along the HB in the most appropriate CMD according to their temperature. Hence, the red clump stars have been selected in the optical CMD (, ), that is more sensitive to relatively cool stars, while the hottest HB stars were selected in the far-UV CMD, where they are the most luminous sources. These selection criteria allow also a more accurate distinction between pure HB and post-HB stars. The intermediate-temperature HB population has been selected in both CMDs, and it was used a link between the cool and the hot part of the HB, as well as to define normalization criteria and the relative incompleteness of the two samples. Two under-populated narrow regions (or “gaps”) are apparent in Figures 2 and 3. These gaps were previously identified by Bedin et al. (2000; hereafter B00) at and and the location in our CMD (at and ) is well consistent with previous estimates. The two gaps split the HB in 4 subgroups (if we also consider the standard subdivision at the cool and hot sides of the RR Lyrae instability strip), that were named RHB, EBT1, EBT2 and EBT3 by B00 (see also Castellani et al. 2006; Iannicola et al. 2009, hereafter I09). For sake of homogeneity with previous work of our group, we will use the nomenclature introduced by Dalessandro et al. (2008), and we will denote the four sub-populations as red HB (RHB), blue HB (HB), extreme HB (EHB) and blue-hook (BHk), respectively. The physical properties of these 4 sub-groups will be discussed in the following section.
Because of well known vignetting problems affecting the upper-right corner of all F160BW images (see Sect. 2), we restrict our analysis to stars with distances from . The selected populations are shown with different symbols in Figs. 2 and 3. The total HB sample in our catalogue is 616 stars: 256 RHB, 243 BHB, 66 EHB and 51 BHk sources. They correspond, respectively, to , , and of the total. These ratios are in agreement with those reported by I09 and are compatible with those quoted by B00. We found 4 RR Lyrae in common between the variable star list published by Samus et al. (2009) and Corwin et al. (2004) and our BHB sample. Given the small number, their inclusion doesn’t effect the comparison with theoretical models performed in the following sections, nor the results obtained in this work.
To fully appreciate the oddity of NGC 2808’s HB, it is useful to compare it to a “normal” blue tail cluster, M80. Of the clusters we’ve studied in the far-UV, M80 has the most extended BT. Its CMD along with that of NGC 2808 is shown in Figure 3. To facilitate comparison the colour and magnitude have been shifted to compensate for the difference in reddening and distance modulus between M80 and NGC 2808 as determined by demanding that lower envelopes of the two BHBs match in the interval and added a fiducial. The fiducial marks the lower envelope of the M80 HB.222Using ZAHBs of different metallicity we have determined that it is reasonable to use the shifted M80 fiducial for NGC 2808 despite the difference in metallicity. There are two dramatic differences: first, the HB of NGC 2808 is more extended toward high temperatures than that of M80; second, if the fiducial is linearly extrapolated to higher temperature many of the NGC 2808 stars lie below the fiducial. To fit the observed NGC 2808 sequence the fiducial would have to hook downward. While these differences become evident in far-UV CMDs, they are barely recognizable in purely optical diagrams.
The spatial distribution of a stellar population can give information about its origin. Figure 4 shows the cumulative radial distributions of the 4 HB subgroups. The RHB, BHB, EHB and BHk stars have similar radial distributions within the WFPC2’s FOV. A Kolmogorov-Smirnov (KS) test shows that there are no statistically significant differences between the radial distributions of these 4 sub-populations. The strongest discrepancy is found between RHB and BHB stars, but it is significant only at the level. I09 and B00 found similar results over the area covered by our data. I09 did find significant changes in the ratios of the different HB subgroups between the centre and their outer zone ().

4 Theoretical analysis
We have compared our photometry with an appropriate set of BaSTI -enhanced HB tracks and isochrones (Pietrinferni et al. 2006) for close to the old Zinn & West (1984) value of . Current spectroscopic estimates are larger (, Rutledge et al. 1997; or , Carretta et al. 2009). A change of 0.2 in [Fe/H] shifts a ZAHB by 0.08 mag. A comparison with the observations can be made with a compensating shift in distance modulus.
We considered the entire set of initial He abundances available in the BaSTI database, i.e. Y=0.248, 0.300, 0.350 and 0.400.
The bolometric corrections to the WFPC2 bands have been determined using the -enhanced spectral library by Castelli & Kurucz (2004)—the same one adopted by Pietrinferni et al. (2006)—and following the procedure outlined by Girardi et al. (2002). This method allows a straightforward calculation of the effect of extinction in the adopted filters, and its dependence on both effective temperature () and surface gravity. We adopted the Cardelli, Clayton & Mathis (1989) extinction law, with .
The spectroscopic study by Pace et al. (2006) showed that in NGC 2808 HB stars hotter than K have surface [Fe/H], [Cr/H] and [Ti/H] values around solar or even higher (up to , where X is the abundance of one of these three metals) due to radiative levitation in the atmosphere. In the ZAHB models and HB tracks here adopted we mimic this effect by applying bolometric corrections appropriate for when is between 12,000 K and 13,000 K, and, when the temperature is higher, bolometric corrections appropriate for , based on the spectroscopical evidence provided by Pace et al. (2006, see their Figure 4).
This is in principle a crude approximation, but extended (in both mass and initial chemical composition) grids of HB stellar evolution and atmosphere models that include consistently the effect of radiative levitation (see , e.g. Hui-Bon-Boa, LeBlanc & Hauschildt 2000, and Michaud, Richer & Richard. 2008 for first results on this topic) are still lacking. Also, it appears that additional mixing processes (e.g. meridional circulation) must be coupled to the effect of radiative levitation, in order to explain the abrupt disappearance of the surface abundance anomalies at 11000-12000 K (see, e.g., Quievy et al. 2009).
It is clear that our way to simulate the effect of radiative levitation is just an approximation, that cannot take into account a possible stratification of the metal abundances in the atmosphere and below the photosphere. In the following we will however show how this treatment seems to be reasonably appropriate.
4.1 Determination of the cluster reddening and distance modulus
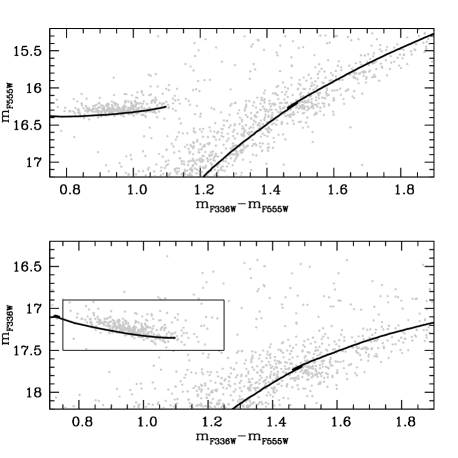
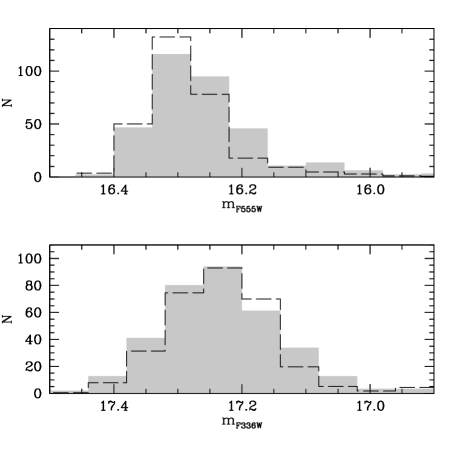
As a first step we determined a reference distance modulus and extinction by fitting our HB models to the RHB. First, we produced synthetic samples of HB stars by following the techniques pioneered by Rood (1973; see also Ferraro et al. 1999) and compared separately the magnitude distributions of synthetic RHB stars in the and filters to the observed ones for the stars populating the box displayed in the lower panel of Figure 5. RHB stars are too faint in the filter to provide any additional constraint.
We used the set of models with for the RHB stars. The synthetic samples have four free parameters: extinction, distance modulus , mean HB stellar mass and its dispersion . We started by randomly selecting the stellar mass from a Gaussian distribution centred around a given guess value of , with 1 dispersion . The WFPC2 magnitudes of the synthetic star were determined according to its position along the appropriate HB track with mass (interpolated, when necessary, among the available set of tracks in the BaSTI database) after an evolutionary time . We determined assuming that the stars reach the ZAHB with a constant rate. We employed a flat probability distribution ranging from zero to , where is the time spent along the HB (we consider as the end of the HB phase the time when the central He-abundance drops to zero). The star with the lowest mass has the longest central He-burning lifetime (Castellani et al. 1994, Cassisi et al. 2003) and sets . This implies that for some masses the randomly selected value of will be longer that their HB lifetime, or in other words that they have already evolved to the following evolutionary stages.
We modifed these synthetic magnitudes accounting for distance modulus and extinction. We used as broad guidelines the results from previous investigations (e.g. Bedin et al. 2000), exploring a range of extintion values –0.20, and distance modulus –15.5. We finally added a Gaussian random error with 1 dispersion, equal to that obtained from the data reduction process. We then compared the resulting synthetic distribution of and values to the observed one, and modified the values of the four free parameters until the mean magnitude and 1 dispersion equal the observed ones in both and .
For each choice of the four free parameters we have produced 200 synthetic distributions, each of them with the same number of objects as in the observational sample. The synthetic star counts as a function of magnitude displayed in the rest of the paper are average values from these ensembles of simulations.
We found (corresponding to ), , and .
The theoretical ZAHB and the RGB of a 12 Gyr isochrone with shifted according to the best-fit distance modulus and extinction are shown in Figure 5. Figure 6 shows the magnitude distributions for the RHB stars in the observed (shaded histogram) and synthetic (dashed histogram), for the best fit parameters obtained above. We also checked—comparing theoretical and observed star counts along the RGB—that the magnitude of the so-called RGB bump is well reproduced in both and by the 12 Gyr theoretical isochrone, for the combination of distance modulus and extinction determined from the HB.
By considering the initial mass of the objects populating the tip of the RGB in the 12 Gyr isochrone, we found that the mean amount of mass lost along the RGB by the population is . This value is very similar to the results of the synthetic modeling of the RHB stars by D’Antona & Caloi (2004), who obtained and a dispersion , using their scaled solar isochrones with approximately the same [Fe/H] of our -enhanced models (and slightly lower ).
4.2 Multiple-He populations along the HB
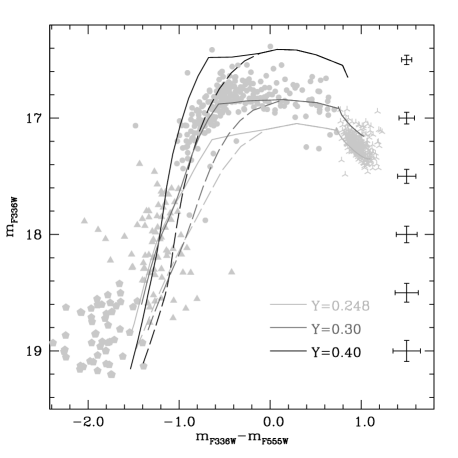
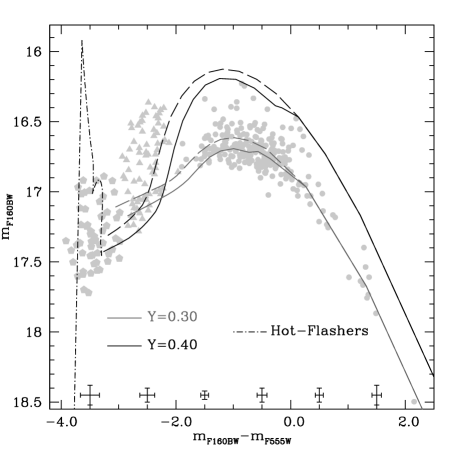
To investigate the nature of the BHB, EHB and BHk populations we used the most appropriate CMDs: the (, ) CMD has been used as a bridge between the RHB and BHB populations, and the (, ) CMD to characterize the BHB, EHB and BHk populations. Prompted by the multiple MS detected in the cluster (Piotto et al. 2007) we used models with different He content for various components of the HB. Figure 7 shows the (, ) CMD of RHB and BHB stars. Using the distance modulus and extinction obtained in the previous section, we also display three ZAHBs with different Helium abundances , 0.30 and 0.40 respectively. For each ZAHB we show two sequences, one that mimics the inclusion of levitation as described above (solid line), and one without levitation (dashed line). We see that:
-
1.
Applying metal-rich bolometric corrections to mimic radiative levitation significantly affects the location of the ZAHB in the high temperature regime, i.e. for . In particular, the “levitation” ZAHB is systematically bluer () than the “no-levitation” ZAHB (or the ZAHB level is brighter at fixed colours).
-
2.
The BHB stars define a sort of “knee” in the stellar distribution and are significantly brighter than the RHB clump in this plane. Figure 7 shows very clearly that even including radiative levitation, the magnitude level of the BHB sub-population is not reproduced by the ZAHB with canonical helium abundance (): the BHB appears significantly (0.3–0.4 mag) brighter than the canonical ZAHB. On the other hand, the “levitation” ZAHB with matches very nicely the lower envelope of the BHB star distribution.
-
3.
The cooler BHB stars, , are not affected by levitation, yet they still lie significantly above the canonical ZAHB. They are well fit by the ZAHB. The conclusion that for the BHB is greater than of the RHB is independent of levitation and our treatment thereof.
The situation is less clear for EHB and BHk stars because their distribution becomes almost vertical in this CMD, and photometric errors increase significantly the scatter at faint magnitudes. For these reasons we used the (, ) CMD in order to study the properties of these sub-populations. Figure 8 shows the CMD of the three bluest sub-populations, together with the ZAHB for different initial values of , with and without inclusion of levitation. It is interesting to note that in the F160BW filter the inclusion of levitation goes in the opposite direction than in optical filters, making the ZAHB fainter at a given colour. Additional interesting features emerge from this figure:
-
1.
Just as it was in the (, ) CMD, the BHB population is matched by a ZAHB with including the effect of levitation.
-
2.
The EHB population is consistent with a ZAHB with including levitation.
-
3.
The BHk stars are too hot to be reproduced by any ZAHB models, hence they require a more separate discussion (see Section 4.3)
From this comparison we can safely conclude that three (out of four) of the sub-populations along the HB of NGC 2808 can be identified as the progeny of three distinct stellar populations with different initial helium abundances in the range –0.40. The specific values used (, 0.30, 0.40) were set by the model data base, and we have not attempted to determine values of which best fit the data. The adopted values are consistent with what found from the photometry of the MS (Piotto et al. 2007). This conclusion is independent of any assumption about the mass-loss efficiency of their RGB progenitors. Our findings are also in agreement with He abundances reported on the basis of different indicators along the RGB (like difference in colour or ) by Bragaglia et al. (2010). The consistency with these results also justifies our choice (in principle arbitrary) to fix the distance (and extinction) by matching the HB population to the RHB. Had we tried to match these “normal-He” models to, e.g. the BHB population, it would have been impossible then to match the RHB stars with models with any reasonable value of .
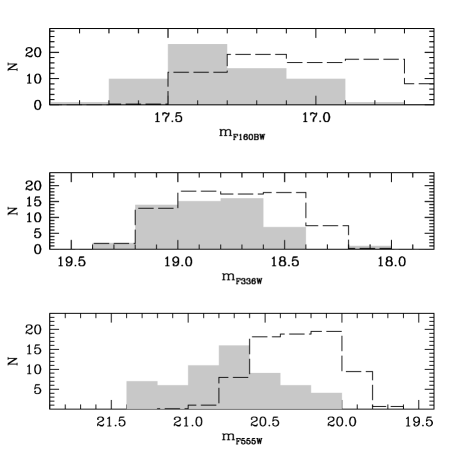
As a second step of our analysis, we determined the mean mass of the BHB and EHB sub-populations, by producing synthetic HBs in the same way as described before, and matching the mode of both the and the () distributions. The synthetic sample compared to the BHB component has been calculated using the HB tracks, while for the EHB we employed the tracks, including the effect of levitation in both cases. Figure 9 compares the observed (shaded histogram) and theoretical (solid histogram) star counts as a function of and the () for the BHB and the bluer EHB component. An indirect estimate of mass-loss experienced by each sub-population can then be obtained by comparing the mean mass on the HB and the mass at the TO (for an age of 12 Gyr). A summary of the values obtained for RHB, BHB and EHB sub-populations is reported in Table 1. Under these assumptions we found a mean amount of RGB mass-loss ranging from for both the RHB and EHB stars, to for the EHB stars.
Finally, in order to verify whether the RHB, BHB and EHB populations are the progeny of the red, mean and blue MS, respectively, we have compared the star counts along the HB, with those reported by Piotto et al. (2007) along the MS. In our sample we found: , and . Starting from the observed MS number counts, and after applying corrections accounting for the different evolutionary lifetimes along the RGB and among the HB populations (i.e., how the lifetime varies as a function of and mass) the expected number of stars along the HB would be: and . Clearly, while the two values of are compatible, it is not possible to reconcile the observed and the expected values of . The ACS data used by Piotto et al. (2007) are strongly off-centred () with respect to . As shown by I09, the ratio roughly doubles for . This may be a possible explanation for the observed discrepancy. However the progenitor masses for RHB and BHB are respectively and (see Table 1). Dynamical evolution of the cluster should cause the to decrease as increases, just the opposite of what was found by I09. A more detailed study of radial variations in HB sub-populations extending over the full cluster could be illuminating. It would also be quite interesting to check whether the triple MS varies with position in the cluster.
4.3 The Blue Hook population
The CMDs in Figs. 7 and 8 show very clearly that BHk stars are not reproduced by any of the theoretical models, this sub-population is systematically hotter than the hottest point along the ZAHBs. To shed more light on the nature of these stars, in Fig. 10 we compare the observed number count distributions for the BHk sub-population in the , and magnitudes, with a synthetic sample with , a mean mass (i.e. the minimum possible mass of HB objects for our models at this metallicity) and zero dispersion. It is impossible to match the observed distributions in all three filters.
This inability of HB models to reproduce the BHk population suggests that these are not genuine HB stars, and it leads us to identify these objects as hot-flashers (D’Cruz et al. 1996; Brown et al. 2001, 2010; Cassisi et al. 2003; Moehler et al. 2004).
Hot-flashers are stars that experience strong mass-loss during the RGB phase, leave the branch before the occurrence of the He-flash, and move quickly to the He-core white dwarf cooling curve, where they experience a He-flash under conditions of strong electron degeneracy in their core. This scenario was envisaged earlier by Castellani & Castellani (1993) who named these peculiar stellar objects “red giant stragglers.” Stars that ignite helium on the white dwarf cooling sequence have a much less efficient H-burning shell, and will undergo extensive mixing between the He-core and the H-rich envelope (Cassisi et al. 2003). This makes the progeny of hot-flashers hotter and fainter than genuine HB stars (i.e. stars that ignite He along the RGB), describing a kind of hook in UV CMDs that gives the name to this class of objects. The presence of such peculiar sources in NGC 2808 has been already noted by pure UV analysis by Brown et al. (2001) and Dieball et al. (2005). As shown in Figure 8, the location of BHk stars is indeed reproduced by a hot-flasher model (dashed-dotted line) from Cassisi et al. (2003) for a mass .333The bolometric corrections used in the hot-flasher model displayed in Figure 8 have been obtained from scaled-solar model atmospheres, accounting for the effect of levitation as described in Section. 4. As shown by Brown et al. (2001), scaled solar spectra do not accurately represent the peculiar atmospheres of hot-flashers, which are expected to have strongly enhanced He and C abundances. Therefore, for the hot-flasher model one should in principle use more appropriate—but not yet publicly available—bolometric corrections, that however, should not alter the basic qualitative conclusions of our analysis.
The use of hot-flasher models with different total mass would not greatly modify the outlined scenario since all hot-flasher models tend to cluster in a very narrow region of the CMD, regardless of their total mass (Brown et al. 2001; see also Miller Bertolami et al. 2008). Also, the effect of the initial chemical composition on the location in is minor, at least at subsolar metallicities (see Miller Bertolami et al. 2008). As a consequence it is not trivial to understand which sub-population produces the BHks. Potentially star counts derived from MS analysis might shed light on this point. Hypothesizing three different progenitors for BHks we obtain , and . In all cases adding the BHk stars to a given HB sub-populations makes the disagreement with the ratios expected from Piotto et al. (2007) worse.
Bailyn (1995) has suggested that hot HB stars in a number of clusters have a binary origin. On the other hand a recent spectroscopic analysis (Moni Bidin et al. 2006) of a sample of hot HB stars in NGC 6752 found no close binaries. Neither of these studies have direct application to the case of NGC 2808. Bailyn’s arguments apply to sdB stars which are probably EHB stars (Dorman et al. 1993). Our preliminary results indicate that NGC 6752 has no BHk stars, so the Moni Bidin result also applies to EHB stars. Our results here clearly show that EHB and BHk stars are not the same thing. One must be quite precise in defining these hot populations. Specifically in NGC 2808, Piotto et al. 2007 tentatively suggest that their observed binary sequence might be connected with the BHk stars, and they note that the binary fraction and BHk fraction are similar. Most GCs have binary stars, and most of these contain exotic populations like BSS which are produced by binary evolution. On the other hand, BHk stars are found in only a very few GCs. If binaries are producing BHk stars, they should be found in most GCs. So far genuine BHk stars have been found only in the most massive clusters most of which have multiple populations. This must be telling us something about their origin.
4.4 The HB temperature distribution
The combined use of far-UV and optical filters allows us to properly
visualize the different HB sub-populations and reveal the existence of
gaps, avoiding artificial features generated by the
saturation of the chosen colour index as it becomes insensitive to
changes in . The bottom panel of Figure 9 shows,
for example, how the HB distribution in the () colour
separates very clearly the EHB and BHB sub-populations.
In order to obtain the distribution in temperature of the different HB groups,
we first derived from the observed and dereddened colours
by interpolating a spline along the colour- relation given by the appropriate
theoretical ZAHBs.
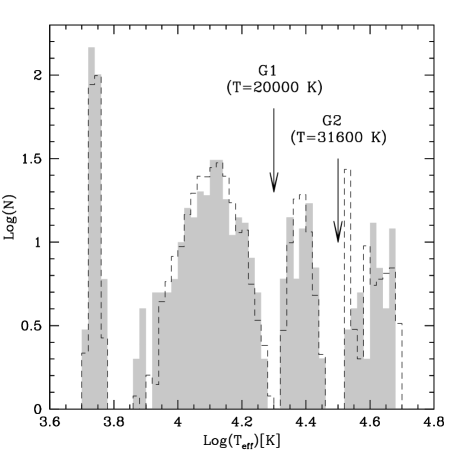
The result is shown as grey histogram in Figure 11.
This approach neglects the post-ZAHB evolutionary effects on the colour- relation
which however are small.
In fact the derived distributions have been found to be fully compatible with those directly
obtained from the synthetic models (dashed histograms in Figure 11).
The distribution displayed in Figure 11 appears
clearly multimodal, as expected. Each peak observed in this
distribution belongs unequivocally to only one of the 4
sub-populations. The effective temperatures spanned by the HB stars
in NGC 2808 cover the range K. The RHB
has a distribution peaked at K, the BHB peaks
at K, the EHB at K,
while BHk stars are centreed around K. The
gaps G1 and G2, that we have found at and
, are located at K and
K, respectively. The temperatures of these two
gaps ( in particular) are slightly hotter than those
( K and K) estimated by Sosin et
al. (1997). These latter values are based on models with a constant
and standard () He abundance. Moreover, since they were
unable to fit both the optical and near UV data with the same distance
modulus and reddening values, they applied colour shifts (for example
towards the red in the optical CMD) that may
explain the discrepancies in the gaps’ temperatures. Our estimate for
and are much more compatible with the
temperatures estimated by the spectroscopic observations of a sample
of EHB and BHk stars by Moehler et al. (2004; see their Table 4 and
their Figure 2). Their BHk candidates have typically K, while the few EHB stars observed are distributed in
the temperature interval . Our estimated
highest temperature along the HB is substantially higher than the
value () reported by Recio-Blanco et al. (2006) from optical CMDs.
This
once more demonstrates the difficulties of deriving the properties of
extremely hot HB populations from pure optical CMDs. In the optical
CMD a star moves down the BT as the bolometric correction increases
with or the stellar luminosity decreases. For BHk stars
both are changing and optical colours cannot give a reliable . However it is important to note also that the temperatures
estimated for BHks are affected by large uncertainties that are not
easily quantifiable. They are due to the lack of a proper treatment
of the peculiar chemical composition of their atmospheres and to the
photometric errors that become larger in .
| POP | ( | ||||
|---|---|---|---|---|---|
| RHB | 0.248 | 0.84 | 0.69 | 0.15 | 5,400 |
| BHB | 0.30 | 0.76 | 0.565 | 0.195 | 12,600 |
| EHB | 0.40 | 0.627 | 0.479 | 0.148 | 24,000 |
5 Summary
We have analyzed the complex, multimodal HB of NGC 2808 as a prototype for a series of studies of hot HB stellar populations. We found that a combination of optical and far-UV magnitudes is the most powerful tool to efficiently analyze multimodal HBs with extremely blue components, in terms of both comparisons with theoretical models and direct star count analyses. By following this approach, the presence of He-enhanced populations along the blue part of the HB can be inferred without making assumptions about the RGB mass-loss. This cannot be done using only optical CMDs because HB sequences with different initial overlap for K, where the HB becomes almost vertical because of the large increase of the bolometric corrections with . We have used here the (, ) CMD to study the RHB and BHB stars and the (, ) plane for hotter sub-populations (EHBs and BHks). BHB stars have been used as “reference” population to check the completeness level of the samples observed in the two different planes.
From the comparison of theoretical ZAHB sequences with observations, we confirm that the peculiar HB of NGC 2808 cannot be reproduced by a population with a single initial He abundance, instead we need the combination of three different populations with different helium abundances ranging from to 0.40. Our models use , 0.30, 0.40 which are consistent with those inferred by Piotto et al. (2007) from the observed split of the cluster MS. Using synthetic HB simulations we find that the CMD of the RHB sub-population is well matched by models with standard initial values ( in this case) and an average mass . The BHB stars can be reproduced by models with and . The EHB sub-population is matched by models with with , that might be the progeny of the blue-MS population. These latter stars arrive on the ZAHB with a very tiny H envelope, that results in surface temperatures K, with a total mass . By comparing the average mass of the three sub-populations along the HB with those at the RGB tip for a 12 Gyr isochrones, and the appropriate values of , we find that the populations have experienced an average mass-loss in the range . On the basis of HB evolutionary tracks and synthetic HB modeling we find that the HB of NGC 2808 is one of the most extended in temperature, with stars spanning the interval K. These temperatures, estimated from stellar evolutionary models, are consistent with those derived from spectroscopic observations by Moehler et al. (2004), but significantly larger than those determined from optical CMDs.
UV magnitudes for stars with K are affected by the levitation of heavy elements greatly increasing atmospheric opacity. We have crudely modeled the effects of levitation by employing bolometric corrections appropriate for metallicities much higher than that of NGC 2808. The resulting models agree quite well with the observations especially for the BHB. Still, because of this approximate treatment our values for and the masses of the HB sub-populations are uncertain. However, our result that there are 3 populations with helium abundances spanning a range of roughly 0.15 in is quite robust.
Even models with extremely large abundances are not able to reproduce the location of the BHk stars. This sub-population has been interpreted here as hot-flashers, the result of He-flash ignition along the He-core white dwarf cooling sequence. Why these stars are present in a few massive clusters and absent in other clusters with comparably long blue tails is a challenge to stellar evolution theory.
A comparison between HB and MS sub-populations relative ratios reveals that while is compatible with , it is non-trivial to explain the discrepancy between the values obtained for and . The four sub-populations (RHB, BHB, EHB and BHk) show the same radial trend for , in agreement with previous findings (see B00 and I09). However, there is some evidence that the sub-population ratios might vary over larger radial distances (I09). Studies of radial variation of the various populations covering the entire cluster coupled with detailed modeling of dynamics would be valuable.
This paper is the first in a series which will make a detailed
comparison between theoretical models and observations of blue tail HB
clusters.
We thank the referee Aaron Dotter for the useful comments that improved the presentation of this work. This research was supported by the Agenzia Spaziale Italiana (under contract ASI- INAF I/016/07/0), by the Istituto Nazionale di Astrofisica (INAF, under contract PRIN- INAF2008) and by Ministero dell’Istruzione, dell’Universitá e della Ricerca. RTR is partially supported by STScI grant GO-11975. SC acknowledges the financial support of the Ministero della Ricerca Scientifica e dell’Universita’ PRIN MIUR 2007: ‘Multiple stellar populations in globular clusters’ and the Italian Theoretical Virtual Observatory Project.
References
- [Bailyn(1995)] Bailyn, C. D. 1995, ARA&A, 33, 133
- [(Bedin et al.(2000)] Bedin, L. R., Piotto, G., Zoccali, M., Stetson, P. B., Saviane, I., Cassisi, S., & Bono, G. 2000, A&A, 363, 159
- [Bedin et al.(2004)] Bedin, L. R., Piotto, G., Anderson, J., Cassisi, S., King, I. R., Momany, Y., & Carraro, G. 2004, ApJl, 605, L125
- [Bertin & Arnouts(1996)] Bertin, E., & Arnouts, S. 1996, A&AS, 117, 393
- [Bekki & Freeman(2003)] Bekki, K., & Freeman, K. C. 2003, MNRAS, 346, L11
- [Bragaglia et al.(2010)] Bragaglia, A., Carretta, E., Gratton, R., D’Orazi, V., Cassisi, S., & Lucatello, S. 2010, arXiv:1005.2659
- [Byun & Lee(1991)] Byun, Y.-I., & Lee, Y.-W. 1991, The Formation and Evolution of Star Clusters, 13, 243
- [Brown et al.(1991)] Brown, J. H., Burkert, A., & Truran, J. W. 1991, ApJ, 376, 115
- [Brown et al.(1995)] Brown, J. H., Burkert, A., & Truran, J. W. 1995, ApJ, 440, 666
- [Brown et al.(2001)] Brown, T. M., Sweigart, A. V., Lanz, T., Landsman, W. B., & Hubeny, I. 2001, ApJ, 562, 368
- [Brown et al.(2010)] Brown, T. M., Sweigart, A. V., Lanz, T., Smith, E., Landsman, W. B., & Hubeny, I. 2010, arXiv:1006.1591
- [Buonanno et al. (1983)] Buonanno, R., Buscema, G., Corsi, C. E., Ferraro, I., & Iannicola, G. 1983, A&A, 126, 278
- [Buonanno & Iannicola (1989)] Buonanno, R., & Iannicola, G. 1989, PASP, 101, 294
- [Busso et al.(2007)] Busso, G., et al. 2007, A&A, 474, 105
- [Calamida et al.(2009)] Calamida, A., et al. 2009, ApJ, 706, 1277
- [Cardelli et al.(1989)] Cardelli, J. A., Clayton, G. C., & Mathis, J. S. 1989, ApJ, 345, 245
- [Carretta et al.(2006)] Carretta, E., Bragaglia, A., Gratton, R. G., Leone, F., Recio-Blanco, A., & Lucatello, S. 2006, A&A, 450, 523
- [Carretta et al.(2008)] Carretta, E., Bragaglia, A., Gratton, R. G., & Lucatello, S. 2008, arXiv:0811.3591
- [Carretta et al.(2009)] Carretta, E., Bragaglia, A., Gratton, R., D’Orazi, V., & Lucatello, S. 2009, A&A, 508, 695
- [Casetti-Dinescu et al.(2007)] Casetti-Dinescu, D. I., Girard, T. M., Herrera, D., van Altena, W. F., López, C. E., & Castillo, D. J. 2007, AJ, 134, 195
- [] Cassisi, S., Salaris, M., & Irwin, A.W. 2003, ApJ, 588, 862
- [Castelli & Kurucz(2004)] Castelli, F., & Kurucz, R. L. 2004, arXiv:astro-ph/0405087
- [Castellani & Castellani(1993)] Castellani, M., & Castellani, V. 1993, ApJ, 407, 649
- [Castellani et al.(1994)] Castellani, M., Castellani, V., Pulone, L., & Tornambe, A. 1994, A&A, 282, 771
- [Castellani et al.(2006)] Castellani, V., Iannicola, G., Bono, G., Zoccali, M., Cassisi, S., & Buonanno, R. 2006, A&A, 446, 569
- [Cohen(1978)] Cohen, J. G. 1978, ApJ, 223, 487
- [Corwin et al.(2004)] Corwin, T. M., Catelan, M., Borissova, J., & Smith, H. A. 2004, A&A, 421, 667
- [Da Costa et al.(2009)] Da Costa, G. S., Held, E. V., Saviane, I., & Gullieuszik, M. 2009, ApJ, 705, 1481
- [Dalessandro et al.(2008)] Dalessandro, E., Lanzoni, B., Ferraro, F. R., Rood, R. T., Milone, A., Piotto, G., & Valenti, E. 2008, ApJ, 677, 1069
- [Dalessandro et al.(2009)] Dalessandro, E., Beccari, G., Lanzoni, B., Ferraro, F. R., Schiavon, R., & Rood, R. T. 2009, ApJS, 182, 509
- [D’Antona et al.(2002)] D’Antona, F., Caloi, V., Montalbán, J., Ventura, P., & Gratton, R. 2002, A&A, 395, 69
- [D’Antona & Caloi(2004)] D’Antona, F., & Caloi, V. 2004, ApJ, 611, 871
- [D’Antona et al.(2005)] D’Antona, F., Bellazzini, M., Caloi, V., Pecci, F. F., Galleti, S., & Rood, R. T. 2005, ApJ, 631, 868
- [D’Cruz et al.(1996)] D’Cruz, N. L., Dorman, B., Rood, R. T., & O’Connell, R. W. 1996, ApJ, 466, 359
- [Decressin et al.(2007)] Decressin, T., Meynet, G., Charbonnel, C., Prantzos, N., & Ekström, S. 2007, A&A, 464, 1029
- [Decressin et al.(2008)] Decressin, T., Baumgardt, H., & Kroupa, P. 2008, A&A, 492, 101
- [Dorman et al.(1993)] Dorman, B., Rood, R. T., & O’Connell, R. W. 1993, ApJ, 419, 596
- [D’Ercole et al.(2008)] D’Ercole, A., Vesperini, E., D’Antona, F., McMillan, S. L. W., & Recchi, S. 2008, MNRAS, 391, 825
- [Dieball et al.(2005)] Dieball, A., Knigge, C., Zurek, D. R., Shara, M. M., & Long, K. S. 2005, ApJ, 625, 156
- [Dorman et al.(1993)] Dorman, B., Rood, R. T., & O’Connell, R. W. 1993, ApJ, 419, 596
- [Dotter(2008)] Dotter, A. 2008, ApJl, 687, L21
- [Dotter et al.(2010)] Dotter, A., et al. 2010, ApJ, 708, 698
- [Fabbri et al. (2010)] Fabbri et al. 2010, in preparation
- [Ferraro et al.(1990)] Ferraro, F. R., Clementini, G., Fusi Pecci, F., Buonanno, R., & Alcaino, G. 1990, A&AS, 84, 59
- [Ferraro et al.(1998)] Ferraro, F. R., Paltrinieri, B., Pecci, F. F., Rood, R. T., & Dorman, B. 1998, ApJ, 500, 311
- [Ferraro et al.(1999)] Ferraro, F. R., Messineo, M., Fusi Pecci, F., de Palo, M. A., Straniero, O., Chieffi, A., & Limongi, M. 1999, AJ, 118, 1738
- [Ferraro et al.(2001)] Ferraro, F. R., D’Amico, N., Possenti, A., Mignani, R. P., & Paltrinieri, B. 2001, ApJ, 561, 337
- [Ferraro et al.(2003)] Ferraro, F. R., Possenti, A., Sabbi, E., & D’Amico, N. 2003, ApJl, 596, L211
- [Ferraro et al.(2004)] Ferraro, F. R., Sollima, A., Pancino, E., Bellazzini, M., Straniero, O., Origlia, L., & Cool, A. M. 2004, ApJl, 603, L81
- [Ferraro et al.(2009)] Ferraro, F. R., et al. 2009, Nature, 462, 483
- [Girardi et al.(2002)] Girardi, L., Bertelli, G., Bressan, A., Chiosi, C., Groenewegen, M. A. T., Marigo, P., Salasnich, B., & Weiss, A. 2002, A&A, 391, 195
- [Gratton et al.(2000)] Gratton, R. G., Carretta, E., Matteucci, F., & Sneden, C. 2000, A&A, 358, 671
- [Gratton et al.(2010)] Gratton, R. G., Carretta, E., Bragaglia, A., Lucatello, S., & D’Orazi, V. 2010, arXiv:1004.3862
- [Harris(1974)] Harris, W. E. 1974, ApJl, 192, L161
- [Harris (1996)] Harris, W.E. 1996, AJ, 112, 1487
- [Holtzman et al.(1995)] Holtzman, J. A., Burrows, C. J., Casertano, S., Hester, J. J., Trauger, J. T., Watson, A. M., & Worthey, G. 1995, PASP, 107, 1065
- [Hui-Bon-Hoa et al.(2000)] Hui-Bon-Hoa, A., LeBlanc, F., & Hauschildt, P. H. 2000, ApJl, 535, L43
- [Iannicola et al.(2009)] Iannicola, G., et al. 2009, ApJl, 696, L120
- [Lanzoni et al.(2007)] Lanzoni, B., Dalessandro, E., Ferraro, F. R., Miocchi, P., Valenti, E., & Rood, R. T. 2007, ApJl, 668, L139
- [Lanzoni et al.(2010)] Lanzoni, B., et al. 2010, arXiv:1005.2847
- [Lee et al.(1994)] Lee, Y.-W., Demarque, P., & Zinn, R. 1994, ApJ, 423, 248
- [Mackey & van den Bergh(2005)] Mackey, A. D., & van den Bergh, S. 2005, MNRAS, 360, 631
- [Marino et al.(2009)] Marino, A. F., Milone, A. P., Piotto, G., Villanova, S., Bedin, L. R., Bellini, A., & Renzini, A. 2009, A&A, 505, 1099
- [Michaud et al.(2008)] Michaud, G., Richer, J., & Richard, O. 2008, ApJ, 675, 1223
- [Miller Bertolami et al.(2008)] Miller Bertolami, M. M., Althaus, L. G., Unglaub, K., & Weiss, A. 2008, A&A, 491, 253
- [Moehler et al. (2004)] Moehler, S., Sweigart, A. V., Landsman, W. B., Hammer, N. J., & Dreizler, S. 2004, A&A, 415, 313
- [Moni Bidin et al.(2006)] Moni Bidin, C., Moehler, S., Piotto, G., Recio-Blanco, A., Momany, Y., & Méndez, R. A. 2006, A&A, 451, 499
- [Montegriffo et al.(1995)] Montegriffo, P., Ferraro, F. R., Fusi Pecci, F., & Origlia, L. 1995, MNRAS, 276, 739
- [Pace et al.(2006)] Pace, G., Recio-Blanco, A., Piotto, G., & Momany, Y. 2006, A&A, 452, 493
- [Pancino et al.(2002)] Pancino, E., Pasquini, L., Hill, V., Ferraro, F. R., & Bellazzini, M. 2002, ApJl, 568, L101
- [Pietrinferni et al.(2006)] Pietrinferni, A., Cassisi, S., Salaris, M., & Castelli, F. 2006, ApJ, 642, 797
- [Piotto et al.(2005)] Piotto, G., et al. 2005, ApJ, 621, 777
- [] Piotto, G., Bedin, L. R., Anderson, J., King, I. R., Cassisi, S., Milone, A. P., Villanova, S., Pietrinferni, A., & Renzini, A. 2007, ApJ, 661, L53
- [] Quievy, D., Charbonneau, P., Michaud, G., & Richer, J. 2009, A&A, 500, 1163
- [Recio-Blanco et al.(2006)] Recio-Blanco, A., Aparicio, A., Piotto, G., de Angeli, F., & Djorgovski, S. G. 2006, A&A, 452, 875
- [Rich et al.(1997)] Rich, R. M., et al. 1997, ApJL, 484, L25
- [Rood(1973)] Rood, R. T. 1973, ApJ, 184, 815
- [Rood et al.(1993)] Rood, R. T., Crocker, D. A., Fusi Pecci, F., Ferraro, F. R., Clementini, G., & Buonanno, R. 1993, The Globular Cluster-Galaxy Connection, 48, 218
- [Rood et al.(2008)] Rood, R. T., Beccari, G., Lanzoni, B., Ferraro, F. R., Dalessandro, E., & Schiavon, R. P. 2008, Memorie della Societa Astronomica Italiana, 79, 383
- [Rutledge et al.(1997)] Rutledge, G. A., Hesser, J. E., Stetson, P. B., Mateo, M., Simard, L., Bolte, M., Friel, E. D., & Copin, Y. 1997, PASP, 109, 883
- [Samus et al.(2009)] Samus, N. N., Kazarovets, E. V., Pastukhova, E. N., Tsvetkova, T. M., & Durlevich, O. V. 2009, PASP, 121, 1378
- [Sollima et al.(2005)] Sollima, A., Ferraro, F. R., Pancino, E., & Bellazzini, M. 2005, MNRAS, 357, 265
- [Sosin et al.(1997)] Sosin, C., et al. 1997, ApJl, 480, L35
- [Ventura & D’Antona(2009)] Ventura, P., & D’Antona, F. 2009, A&A, 499, 835
- [Villanova et al.(2007)] Villanova, S., et al. 2007, ApJ, 663, 296
- [Zinn & West(1984)] Zinn, R., & West, M. J. 1984, ApJS, 55, 45