The Inner Envelope and Disk of L1527 Revealed: Gemini L′-band Scattered Light Imaging
Abstract
We present high-resolution L′-band imaging of the inner scattered light structure of Class 0 protostar L1527 IRS (IRAS 04368+2557) taken with the Gemini North telescope. The central point-source like feature seen in Spitzer Space Telescope IRAC images is resolved in the Gemini image into a compact bipolar structure with a narrow dark lane in the center. Two scattered light lobes are extended 1.8′′ (200 AU) perpendicular to the direction of the outflow and 2.5′′ (350 AU) along the outflow axis; the narrow dark lane between the scattered light lobes is 0.45′′ (60 AU) thick. The observations are consistent with our initial modeling of a bright inner cavity separated by a dark lane due to extinction along the line of sight of the central protostar by the disk (Tobin et al. 2008). The bright, compact scattered light might be due to complex inner structure generated by the outflow, as suggested in our first paper, or it may more likely be the upper layers of the disk forming from infalling matter.
1 Introduction
In the earliest stages of star formation, the Class 0/I phases (Andre et al., 1993; Lada , 1987), the newborn protostar is embedded within a dense envelope of gas and dust. In the Class 0 phase, little or no emission is generally detected shortward of 10m due to high extinction toward the central object; however, the bipolar outflows from the central protostar and disk carve cavities in the envelopes creating scattered light nebulae visible in the near to mid-infrared (1-8m). The morphology of the outflow cavities then result from a ram pressure balance between the infalling envelope and outflow (Shu et al., 1991).
Early models of infalling envelopes assumed spherical collapse (Shu, 1977) along with slow rotation (Ulrich, 1976; Cassen & Moosman, 1981; Terebey et al., 1984), which were later modified for infall from initially flattened geometries (Hartmann et al., 1996). The rotating collapse model provides a natural route for the formation of circumstellar disks within the protostellar envelope. However, disks in Class 0 objects have been difficult to study primarily because of the surrounding envelope (e.g. Jørgensen et al., 2009) and insufficient resolution at millimeter wavelengths to isolate the protostellar disk. In addition, the small-scale structure of outflow cavities in Class 0 protostars has also been elusive due to the envelope extincting near-IR scattered light emission, shifting the scattered light emission peak into the mid-IR (Tobin et al., 2007, 2008).
One of the nearest low-mass protostars in Taurus (d = 140pc), L1527 IRS (hereafter L1527), has been a favorite target for studies of outflow and envelope structure (e.g. Ohashi et al., 1997; Chandler & Richer, 2000; Robitaille et al., 2007; Tobin et al., 2008; Gramajo et al., 2010). It has been classified as Class 0 protostar (Chen et al., 1995) but could be a Class I system given its edge-on orientation (Ohashi et al., 1997), which enhances the amount of extinction along the line of sight (Tobin et al., 2008). The moderate resolution IRAC images of L1527 from Spitzer reveal bright bipolar cavities extending 10000 AU in radius (Hartmann et al., 2005; Tobin et al., 2008). The outflow cavities are separated by what appears to be a large-scale (1000 AU) dark lane; however, we observed a central point-source between the cavities within the dark lane from 3.6 to 8m. In Tobin et al. (2008, hereafter Paper I), we were able to explain this by constructing a model assuming that the point-source was a compact inner outflow cavity, unresolved by Spitzer, connecting with the larger outer cavity. We then proposed high-resolution mid-IR imaging to test this model.
In this paper, we present high resolution L′-band (3.8m) observations of L1527 from the Gemini North telescope. This is the highest resolution mid-IR image of the inner envelope/outflow cavity around a Class 0 protostar. The observations confirm our prediction of a compact, bipolar scattered light structure; quite similar to the model constructed in Paper I but strongly resembling a disk in scattered light.
2 Observations and Data Reduction
We observed L1527 with the 8.1 meter Gemini North telescope at Mauna Kea on 2009 October 24 and 2009 December 11 using the Near-Infrared Imager (NIRI) in L′-band (3.8m). The camera was used in f/14 mode which provides a 0.049′′ pix-1 scale; we only used the central 512x512 area of the detector for faster read-out which enabled integrations short enough to avoid saturation from sky background. We observed with a standard 5-point “dice-5” dither pattern with 5′′ steps and a nearby star was used for tip-tilt correction and guiding. At each position 150 coadded images of 0.2 seconds were taken; a total of 35 images were taken yielding 16 minutes of integration during the first observation and 176 images totaling 88 minutes of integration during the second observation. However, the first 38 images in the second observation were unusable due to variable sky background. Observations of the standard star HD 22686 show that the seeing was 0.3′′ on both nights.
The raw data were reduced using the Gemini IRAF111IRAF is distributed by the National Optical Astronomy Observatories, which are operated by the Association of Universities for Research in Astronomy, Inc., under cooperative agreement with the National Science Foundation. package. Flat field images were generated from sky flats constructed by median combining the dithered images. Each on-source frame was sky subtracted using a median sky generated from the on-source frame and the two images taken immediately before and after. This method of sky subtraction compensates for the rapid variations in sky brightness at L′-band. The sky subtracted images were then combined using the imcombine task of IRAF using the offsets given in the header; L1527 was quite faint in the individual frames and could not be used for further refinement of the offsets. The datasets from both epochs of observation were combined yielding a final image with 85 minutes of integration.
3 Results
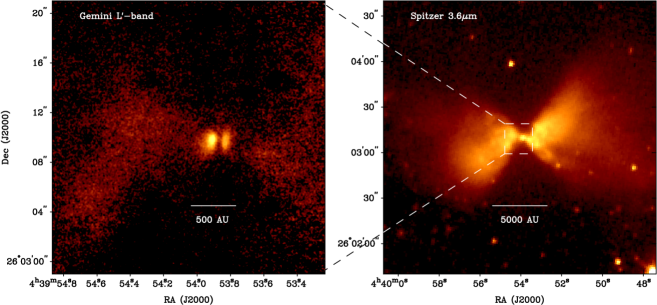
The images of L1527 at L′-band and 3.6m are shown in Figure 1. The IRAC image clearly shows the point-like structure appearing in the center of the envelope between the large scattered light cavities. The Gemini L′ image resolves the point-like structure into a compact, bipolar scattered light nebula at the center of L1527. The two lobes are separated by a narrow dark lane 0.45′′ (60 AU) wide, consistent with a circumstellar disk shadow. The L′ image reveals structure similar to that of the Hubble NICMOS images of Class I protostars in Taurus from Padgett et al. (1999). However, this is the first time such an image has been captured of a Class 0 protostar.
The total extent of the bipolar structure in the direction of the outflow (east-west) is 2.5′′ (350 AU) and 1.8′′ (250 AU) in width. The extent of the scattered light along the outflow and dark lane is much thicker than a prototypical disk (i.e. HH30, Burrows et al., 1996) indicating that the disk in L1527 is more vertically extended or that the scattering is coming from the inner envelope. The eastern lobe is about twice as bright as the western lobe; consistent with eastern side being slightly inclined toward us (85∘) (Paper I). The orientation of the disk dark lane indicates that the rotation axis of the system has a position angle 85∘ east of north. We also see extended, low surface brightness outflow cavity emission extending away from the inner envelope in the Gemini image. The cavity is quite narrow until 6′′ (840 AU) from the center; this narrowness was not well resolved in the Spitzer image. Past 6′′, the cavity expands rapidly to very wide angles. The total flux within a 714 (1000 AU) aperture radius is 6.5 0.6 mJy, consistent with the IRAC flux from Paper I.
3.1 Models
We use the Monte Carlo radiative transfer code of Whitney et al. (2003) to interpret the observations. The model components are described in Paper I, but we discuss some important aspects here for completeness. The envelope density structure is the standard rotating collapse solution (Cassen & Moosman, 1981; Terebey et al., 1984) in which envelope density scales with the infall rate with R-3/2 outside the centrifugal radius (RC) and R-1/2 inside RC. Conical outflow cavities are carved out of the envelope, their shape is defined by a polynomial, the degree of the polynomial is the shape parameter. We use the dust model from Paper I for the envelope which has grains up to 1m in radius.
The disk is defined by its initial scale height H0 at the stellar radius R∗ and flaring power law H Rβ, radial density profile R-α, mass, and outer radius. The vertical structure of the disk is assumed to be Gaussian with an initial scale height defined to be in hydrostatic equilibrium at the dust destruction radius (Td=1600K). Values of = 9/8, 5/4 are commonly used, corresponding to isothermal scale heights with R-3/4 and R-1/2. The gas and dust of the disk are assumed to be well mixed. The dust opacities for the disk are taken from Wood et al. (2002) which were used to model the SED of HH30. The dust is distributed in a quasi-settled manner with grains up to 1mm in the disk midplane while smaller grains remain extended. The transition between these dust populations is defined to be n=1010cm-3 or the first scale height.
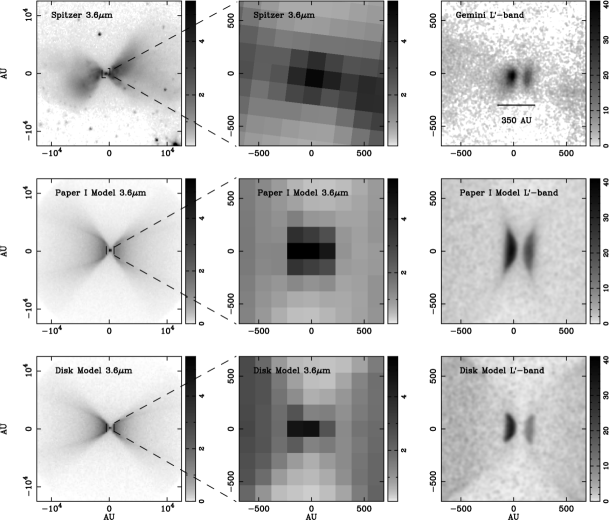
In Paper I, we inferred that the apparent point source seen at 3.6m was in fact a bipolar structure seen in reflected light, with the true central source actually hidden by extinction. To create this structure, we constructed a dual-cavity model having a narrow inner cavity with an outer cavity offset by 100 AU (see Figure 10 of Paper I for an illustration). Comparing the top and middle rows of Figure 2 shows that our prediction was qualitatively correct. We next take advantage of the high spatial resolution of the Gemini data to improve our understanding of the inner structure. We required that models reproduce both the L′ and IRAC images and the broadband SED and IRS spectrum (Furlan et al., 2008, and Paper I), as it is important to use as many constraints as possible (Paper I, Gramajo et al., 2010).
We first adjusted the parameters of the dual-cavity model to better reproduce the Gemini observations by varying the inner and outer cavity shapes and opening angles. As shown in Figures 2 and 3, our best-fit dual-cavity model reproduces the observations reasonably well (note that the images for the refined dual-cavity model are not shown as they nearly identical to the disk model as discussed below). The envelope infall rate for this model was 10-5M☉ yr-1; the outer cavity was offset from the inner cavity by 85 AU. The disk parameters are H(10AU)= 1.87 AU with = 1.25, H0 = 0.0332 R∗, = 0.05M☉ and = 25 AU; a model with = 1.125 was also able to be fit, but with double the initial scale height; the full parameter set is listed in Table 1.
We did not consider a disk model in Paper I because the large-scale dark lane seemed to be too thick to be reproduced with a disk. However, using the detailed Gemini image, we can describe disk parameters which yield scattering surfaces comparable to that of the dual-cavity model. The highly-flared disk in this model had H(10AU)= 1.95 AU (H(190AU) = 82 AU), with = 1.27, = 3.0, H0 = 0.03 R∗, = 0.005M☉ and = 190 AU. The envelope infall rate was lowered to 0.8 10-5M☉ yr-1 in order to allow more scattered light from the disk to escape through the envelope. We also used the envelope dust model for the disk upper layers rather than the default dust model; this increased the L′ intensity and reduced emission from 10 to 60 m (see Table 1 for other parameters) bringing the model into closer agreement with the observations. As shown in Figures 2 and 3, this model also provides reasonable agreement with the observations.
4 Discussion
The dual-cavity model in Paper I was justified based on simulations with a wide-angle outflow and a highly flattened envelope density distribution (Delamarter et al., 2000). However, it is unclear if such a flattened envelope is present in L1527, as there is no evidence for this in submillimeter observations (Chandler & Richer, 2000). In addition, the outflow cavity on scales larger that 840 AU from the central object does not easily fit within this framework due to the rapid widening of the scattered light nebula beyond 840 AU (§3; Figure 1) This is difficult to explain with a simple conical cavity because there is no direct line-of-sight from the protostar/disk to these parts of the outflow cavity. Therefore we suggest that the morphology of the scattered light nebulosity on large scales is not due directly to the outflow but to the morphology of the envelope and/or ambient medium (Tobin et al., 2010). In any case it appears difficult to explain the complex shape of the scattered light structures with an simple outflow-envelope interaction.
Given these difficulties, the disk scenario seems attractive. Images of disks in silhouette have previously been observed around T-Tauri stars (Class II sources) and Class I protostars (e.g. Padgett et al., 1999; Burrows et al., 1996). The small-scale scattered light morphology of L1527 bears a resemblance to that of IRAS 04302+2247 and HH30. The problem for this model is that the disk must be highly flared, with the aspect ratio of the disk extinction lane relative to the extent of the scattered light surfaces being about a factor of two larger than other objects. To reproduce the compact scattered light and large-scale dark lane with a disk, it was necessary to adopt a high degree of flaring in the disk (=1.27), a steep density profile (=3.0), a large disk radius (Rd=190AU), and a small disk mass (Md=0.005M☉). (Note that the mass is simply a formal parameter of the model for scaling the density. Extrapolating disk masses from fitting scattered light in the disk upper layers is problematic since they contain a small fraction of the total mass.) These observations and modeling emphasize not only that disks form early during protostellar collapse (Jørgensen et al., 2009; Vorobyov, 2009) but also that disks with large radii are able to form during the Class 0 phase (see also Enoch et al., 2009) with radii comparable to Class II disks in Taurus (Andrews & Williams, 2007).
In general, dust growth and/or depletion in upper disk layers relative to ISM conditions is needed to reproduce the scattered light images of edge-on disk systems and the SEDs of T Tauri stars (D’Alessio et al., 2006; Duchêne et al., 2010; Furlan et al., 2008). Thus, it may be that the postulated L1527 disk has had much less dust evolution and thus has more small dust in upper layers, making it easier to explain the wide extinction lane observed (e.g. D’Alessio et al., 2006).
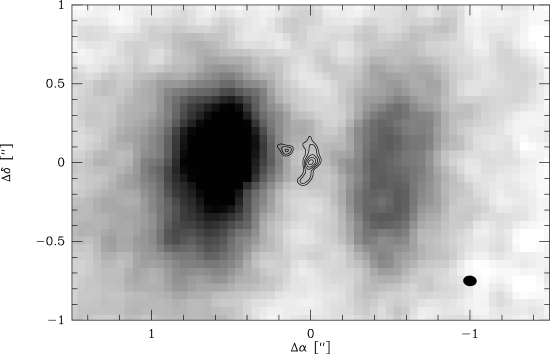
Loinard et al. (2002) directly imaged the disk of L1527 and a binary companion separated from the primary by 0.17′′ (24 AU) with VLA =7mm observations. These observations are overplotted on the L′ image in Figure 4. The observed disk is quite compact - only 0.3′′ (40 AU) in diameter. Though this system is a close binary, we do not expect the companion to affect the modeled parameters significantly, because our results mostly constrain the outer disk. The compactness of the disk measured Loinard et al. (2002) is not inconsistent with our disk model since the =7mm observations will only be sensitive to the densest part of the disk and where the grains are largest. Their measured disk mass of 0.1 is substantially larger than our disk model (which is uncertain as discussed previously). Note that the disk mass is strongly dependent on the assumed dust mass opacities; Loinard et al. (2002) used a dust opacity model based on Pollack et al. (1994) which had =4.910-4cm2g-1 (P. D’Alessio private communication)). Andrews & Williams (2005) used =0.035 cm2g-1 with which yields =0.00425 cm2g-1 when extrapolated. The difference between the values can be attributed to the Pollack et al. (1994) dust model only considering grains up to 1m in size while the dust model used by Andrews & Williams (2005) considered grains up to 1mm in size. Scaling the Loinard et al. (2002) =7mm mass to from Andrews & Williams (2005) gives =0.0095, in agreement with the mean disk mass of Taurus.
From the observations and modeling it is now clear that the small-scale scattered light in L1527 is most likely due to a disk. However, the assumed parameters needed to fit the disk model (e.g. steep density profile) may only have been necessary to enable our simplistic treatment of disk structure to work for L1527. Models which solve for the vertical structure of the disk self-consistently (i.e. D’Alessio et al., 1998), given the irradiation from the central object have a density structure that is not Gaussian (as assumed in our modeling) but falls off less rapidly with because the temperature increases with vertical height . Indeed, even in the context of an isothermal structure, the Gaussian density distribution becomes a poor approximation as the ratio of the vertical height to radial distance becomes . These issues deserve further investigation with physically self-consistent radiative transfer modeling of L1527.
4.1 Conclusions
We have presented high-resolution L′ imaging of the inner envelope of L1527 demonstrating that much can be learned of inner envelope structure and newly forming disks with high resolution scattered light observations of Class 0 protostars. The observations strongly resemble the dual-cavity model constructed in Tobin et al. (2008); however, the observations can be equally well reproduced by a large, highly flared disk or a refined dual-cavity structure. However, the global scattered light structure is difficult to interpret as purely an outflow cavity. We therefore suggest that the bright scattered light structure is most likely be a vertically extended disk-in-formation with material falling onto it.
The authors wish to thank the anonymous referee for a helpful report making the manuscript more clear, Gemini staff Astronomer R. Mason for critical assistance in conducting the observations, B. Whitney for providing her Radiative Transfer code to the community, and P. D’Alessio for helpful discussions. J. T. and L. H. acknowledge funding from HST-GO-11548.04-A and partial support from the University of Michigan. L. L. acknowledges the support of DGAPA (UNAM), CONACyT (Mexico), and the Guggenheim Memorial Foundation.
Facilities: Gemini:Gillett (NIRI), Spitzer (IRAC), VLA
References
- Andre et al. (1993) Andre, P., Ward-Thompson, D., & Barsony, M. 1993, ApJ, 406, 122
- Andrews & Williams (2005) Andrews, S. M., & Williams, J. P. 2005, ApJ, 631, 1134
- Andrews & Williams (2007) Andrews, S. M., & Williams, J. P. 2007, ApJ, 659, 705
- Burrows et al. (1996) Burrows, C. J., et al. 1996, ApJ, 473, 437
- Cassen & Moosman (1981) Cassen, P., & Moosman, A. 1981, Icarus, 48, 353
- Chandler & Richer (2000) Chandler, C. J., & Richer, J. S. 2000, ApJ, 530, 851
- Chen et al. (1995) Chen, H., Myers, P. C., Ladd, E. F., & Wood, D. O. S. 1995, ApJ, 445, 377
- D’Alessio et al. (1998) D’Alessio, P., Canto, J., Calvet, N., & Lizano, S. 1998, ApJ, 500, 411
- D’Alessio et al. (2006) D’Alessio, P., Calvet, N., Hartmann, L., Franco-Hernández, R., & Servín, H. 2006, ApJ, 638, 314
- Delamarter et al. (2000) Delamarter, G., Frank, A., & Hartmann, L. 2000, ApJ, 530, 923
- Duchêne et al. (2010) Duchêne, G., et al. 2010, ApJ, 712, 112
- Enoch et al. (2009) Enoch, M. L., Corder, S., Dunham, M. M., & Duchêne, G. 2009, ApJ, 707, 103
- Fazio et al. (2004) Fazio, G. G., et al. 2004, ApJS, 154, 10
- Furlan et al. (2008) Furlan, E., et al. 2008, ApJS, 176, 184
- Gramajo et al. (2010) Gramajo, L. V., Whitney, B. A., Gómez, M., & Robitaille, T. P. 2010, AJ, 139, 2504
- Hartmann et al. (1996) Hartmann, L., Calvet, N., & Boss, A. 1996, ApJ, 464, 387
- Hartmann et al. (2005) Hartmann, L., Megeath, S. T., Allen, L., Luhman, K., Calvet, N., D’Alessio, P., Franco-Hernandez, R., & Fazio, G. 2005, ApJ, 629, 881
- Jørgensen et al. (2009) Jørgensen, J. K., van Dishoeck, E. F., Visser, R., Bourke, T. L., Wilner, D. J., Lommen, D., Hogerheijde, M. R., & Myers, P. C. 2009, A&A, 507, 861
- Lada (1987) Lada, C. J. 1987, Star Forming Regions, 115, 1
- Loinard et al. (2002) Loinard, L., Rodríguez, L. F., D’Alessio, P., Wilner, D. J., & Ho, P. T. P. 2002, ApJ, 581, L109
- Ohashi et al. (1997) Ohashi, N., Hayashi, M., Ho, P. T. P., & Momose, M. 1997, ApJ, 475, 211
- Padgett et al. (1999) Padgett, D. L., Brandner, W., Stapelfeldt, K. R., Strom, S. E., Terebey, S., & Koerner, D. 1999, AJ, 117, 1490
- Pollack et al. (1994) Pollack, J. B., Hollenbach, D., Beckwith, S., Simonelli, D. P., Roush, T., & Fong, W. 1994, ApJ, 421, 615
- Robitaille et al. (2007) Robitaille, T. P., Whitney, B. A., Indebetouw, R., & Wood, K. 2007, ApJS, 169, 328
- Shu (1977) Shu, F. H. 1977, ApJ, 214, 488
- Shu et al. (1991) Shu, F. H., Ruden, S. P., Lada, C. J., & Lizano, S. 1991, ApJ, 370, L31
- Terebey et al. (1984) Terebey, S., Shu, F. H., & Cassen, P. 1984, ApJ, 286, 529
- Tobin et al. (2007) Tobin, J. J., Looney, L. W., Mundy, L. G., Kwon, W., & Hamidouche, M. 2007, ApJ, 659, 1404
- Tobin et al. (2008) Tobin, J. J., Hartmann, L., Calvet, N., & D’Alessio, P. 2008, ApJ, 679, 1364
- Tobin et al. (2010) Tobin, J. J., Hartmann, L., Looney, L. W., & Chiang, H.-F. 2010, ApJ, 712, 1010
- Ulrich (1976) Ulrich, R. K. 1976, ApJ, 210, 377
- Vorobyov (2009) Vorobyov, E. I. 2009, ApJ, 692, 1609
- Whitney et al. (2003) Whitney, B. A., Wood, K., Bjorkman, J. E., & Cohen, M. 2003, ApJ, 598, 1079
- Wood et al. (2002) Wood, K., Wolff, M. J., Bjorkman, J. E., & Whitney, B. 2002, ApJ, 564, 887


| Parameter | Description | Dual-Cavity Model | Disk Model | Parameter Use |
|---|---|---|---|---|
| R∗(R☉) | Stellar radius | 2.09 | 2.09 | fixed (Paper I) |
| T∗(K) | Stellar temperature | 4000 | 4000 | fixed (Paper I) |
| L∗(L☉) | System luminosity | 2.75 | 2.75 | fixed (Paper I) |
| M∗(M☉) | Stellar mass | 0.5 | 0.5 | fixed (Paper I) |
| Mdisk(M☉) | Disk mass | 0.05 | 0.005 | varied (both models) |
| h(10AU) | Disk scale height at 10AU | 1.87 | 1.95 | varied (both models) |
| H0 | Disk scale height at R∗ | 0.0332 | 0.03 | varied (both models) |
| Disk radial density exponent | 2.25 | 3.0 | varied (both models) | |
| Disk scale height exponent | 1.25 | 1.27 | varied (both models) | |
| (M☉ ) | Disk accretion rate | 3.0 | 3.0 | fixed (Paper I) |
| Rtrunc(R∗) | Magnetosphere co-rotation radius | 3.0 | 3.0 | fixed (Paper I) |
| Fspot | Fractional area of accretion hotspot | 0.01 | 0.01 | fixed (Paper I) |
| Rdisk,min(R∗) | Disk inner radius | 14.25 | 14.25 | fixed (Paper I) |
| Rdisk,max(AU) | Disk outer radius | 25 | 190 | varied (both models) |
| Rc(AU) | Centrifugal radius | 25 | 190 | varied (coupled to Rdisk,max) |
| Renv,min(R∗) | Envelope inner radius | 42.75 | 42.75 | fixed (Paper I) |
| Renv,max(AU) | Envelope outer radius | 15000 | 15000 | fixed (Paper I) |
| (M☉ ) | Envelope mass infall rate | 1.00 | 0.8 | varied slightly (both models) |
| bin | Inner cavity shape exponent | 1.3 | - | varied (dual cavity model) |
| bout | Outer cavity shape exponent | 1.7 | 1.5 | varied (both models) |
| zout(AU) | Outer cavity offset height | 85 | - | varied (dual cavity model) |
| (∘) | Inner cavity opening angle | 15 | - | varied (dual cavity model) |
| (∘) | Outer cavity opening angle | 15 | 20 | varied (both models) |
| (∘) | Inclination angle | 85 | 85 | fixed (Paper I) |
| (g cm-3) | Cavity density | 0 | 0 | fixed (Paper I) |
| (g cm-3) | Ambient density | 0 | 0 | fixed (Paper I) |