Cosmic Origins Spectrograph Detection of Ne viii
Tracing Warm - Hot Gas Towards PKS 11affiliation: Based on observations with the NASA/ESA Hubble Space Telescope, obtained at the Space Telescope Science Institute, which is operated by the Association of Universities for Research in Astronomy, Inc., under NASA contract NAS 05-26555, and the NASA-CNES/ESA Far Ultraviolet SpectroscopicExplorer mission, operated by the Johns Hopkins University, supported by NASA contract NAS 05-32985.
Abstract
We report on the detection of Ne viii in the /Cosmic Origins Spectrograph spectrum of the intervening absorption system at towards PKS (). The high COS spectrum also covers absorption from H i, C iii, O iii, O iv and Ovi associated with this multiphase system. The Ne viii is detected with high significance in both lines of the doublet, with integrated column densities of log and log . We find the origin of Ne viii consistent with collisionally ionized gas at K with a large baryonic column density of cm-2. The metallicity in the Ne viii gas phase is estimated to be [Ne/H] dex. The intermediate ions such as C iii, O iii, O iv and H i are consistent with photoionization in lower ionization gas at K. The O v and Ovi in this absorber can have contributions from both the photoionized and collisionally ionized gas phases. The absorber is at km s-1 systematic velocity and kpc projected separation from a galaxy of extended morphology. The collisionally ionized gas at K detected in Ne viii and Ovi points to an origin in multiphase gas embedded in the hot halo of the galaxy, or in a nearby WHIM structure. The high sensitivity UV spectroscopy afforded by COS has opened up new opportunities for discovering large reservoirs of missing baryons in the low- universe through the detection of Ne viii systems.
1. Introduction
Absorption-line spectroscopy of distant quasars have yielded a complete census of the properties and distribution of baryons at the early epochs of the universe. At , almost all of the baryons reside in the space in-between galaxies and galaxy clusters. This intergalactic medium (IGM) at high- is almost entirely in the form of gas photoionized and heated to K (e.g. Fukugita et al., 1998). The photoionized IGM manifests in the spectra of quasars as the Ly forest. From those early epochs, the process of galaxy formation as well as the continued expansion of the universe is expected to have drastically altered the phase composition of much of the baryons (Cen & Ostriker, 1999; Davé et al., 2001; Cen & Ostriker, 2006). Observational efforts to detect these baryons in the present universe have so far not succeeded in identifying their most dominant reservoirs (Bregman, 2007).
In the universe, collapsed objects such as galaxies, groups and clusters account for only % of the cosmic baryon budget (Fukugita & Peebles 2004). More than % of the baryons are still outside of galaxies. However, unlike high-, the fraction of intergalactic baryons in the photoionized phase far from galaxies has significantly declined. Observationally, this is evident from the decline in the redshift distribution of Ly absorbers (Kim et al., 1997; Weymann et al., 1998; Penton et al., 2000). Estimates suggest that in the present universe, the Ly forest contribution to the baryon density () is only % (Penton et al. 2000, 2004; Lehner et al. 2007, Danforth & Shull 2008). This implies that a larger fraction of the intergalactic baryons must exist in a separate gas phase, not included in galaxies and also not dominantly photoionized. Numerical simulations of structure formation predict that most of these baryons are in highly ionized gas structures at temperatures in the range K and densities of cm-3 (Cen & Ostriker, 1999; Davé et al., 2001; Valageas et al., 2002; Cen & Ostriker, 2006). Frequently referred to as the Warm Hot Intergalactic Medium (WHIM), this gas phase was an outcome of collisional ionization through heating in gravitational shocks when intergalactic matter fell into the potential wells of collapsed dark matter as structures grew hierarchically (e.g. Cen & Ostriker, 1999). Detecting the WHIM and characterizing its physical properties remains one of the most important themes in observational cosmology. For extensive reviews on the search for WHIM in the low- universe see Bregman (2007) & Prochaska & Tumlinson (2009).
UV absorption-line spectroscopy is presently the most promising approach for the detection and characterization of the WHIM. The diffuse nature predicted for the WHIM gas makes detection via emission scarcely possible. Also, attempts at observing the K WHIM in X-ray absorption at have not been successful largely due to the insufficient sensitivity and resolution of the current generation of instruments. In the UV, the principal absorption-line tracers of collisionally ionized gas are Ovi , Ne viii and broad Ly (BLA). In gas in collisional ionization equilibrium, Ovi reaches its peak ionization fraction at K. The strong Ovi doublet lines can thus be a sensitive probe of gas at those collisionally ionized temperatures (Tripp et al., 2000; Savage et al., 2002; Danforth & Shull, 2008; Narayanan et al., 2010a, b). However, Ovi is also produced in low density environments under the influence of a strong radiation field through pure photoionization at K (Savage et al., 2002; Prochaska et al., 2004; Lehner et al., 2006; Thom & Chen, 2008b; Tripp et al., 2008; Oppenheimer & Davé, 2009). In the case of most Ovi absorption systems, the complexity seen in absorption prevent a reliable assessment of the process that dominates the ionization.
In comparison, the Ne viii doublet lines (; Verner et al., 1994) are better tracers of collisionally ionized gas. Even though the cosmic abundance of neon is less compared to oxygen ((Ne/O); Asplund et al., 2009), detectable amounts of Ne viii can be present in Ovi absorbing gas at K. The temperature range corresponds to the warm phase of the WHIM. In collisional ionization equilibrium (CIE), the Ne viii ionization fraction peaks at K. The first clear detection () of Ne viii doublet lines for an intervening absorber at low- was reported by Savage et al. (2005), in the high- spectrum of the metal line system at towards HE . The column density of Ne viii and its ratio with Ovi were consistent with an origin in collisionally ionized gas at K with a substantial baryonic column of cm-2. The intermediate ions (such as C iii, O iii, O iv, Si iii) and strong H i absorption in this system were created in a separate gas phase at K through photoionization. The second detection of Ne viii was reported by Narayanan et al. (2009) in an intervening absorption-line system at in the spectrum of the quasar 3C 263. The redshifted wavelengths of Ovi lines in this absorber fell outside the wavelength coverage of . Nonetheless, the detection of ions such as O iii, O iv and Nv in the spectrum pointed to the presence of both photoionized and collisionally ionized regions in the absorber, traced by the intermediate ions and Ne viii respectively. The detection of Ne viii required the presence of gas with K, corresponding to the temperature anticipated for the warm phase of the WHIM.
Here we report on another instance of Ne viii detection in an intervening absorption system in the low- universe. The Ne viii doublet lines are detected at high significance in the high /Cosmic Origins Spectrograph (COS) spectrum of the UV bright quasar PKS . The detection distinctly points to the presence of warm collisionally ionized gas in a structure with a very large column density [ cm-2] of baryons. This is third in a series of COS detections of collisionally ionized gas in the regions surrounding galaxies, the other two being Savage et al. (2010) and Narayanan et al. (2010b).
2. Overview of Previous Work
The PKS sight line was previously observed by the and /STIS instruments at spectral resolutions of km s-1 and km s-1. Lower resolution FOS observations (FWHM km s-1) also exist for this target. A number of authors have published results on the detection and analysis of hydrogen and metal-line absorbers along this sight line (Bahcall et al., 1993; Jannuzi et al., 1998; Prochaska et al., 2004; Williger et al., 2006; Lehner et al., 2007; Tripp et al., 2008; Thom & Chen, 2008a, b; Howk et al., 2009). The most complete analysis of the ionization and chemical abundances in the absorber is given in Howk et al. (2009). A thorough investigation of the physical conditions was made possible by the combined and STIS coverage of several important low and high ionization metal species and hydrogen for this absorber.
In the spectrum, the Ne viii lines were non-detections with a 3 upper limit on the equivalent width and column density of mÅ and log in the rest-frame of the absorber (Howk et al. 2009). In the absence of Ne viii, Howk et al. (2009) were able to determine a single-phase photoionization model that could simultaneously explain the column densities of all ions, including Ovi. The constraints from the photoionization models, particularly the metallicity, were found to be dependent on the nature of the ionizing spectrum. In the best-fit models, an extragalactic ionizing background dictated by QSOs predict carbon and oxygen abundances of dex, whereas including the contribution of ionizing photons from star forming galaxies, the abundances drop to dex. The single-phase photoionization models derived by Howk et al. (2009) predict densities of cm-3, baryonic column densities of log , a photoionization equilibrium temperature of K and a physical size of kpc for the absorbing region. Howk et al. (2009) also do not rule out the possibility of the absorber having multiple gas phases, with at least one phase of predominantly photoionized gas ( K) and another wamer phase ( K) that is collisionally ionized. The absence of Ne viii in the spectrum was accepted as evidence for the lack of K warm - hot gas associated with the absorber. The detection of Ne viii in the higher sensitivity COS spectrum is a crucial new result, as it convincingly demonstrates that we are observing a substantial baryonic column of collisionally ionized gas, possibly the WHIM or the ionized halo of a galaxy.
3. COS Observations
The COS spectrum for PKS presented here is a combination of observations from the HST Early Release Program of August 2009 (Program ID: 11508) and GTO observations by the science team from December 2009 (Program ID: 11541). The details of the separate COS integrations are listed in Table 1. The exposures were retrieved from the HST archive and reduced in a uniform fashion using the most current CalCOS pipeline software (ver 2.11). The reduced data were flux calibrated. The design capabilities of /COS are described in detail by Green (2001); Froning & Green (2009) and in the updated COS Instrument Handbook (Dixon et al., 2010). The inflight performance of COS is discussed by Osterman et al. (2010) and in the numerous instrument science reports on the STScI COS website111http://www.stsci.edu/hst/cos/documents/isrs. Savage et al. (2010) have used these COS observations of PKS to study the properties of the highly ionized plasma in the Lyman Limit system at .
The separate G130M and G160M grating integrations were combined together in flux units weighted by their respective exposure time using the custom coaddition routine developed by Charles Danforth and the COS GTO team222http://casa.colorado.edu/danforth/science/cos/costools.html. A full description of this routine is given in (Danforth et al., 2010b). In brief, the routine cross-correlates and corrects the different exposures for velocity misalignments, before combining the fluxes. Since the FUV COS spectra are not flat-fielded, a procedure is built into the routine to psuedo-flat field each exposure to remove narrow fixed pattern features at the % depth (in flux units), most of which are repetitive grid-wire shadows. Applying this automated procedure does not result in the complete removal of every fixed pattern feature. Nonetheless, tests on several COS spectra have shown that the procedure is successful in removing periodic instrumental artifacts, thereby improving the overall sensitivity of the spectrum. The final coadded spectrum has wavelength coverage from 1135 Å to 1796 Å. The ratios (per 18 km s-1 resolution element) of this combined final spectrum at 1200 Å, 1400 Å, and 1600 Å are 20, 15, and 18 respectively. We also correct the COS spectrum for wavelength zero-point offsets. Weak low-ionization Milky Way ISM lines observed in the G130M and G160M integrations were used to check the reliability of the COS wavelength calibration. Based on the H i emission data given in Lockman & Savage (1995) we estimate the heliocentric velocity of the ISM absorption in the direction of PKS to be km s-1. To make the ISM lines in the PKS COS spectrum have average heliocentric velocities of 20 km s-1, we applied velocity offsets of km s-1 to the G130M and km s-1 to the G160M data. Residual errors in the wavelength calibration correspond to km s-1.
Ghavamian et al. (2009) has determined the resolving power of the spectrograph by detailed modeling of the line spread function (LSF) at various wavelengths. The spectral resolution is found to be wavelength dependent with values in the range for the G130M and G160M gratings, where refers to the width at half strength of the LSF which has broad wings containing % of the LSF area. The resolution is maximum at near-UV wavelengths and declines monotonically towards lower wavelengths.
4. Properties of the Ne viii System
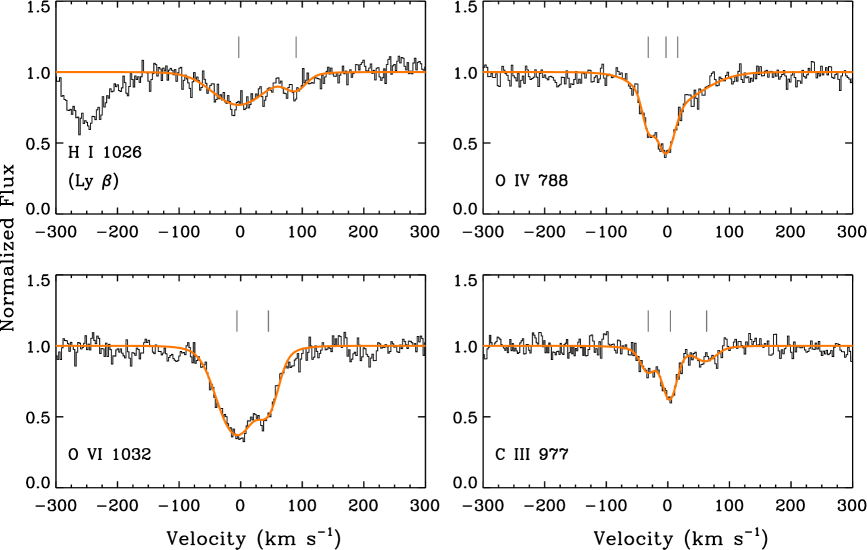
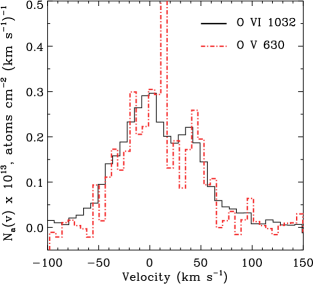
In this section we describe the observed properties of the absorption system. In Figure 1, we display the continuum normalized absorption profiles in the rest-frame of the absorber and in Table 1, we list the basic line measurements. For consistency, we adopt the same redshift for the system as given in Howk et al. (2009), which was based on the centroid of the C iii profile from STIS. The COS spectrum for this system shows absorption from H i, Ovi , O iv , C iii , O iii , and Ne viii . In addition, it also covers wavelengths where absorption from C ii, Nii, Si ii and Fe iii are expected. For the line measurements, we use the apparent optical depth (AOD) method of Savage & Sembach (1991). For Ly, Ovi, O iv and C iii we also apply Voigt profile models to estimate the column density, Doppler width and velocity associated with individual components. The fit models are shown in Figure 2. The profiles were fit with Voigt functions using the fitting routine of Fitzpatrick & Spitzer (1997). In this process, the model profiles were convolved with the COS instrumental spread function at the redshifted wavelength of the line. It is important that the specific line spread function be used to fit the profile in order to minimize the impact of the LSF non-Gaussian wings on observed line profiles (see Ghavamian et al., 2009, for a detailed discussion). For completeness, we also show in Figure 1, the strong O v profile recorded at intermediate resolution by and the Ly as seen by the low-resolution FOS. This is the first direct detection of O v in the IGM at low- (Prochaska et al., 2004; Howk et al., 2009), and its absorption profile agrees well with the component structure for Ovi seen in the COS data.
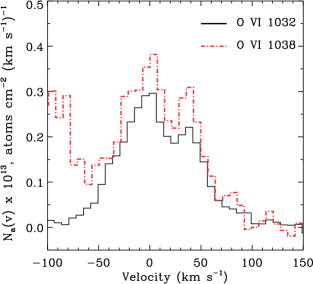
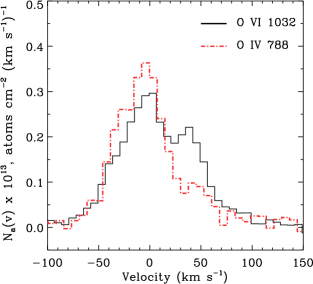
The Ovi lines in the high COS spectrum agree generally with the higher resolution, lower observation from STIS. The Ovi absorption is spread over km s-1 and shows sub-component structure. In the STIS spectrum, a comparison of the apparent column density profiles for the 1032 Å and 1038 Å lines had shown extra absorption in the 1038 Å line at km s-1, which was labeled as an unidentified interloping absorber (Howk et al. 2009). In the COS spectrum, we do not find any marked difference between the velocity components of the Ovi doublet lines (see Figure 3). The contaminating feature in Ovi 1038 Å, found in the STIS spectrum, is more likely a spectral artifact.
The comparison of Figure 3 shows that the Ovi lines are subjected to saturation that is unresolved by COS. The difference in the integrated apparent column densities of log , and log is significant and suggestive of this unresolved saturation. The Ovi 1038 column density measurement is within of the same by Howk et al. (2009) in the STIS spectrum, and is likely to be a closer representation of the true column density. We correct for the line saturation effect using the procedure described in Savage & Sembach (1991), and obtain log . The dex saturation correction corresponds to the difference between the logarithmic column densities of the weaker (less saturated) and stronger (more saturated) lines of the Ovi doublet. The integrated Ovi column density which we adopt in all subsequent analysis is the saturation corrected value of log dex.
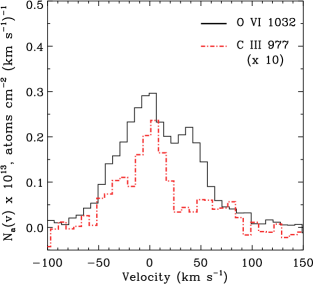
The multiphase nature of the absorber becomes evident while comparing the apparent column density profiles across the absorption seen in the intermediate ions (C iii, O iv) and the high ions (O v, Ovi). The O iv and C iii velocity structures resemble each other, as revealed by the arrangement of their profiles displayed in Figure 3. The absorption from these ions over the km s-1 km s-1 interval has a two component structure centered at velocities of km s-1 and km s-1. However, the component at km s-1 is not readily seen in Ovi. It is likely that the slight asymmetry in the negative velocity portion of the Ovi absorption is suggestive of an additional component, perhaps thermally broader than what is seen in O iv and C iii. Additional evidence for the multiphase nature of the absorber is evident from the difference between the weak absorption seen in C iii and O iv compared with the strong absorption in Ovi over the velocity interval km s-1 km s-1. This indicates that the gas in this velocity range has higher ionization, compared to the gas at negative velocity, although they are likely kinematically linked to each other. The integrated column densities for O iv and C iii when compared to the STIS measurements suggest unresolved saturation for both lines. Howk et al. quote a lower limit of log and log adopted from component fitting. We adopt the same measurements for these two ions in our ionization analysis.
In the COS spectrum, O iii is detected at significance. The line is very weak and therefore was undetected at the sensitivity afforded by . The velocity range over which O iii shows absorption concurs well with the velocity range of absorption from the higher ionization stages of oxygen. The rest-frame equivalent width mÅ and column density log that we measure from the COS data are consistent with the upper-limits of mÅ and log obtained from by Howk et al. (2009). The errors on the O iii equivalent width and column density do not include an estimated 5 mÅ and 0.06 dex systematic error produced by fixed pattern noise. With the detection of O iii, we have column density measurements for four successive ionization stages of oxygen (O iii - Ovi), which sets useful constraints on the physical conditions in the absorber.
The information on H i associated with this absorber was poor in the existing STIS and FOS data. The FOS spectrum showed Ly absorption at the redshift of the system, although the low resolution provided little information on the H i kinematics or the possibility of saturation. The Ly observed at higher resolution by was poorly detected due to the low pixel-1 of the recorded spectrum. The COS data offers a factor of 3 higher coverage of Ly, along with tighter constrains on the H i column density from the higher order lines of the Lyman series. The Ly feature in COS is a clear but weak detection, with a central optical depth of . The H i is kinematically broad, spread over a velocity of km s-1. Based on simultaneous fits to the Ly (FOS), Ly (STIS) and Ly (STIS, significance) features, Howk et al. (2009) derive a H i column density of log . By integrating the profile of Ly in the COS spectrum, we estimate the logarithmic total H i column density as , consistent with the STIS measurement. At the COS resolution, the Ly appears to have two components, a broader principal component at km s-1 blended with a km s-1 component which could be narrower than the instrumental width. This positive velocity component is weaker and may not contribute significantly to the total H i column density. The profile fit to COS Ly yields km s-1 for the principal km s-1 component. If the broadening of this component is dominantly thermal, then the implied temperature is K. This component appears to be symmetric with respect to its centroid, although the COS instrumental resolution is not adequate to rule out of blending of closely separated components.
4.1. The Ne viii Detection
The wavelengths of the redshifted Ne viii lines are 1151.8 Å and 1166.2 Å respectively. The Ne viii line is therefore covered only by G130M grating observations at central wavelength settings of Å and Å. From the various COS integrations for this sight line, five exposures (with sec) have central wavelength of Å, and six shorter exposures ( sec) have Å. Similarly, the Ne viii line is covered by G130M grating settings of central wavelengths Å, Å, Å and Å.
The Ne viii in this system is a relatively weak feature. To prevent gross systematic uncertainties from affecting the validity of the Ne viii detection, we customized the combining of spectra in the wavelength range where absorption from the redshifted Ne viii lines were expected. We carefully chose for coaddition only those individual exposures for which we could clearly rule out grid wire shadows or other detector artifacts (at the redshifted wavelengths of the Ne viii doublet lines). Choosing different central wavelength grating settings allows the dispersed light to shift across the detector in the dispersion direction. For each setting, this enables the recording of the same wavelength by different regions of detector. By then aligning in detector space the different integrations, it becomes possible to readily identify if the wavelengths corresponding to the Ne viii lines in each exposure are affected by any fixed pattern structure. In the case of PKS , the individual integrations had adequate to carry out this selection process with some certainty.
The spectrum at the wavelength of the Ne viii line is coaddition of four G130M integrations at the Å setting, resulting in a total exposure time of 5.8 ksec at Å . The IDs of these four exposures are labeled in Table 1. At the Ne viii Å redshifted wavelength, we found all five G130M integrations with Å setting free of strong fixed pattern noise features and thus suitable for coaddition. These exposure IDs are also labeled in Table 1. The Ne viii lines displayed in the system plot of Figure 1 and the line measurements given in Table 2 are based on this revised coaddition.
By integrating over a 200 km s-1 velocity interval, we measure a rest-frame equivalent width of mÅ for the Ne viii line. The significance of the detection is . The 1 uncertainty listed here includes both statistical errors and continuum placement error. A more conservative estimate of the detection significance should take into account systematic uncertainty from fixed pattern features that contribute to the noise at the mÅ level. Including this systematic error, the Ne viii is detected with a significance of 6.6.
At the location of the redshifted Ne viii line, we also se absorption that is consistent with the 770 Å line. We measure a rest-equivalent width of mÅ for this feature implying a detection significance of . The ratio is close to the expected 2:1 line strength ratio for a doublet, further validating the Ne viii detection. The integrated apparent column densities obtained for the two Ne viii lines are also within 1 of each other. In subsequent analysis, we use log measured for the Ne viii line as the Ne viii column density in this absorber.
The rest frame equivalent width we obtain for the Ne viii of mÅ is somewhat larger than the upper limit of mÅ obtained from the lower observations of Howk et al. (2009). We independently re-measured the observations integrating over km s-1 and obtain mÅ, which implies a detection. Our COS measurement is therefore in agreement with our new measurement of the spectrum. The validity of the COS detection of the Ne viii line is further supported by the matching line profile observed for the much stronger Ovi line (see Figure 1a).
5. Ionization In the Absorber
Our primary goal is to understand the ionization mechanism responsible for the production of Ne viii. Additionally, we investigate the extent to which other high ions such as O v and Ovi are produced in the gas phase traced by Ne viii. We start the ionization discussion by considering the possibility of Ne viii arising in a purely photoionized gas.
5.1. Is the Ne viii Produced by Photoionization ?
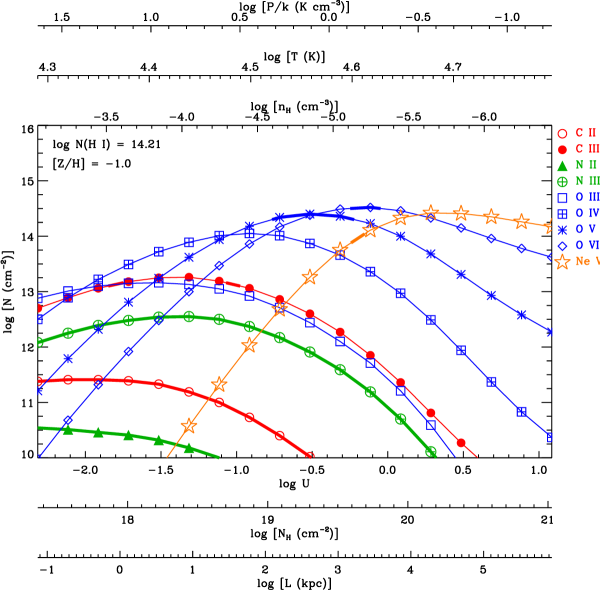
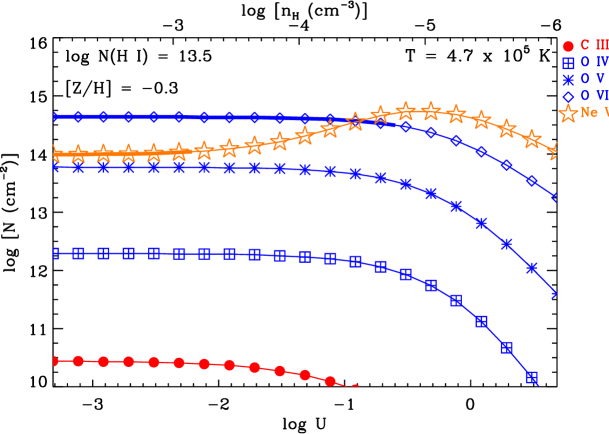
We use the photoionization code Cloudy [ver.C08.00, Ferland et al. (1998)] to solve for time equilibrium models that reproduce . We treat the other ionic column densities as upper limits to account for the possibility that the absorber could have a mix of gas phases at different ionization levels. The source of ionization is assumed to be dominated by the extragalactic background radiation at the redshift of the absorber, whose shape and intensity is as modeled by (Haardt & Madau, 2001). The UV background which we use has contributions from quasars and young star forming galaxies. The photoionization models are calculated for different ionization parameters333Ionization parameter is defined as the ratio of the number density of photons with E eV to the total hydrogen density log and metallicities, to select the model that best-fits the observations. We assume that the entire H i column density of 14.21 dex which we measure for this system is associated with the photoionized gas that we model. This assumption need not be valid for a multi-phase absorber. Therefore we comment on how lower values in the Ne viii gas would change the ionization predictions. In the models, we have assumed that the relative elemental abundance ratios are solar, with abundances of [C/H]⊙ = -3.57 dex, [O/H]⊙ = -3.31 dex, [Ne/H]⊙ = -4.07 dex as given by Asplund et al. (2009).
In Figure 4, we display photoionization predicted ionic column densities for solar metallicity, log and different log . Recovering the observed Ne viii column density through photoionization requires very high ionization parameter values. The observed log is achieved at log (for solar abundance pattern), which corresponds to a number density of cm-3, and a total hydrogen column density cm-2. Such diffuse gas with large total hydrogen column density results in a large physical size of Mpc for the photoionized region. If the absorption is from an unvirialized structure, then the large path length would result in line broadening due to Hubble expansion of km s-1, much larger than the velocity width of the absorption seen in Ne viii and Ovi. If the observed Ovi column also has contribution from the lower ionization gas phase traced by C iii, O iii and O iv, then log implying log and even lower densities leading to larger sizes for the absorber. The constraint on the ionization parameter is strongly dependent on the column density ratio between Ne viii to Ovi and does not vary significantly with metallicity or the H i column density. The unrealistic predictions of the models suggest that photoionization cannot be responsible for the production of Ne viii in this absorber. The absorber can still have a photoionized phase where much of the H i and intermediate ion absorptions occur, as shown in Howk et al. (2009). Such multiphase nature can explain the clear differences in the component structure between the H i, C iii, and O iv profiles with O v and Ovi (see Figure 3).
If the absorber is residing in the halo of a galaxy, the local radiation field created by the galaxy could influence the ionization in the absorber (Fox et al., 2005). The ionization fractions of H i, and low ions such as C ii, Si ii, O iii and O iv can be influenced by the flux of UV photons escaping from a star forming galaxy. On the other hand, for the ionization fraction of Ovi and Ne viii to be altered, photons with energy eV and eV are required. The radiative intensities of O and B stars at such high energies is very low due to the significant opacity from He+ ionization edge at eV. Thus, the Ovi and Ne viii ionization levels are unlikely to be significantly altered by any local galactic radiation field.
5.2. Evidence for K Gas
5.2.1 Collisional Ionization Equilibrium
If collisional ionization equilibrium (CIE) applies, the apparent column density ratio of log will be true for an equilibrium temperature of K (assuming solar abundances). If there is contribution from the photoionized phase to the total Ovi column density, then the constraint would be log , which is true for temperatures greater than K. Thus, the presence of Ovi provides a useful lower limit on the temperature of the gas producing the Ne viii absorption. In gas at K, only a small fraction of the hydrogen would be in the neutral form (, Gnat & Sternberg 2007). Also, the H i absorption arising in such gas would be thermally broadened to km s-1. This implies that much of the Ly absorption does not arise from the Ne viii phase, but from lower ionization gas that is predominantly photoionized.
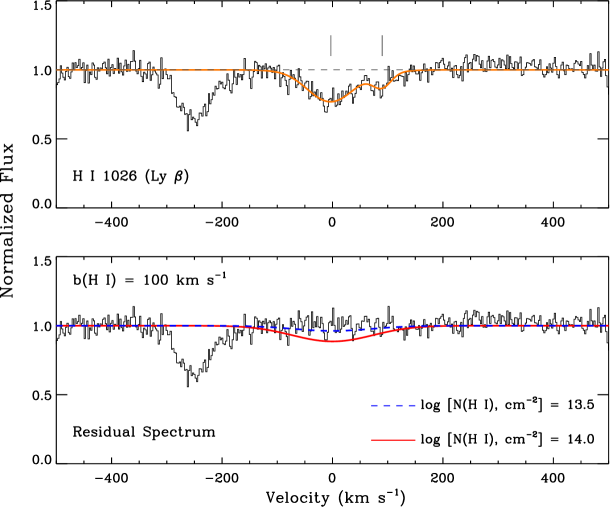
To derive the total hydrogen content of the absorber and the metallicity in the collisionally ionized gas, the H i column associated with this higher ionization Ne viii phase has to be determined. However, the thermally broadened absorption from the trace neutral hydrogen associated with the Ne viii gas would fall on top of the stronger absorption from the photoionized gas. It is therefore difficult to separate out this shallow and broad component of H i from the observed Ly profile. Therefore one has to determine a column density upper limit for the broad H i indirectly. In Figure 5, we show the residual Ly absorption after dividing the Ly spectrum with the Voigt profile fit to feature. On top of this residual spectrum, we superimpose synthesized Ly profiles with km s-1 and different column density values. It is evident from the figure that the broad H i associated with the Ne viii gas has to be log to be consistent with the data at the wavelength position of Ly. We use this adopted upper limit on H i column density to determine the metallicity and the baryonic content in the Ne viii gas.
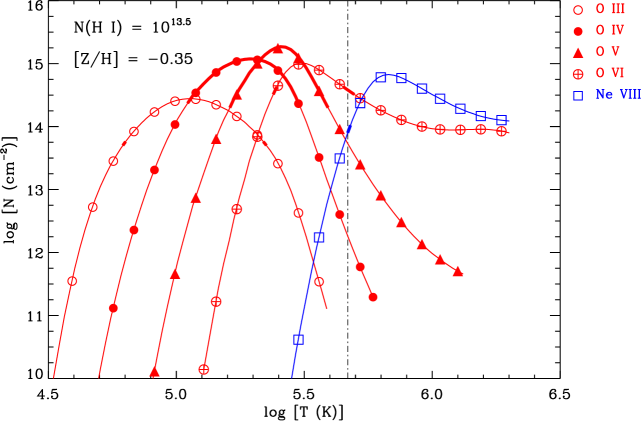
In Figure 6, we display Gnat & Sternberg (2007) CIE models for log . At K, the observed column densities of Ne viii and Ovi are well explained if we assume a metallicity of [Z/H] . This CIE model would also account for % of the O v column, but little O iv or O iii, consistent with their origin in a separate (photoionized) phase. The collisional ionization temperature and H i column density in the CIE model are lower and upper limits on the values they could assume. The observed Ne viii column density can be reproduced even when log by increasing the metallicity to values above dex. The H i ionization fraction at K implies that the Ne viii gas is tracing a baryonic column of log . This lower limit on baryonic column density will be smaller for metallicities higher than dex. It is worth noting that the metallicity inferred for the collisionally ionized gas is consistent with the metallicity range of [Z/H] estimated by Howk et al. (2009) for the photoionized gas phase of this absorber.
Gas that is heated to very high temperatures can undergo rapid radiative cooling at K due to enhanced cooling efficiencies (Gnat & Sternberg, 2007). Over time, the ion fractions in such gas would begin to show departures from CIE due to faster radiative cooling rate compared to the rate at which recombinations occur. However, for the temperatures that we infer for the Ne viii gas, non-equilibrium ionization effects are minimal. At K, the Ne viii and Ovi fractions in a radiatively cooling gas at solar metallicity are and (Gnat & Sternberg, 2007). These values are only marginally different from the CIE values of and , and therefore yield similar predictions for the physical conditions.
5.2.2 Collisional and Photoionization Hybrid Models
The CIE analysis described in the previous section did not take into account the incidence of extragalactic ionizing radiation on the absorber. Even when conditions are conducive for collisional processes to dominate the ionization, a realistic modeling of absorption systems should also take into account the influence on ionization by the isotropic radiation field from quasars and star forming galaxies (Danforth et al., 2006; Richter et al., 2006; Tripp et al., 2008; Danforth et al., 2010a; Narayanan et al., 2010b). We use Cloudy to compute simple hybrid models that allow both collisional and photoionization reactions to contribute towards the ionization in the Ne viii gas phase. The temperature is fixed in Cloudy at K which is the lower limit on the temperature estimated from the CIE model for the Ne viii gas phase. The model that Cloudy would converge on will have the ionization and recombination reactions in equilibrium, even though the heating and cooling rates will be out of balance due to the fixed temperature.
In Figure 7, we show hybrid of photoionization and CIE model curves for the Ne viii gas phase with log , T K and different log values. Comparing the hybrid model column density predictions with the pure photoionization models displayed in Figure 4, we find that at log , the ionization fraction of both Ovi and Ne viii are higher (and almost a constant) due to the collision of electrons with ions contributing to the ionization at higher densities (smaller log ). The metallicity in this hybrid phase can have a range of values between [Z/H] . From the shape of the curve in Figure 7, it is evident that the upper limit of [Z/H] dex is based on the assumption that the Ovi is exclusively produced in the hybrid phase. At this metallicity, and are simultaneously recovered for log , which corresponds to a density of cm-3, total hydrogen column density of cm-2 and line-of-sight thickness of kpc. For lower metallicities, log has to increase in order to recover the measured . The lower limit on the metallicity is the value at which Ne viii is recovered near its peak in ionization fraction and at a log that does not result in an excessively large path length for the absorbing region. In the hybrid model, those conditions are satisfied for [Z/H] and log which corresponds to cm-3, cm-2 and Mpc. Such a hybrid model would require the Ovi to have significant contribution from the separate photoionized phase traced by the low and intermediate ions. To summarize, within the framework of these simple CIE and photoionization hybrid models, the Ne viii gas phase has a metallicity of [Z/H] and log , which implies cm-3 and cm-2. The Ne viii is produced via collisional ionization, whereas the Ovi can have contribution from a separate gas phase that is predominantly photoionized.
6. Galaxies In the Vicinity of the Absorber
Given the evidence for the presence of K gas, the location of the absorber with reference to galaxies becomes important. Absence of an optical counterpart to the absorber would strengthen the case for the absorption arising in an unvirialized WHIM structure in the IGM. Chen & Mulchaey (2009) have carried out imaging and spectroscopic search for galaxies in the PKS field. Their survey has a % completeness for galaxies brighter than R = 22 out to a separation of 2 arc minute from the line of sight, which corresponds to a projected distance of kpc at , assuming and (Wright, 2006). The survey was 100% complete for galaxies brighter than R = 20. In this survey, a galaxy with rest-frame R magnitude of M log is identified close to the Ne viii absorber at a projected distance of kpc. The galaxy’s spectroscopic redshift is , and thus is at a systemic velocity of km s-1 with respect to the Ne viii absorber. No other galaxy brighter than is identified within a comoving distance of 3.7 Mpc of the absorber. At this redshift, M corresponds to a galaxy luminosity of (Dahlen et al., 2005).
The galaxy displays an extended morphology in the high spatial resolution HST/WFPC2 image of the field (see Figure 10 of Chen & Mulchaey, 2009). The galaxy’s spectrum is dominated by strong emission lines from [O ii], [O iii], Ly and Ly indicating activity in the underlying stellar population. The proximity of the Ne viii absorber to the galaxy is an important, though not conclusive, indicator of the absorption possibly arising in the extended hot halo of the galaxy. In the case of the Ne viii system towards HE reported by Savage et al. (2005), three sub- galaxies were identified within kpc and km s-1 of the absorber (Mulchaey & Chen, 2009). Both these Ne viii detections also show strong Ovi absorption ( mÅ). It is known from a number of absorber-galaxy studies that Ovi systems preferentially arise within the kpc environment of galaxies and even closer to galaxies (Sembach et al., 2004; Tumlinson et al., 2005; Stocke et al., 2006; Tripp et al., 2006; Wakker & Savage, 2009; Chen & Mulchaey, 2009). If Ne viii is always associated with strong Ovi systems, then they are also likely to be tracing collisionally ionized gas in circumgalactic environments. Investigating this correlation requires a large sample of Ne viii detections.
The [Z/H] dex metallicity derived from the hybrid model for this Ne viii absorber is more consistent with a halo origin rather than in the canonical WHIM structure tracing pristine IGM distant from galaxies, in which case lower metallicities are expected (Danforth et al., 2006). It is however important to bear in mind that the regions where galaxies interface with the IGM are complex environments influenced by a variety of inflow and outflow processes transferring matter and energy between the two systems. This blurs the distinction between what can be characterized as the halo or the IGM. It is difficult to be conclusive about the astrophysical origin of an absorption system based solely on one dimensional information obtained by probing a pencil-beam through such a complex environment.
6.1. Summary
We have reported on the detection of Ne viii lines in the intervening absorption system at in the COS high spectrum of the quasar PKS . This is the third clear detection of this ion in the low- IGM. The significant results are summarized as follows :
(1) Both members of the Ne viii doublet in the multiphase absorber are detected at high significance (above the level) in the COS spectrum. The Ne viii line has a rest-frame equivalent width of mÅ and an apparent column density of log , and the Ne viii line has mÅ and log . The Ne viii absorption extends over the same velocity interval as the strong absorption from Ovi lines.
(2) Also seen in the COS spectrum are Ly, C iii, O iii, O iv and Ovi associated with the absorber. The O iii line was a non-detection at the 3 significance level in the spectrum for this target. We measure mÅ and log . The Ly absorption was poorly detected in the low STIS spectrum. The higher sensitivity spectrum for Ly afforded by COS reveals subcomponent structure in H i, with an integrated apparent H i column density of log .
(3) The column density of Ne viii cannot be explained by gas that is purely photoionized by the extragalactic ionizing background radiation field. The detection of Ne viii requires collisionally ionized gas with K . Gas at this temperature is highly ionized with a trace neutral H i fraction of . From the Ly profile, we estimate the H i column in this warm collisional phase to be log , which suggests that the Ne viii is tracing a gas structure with a total hydrogen column density of cm-2.
(4) Hybrid models that simultaneously take into account both collisional ionization and photoionization reactions predict a metallicity of [Z/H] dex in the Ne viii gas phase. The density in this gas phase is constrained to cm-3 and total hydrogen column density to cm-2. Even in the hybrid models the production of Ne viii is through collisional ionization.
(5) The O v and Ovi absorptions are consistent with a multiphase origin, with contributions from both the K photoionized gas traced by the H i, C iii, O iii and O iv and the K collisionally ionized gas phase where the Ne viii is produced. The metallicity for the collisionally ionized gas phase is consistent with the [Z/H] metallicity range estimated by Howk et al. (2009) for the photoionized gas phase in this absorber.
(6) The Chen & Mulchaey (2009) imaging survey of the PKS field has identified a galaxy with rest-frame R magnitude of log () at a projected separation of kpc and at a systemic velocity of km s-1 from the Ne viii absorber.
(7) The proximity of the absorber to the galaxy and their modest velocity displacement from each other suggests the possibility of the Ne viii absorption arising in multiphase gas embedded in the hot halo of the galaxy. The physical properties and metallicity of the absorber are also consistent with an origin in a nearby intergalactic WHIM structure.
Acknowledgments : The authors thank the STS-125 team for completing a highly successful Hubble Space Telescope servicing mission in 2009. We are grateful to Gary Ferland and collaborators for developing the Cloudy photoionization code. We thank Orly Gnat for making the computational data on radiatively cooling models public. This research is supported by the NASA Cosmic Origins Spectrograph program through a sub-contract to the University of Wisconsin-Madison from the University of Colorado, Boulder. B.P.W acknowledges support from NASA grant NNX-07AH426. This research has made use of the NASA/IPAC Extragalactic Database (NED) which is operated by the Jet Propulsion Laboratory, California Institute of Technology, under contract with the National Aeronautics and Space Administration.
References
- Asplund et al. (2009) Asplund, M., Grevesse, N., Sauval, A. J., & Scott, P. 2009, ARA&A, 47, 481
- Bahcall et al. (1993) Bahcall, J. N., Jannuzi, B. T., Schneider, D. P., & Hartig, G. F. 1993, ApJ, 405, 491
- Bregman (2007) Bregman, J. N. 2007, ARA&A, 45, 221
- Brooks et al. (2009) Brooks, A. M., Governato, F., Quinn, T., Brook, C. B., & Wadsley, J. 2009, ApJ, 694, 396
- Cen & Ostriker (1999) Cen, R., & Ostriker, J. P. 1999, ApJ, 514, 1
- Cen et al. (2001) Cen, R., Tripp, T. M., Ostriker, J. P., & Jenkins, E. B. 2001, ApJ, 559, L5
- Cen & Fang (2006) Cen, R., & Fang, T. 2006, ApJ, 650, 573
- Cen & Ostriker (2006) Cen, R., & Ostriker, J. P. 2006, ApJ, 650, 560
- Chen & Mulchaey (2009) Chen, H.-W., & Mulchaey, J. S. 2009, ApJ, 701, 1219
- Bregman (2007) Bregman, J. N. 2007, ARA&A, 45, 221
- Dahlen et al. (2005) Dahlen, T., Mobasher, B., Somerville, R. S., Moustakas, L. A., Dickinson, M., Ferguson, H. C., & Giavalisco, M. 2005, ApJ, 631, 126
- Danforth & Shull (2005) Danforth, C. W., & Shull, J. M. 2005, ApJ, 624, 555
- Danforth et al. (2006) Danforth, C. W., Shull, J. M., Rosenberg, J. L., & Stocke, J. T. 2006, ApJ, 640, 716
- Danforth & Shull (2008) Danforth, C. W., & Shull, J. M. 2008, ApJ, 679, 194
- Danforth et al. (2010a) Danforth, C. W., Stocke, J. T., & Shull, J. M. 2010, ApJ, 710, 613
- Danforth et al. (2010b) Danforth, C. W., Keeney, B. A., Stocke, J. T., Shull, J. M., & Yao, Y 2010, ApJsubmitted, arXiv:1005:2191
- Davé et al. (2001) Davé, R., et al. 2001, ApJ, 552, 473
- Dixon et al. (2010) Dixon, W. V., et al. 2010, Cosmic Origins Spectrograph Instrument Handbook, Version 2.0 (Baltimore: STScI)
- Ferland et al. (1998) Ferland, G. J., Korista, K. T., Verner, D. A., Ferguson, J. W., Kingdon, J. B., & Verner, E. M. 1998, PASP, 110, 761
- Fitzpatrick & Spitzer (1997) Fitzpatrick, E. L., & Spitzer, L., Jr. 1997, ApJ, 475, 623
- Fox et al. (2004) Fox, A. J., Savage, B. D., Wakker, B. P., Richter, P., Sembach, K. R., & Tripp, T. M. 2004, ApJ, 602, 738
- Fox et al. (2005) Fox, A. J., Wakker, B. P., Savage, B. D., Tripp, T. M., Sembach, K. R., & Bland-Hawthorn, J. 2005, ApJ, 630, 332
- Froning & Green (2009) Froning, C. S., & Green, J. C. 2009, Ap&SS, 320, 181
- Fukugita et al. (1998) Fukugita, M., Hogan, C. J., & Peebles, P. J. E. 1998, ApJ, 503, 518
- Fukugita & Peebles (2004) Fukugita, M., & Peebles, P. J. E. 2004, ApJ, 616, 643
- Ghavamian et al. (2009) Ghavamian et al. 2009, Preliminary Characterization of the Post- Launch Line Spread Function of COS, http://www.stsci.edu/hst/cos/documents/isrs/
- Gnat & Sternberg (2007) Gnat, O., & Sternberg, A. 2007, ApJS, 168, 213
- Green (2001) Green, J. C. 2001, Proc. SPIE, 4498, 229
- Haardt & Madau (2001) Haardt, F., & Madau, P. 2001, Clusters of Galaxies and the High Redshift Universe Observed in X-rays.
- Howk et al. (2009) Howk, J. C., Ribaudo, J. S., Lehner, N., Prochaska, J. X., & Chen, H.-W. 2009, MNRAS, 396, 1875
- Jannuzi et al. (1998) Jannuzi, B. T., et al. 1998, ApJS, 118, 1
- Kereš et al. (2005) Kereš, D., Katz, N., Weinberg, D. H., & Davé, R. 2005, MNRAS, 363, 2
- Kereš & Hernquist (2009) Kereš, D., & Hernquist, L. 2009, ApJ, 700, L1
- Kim et al. (1997) Kim, T.-S., Hu, E. M., Cowie, L. L., & Songaila, A. 1997, AJ, 114, 1
- Lehner et al. (2006) Lehner, N., Savage, B. D., Wakker, B. P., Sembach, K. R., & Tripp, T. M. 2006, ApJS, 164, 1
- Lehner et al. (2007) Lehner, N., Savage, B. D., Richter, P., Sembach, K. R., Tripp, T. M., & Wakker, B. P. 2007, ApJ, 658, 680
- Lehner et al. (2009) Lehner, N., Prochaska, J. X., Kobulnicky, H. A., Cooksey, K. L., Howk, J. C., Williger, G. M., & Cales, S. L. 2009, ApJ, 694, 734
- Lockman & Savage (1995) Lockman, F. J., & Savage, B. D. 1995, ApJS, 97, 1
- Mulchaey & Chen (2009) Mulchaey, J. S., & Chen, H.-W. 2009, ApJ, 698, L46
- Narayanan et al. (2009) Narayanan, A., Wakker, B. P., & Savage, B. D. 2009, ApJ, 703, 74
- Narayanan et al. (2010a) Narayanan, A., Savage, B. D., & Wakker, B. P. 2010, ApJ, 712, 1443
- Narayanan et al. (2010b) Narayanan, A., Wakker, B. P., Savage, B. D., Keeney, B. A., Shull, J. M., Stocke, J. T., & Sembach, K. R. 2010, ApJaccepted, arXiv:1008.2797
- Oppenheimer & Davé (2009) Oppenheimer, B. D., & Davé, R. 2009, MNRAS, 395, 1875
- Osterman et al. (2010) Osterman, S., et al. 2010, ApJ, (in prep)
- Penton et al. (2000) Penton, S. V., Shull, J. M., & Stocke, J. T. 2000, ApJ, 544, 150
- Penton et al. (2004) Penton, S. V., Stocke, J. T., & Shull, J. M. 2004, ApJS, 152, 29
- Prochaska et al. (2004) Prochaska, J. X., Chen, H.-W., Howk, J. C., Weiner, B. J., & Mulchaey, J. 2004, ApJ, 617, 718
- Prochaska & Tumlinson (2009) Prochaska, J. X., & Tumlinson, J. 2009, Astrophysics in the Next Decade, Astrophysics and Space Science Proceedings, p. 419, 419, arXiv:0805.4635
- Richter et al. (2004) Richter, P., Savage, B. D., Tripp, T. M., & Sembach, K. R. 2004, ApJS, 153, 165
- Richter et al. (2006) Richter, P., Savage, B. D., Sembach, K. R., & Tripp, T. M. 2006, A&A, 445, 827
- Richter et al. (2006) Richter, P., Fang, T., & Bryan, G. L. 2006, A&A, 451, 767
- Savage & Sembach (1991) Savage, B. D., & Sembach, K. R. 1991, ApJ, 379, 245
- Savage et al. (2002) Savage, B. D., Sembach, K. R., Tripp, T. M., & Richter, P. 2002, ApJ, 564, 631
- Savage et al. (2005) Savage, B. D., Lehner, N., Wakker, B. P., Sembach, K. R., & Tripp, T. M. 2005, ApJ, 626, 776
- Savage et al. (2010) Savage, B. D., et al. 2010, ApJ, 719, 1526
- Sembach & Savage (1992) Sembach, K. R., & Savage, B. D. 1992, ApJS, 83, 147
- Sembach et al. (2004) Sembach, K. R., Tripp, T. M., Savage, B. D., & Richter, P. 2004, ApJS, 155, 351
- Shull & McKee (1979) Shull, J. M., & McKee, C. F. 1979, ApJ, 227, 131
- Shull (2009) Shull, J. M. 2009, American Institute of Physics Conference Series, 1135, 301
- Stocke et al. (2006) Stocke, J. T., Penton, S. V., Danforth, C. W., Shull, J. M., Tumlinson, J., & McLin, K. M. 2006, ApJ, 641, 217
- Thom & Chen (2008a) Thom, C., & Chen, H.-W. 2008, ApJ, 683, 22
- Thom & Chen (2008b) Thom, C., & Chen, H.-W. 2008, ApJS, 179, 37
- Tripp & Savage (2000) Tripp, T. M., & Savage, B. D. 2000, ApJ, 542, 42
- Tripp et al. (2000) Tripp, T. M., Savage, B. D., & Jenkins, E. B. 2000, ApJ, 534, L1
- Tripp et al. (2006) Tripp, T. M., Aracil, B., Bowen, D. V., & Jenkins, E. B. 2006, ApJ, 643, L77
- Tripp et al. (2008) Tripp, T. M., Sembach, K. R., Bowen, D. V., Savage, B. D., Jenkins, E. B., Lehner, N., & Richter, P. 2008, ApJS, 177, 39
- Tumlinson & Fang (2005) Tumlinson, J., & Fang, T. 2005, ApJ, 623, L97
- Tumlinson et al. (2005) Tumlinson, J., Shull, J. M., Giroux, M. L., & Stocke, J. T. 2005, ApJ, 620, 95
- Valageas et al. (2002) Valageas, P., Schaeffer, R., & Silk, J. 2002, A&A, 388, 741
- Verner et al. (1994) Verner, D. A., Barthel, P. D., & Tytler, D. 1994, A&AS, 108, 287
- Wakker et al. (2003) Wakker, B. P., et al. 2003, ApJS, 146, 1
- Wakker (2006) Wakker, B. P. 2006, ApJS, 163, 282
- Wakker & Savage (2009) Wakker, B. P., & Savage, B. D. 2009, ApJS, 182, 378
- Weymann et al. (1998) Weymann, R. J., et al. 1998, ApJ, 506, 1
- Williger et al. (2006) Williger, G. M., Heap, S. R., Weymann, R. J., Davé, R., Ellingson, E., Carswell, R. F., Tripp, T. M., & Jenkins, E. B. 2006, ApJ, 636, 631
- Wright (2006) Wright, E. L. 2006, PASP, 118, 1711
| HST ID | Date of Observation | Grating | FP-POS | Central Wavelength | Wavelength Range | Exposure Duration |
|---|---|---|---|---|---|---|
| (yyyy:mm:dd) | (Å) | (Å) | (sec) | |||
| LACB51010 | 2009-08-31 | G130M | 3 | 1291 | 984a,b | |
| LACB51020 | 2009-08-31 | G130M | 3 | 1300 | 650 | |
| LACB51030 | 2009-08-31 | G130M | 3 | 1309 | 1908 | |
| LACB51040 | 2009-08-31 | G130M | 3 | 1300 | 650 | |
| LACB51050 | 2009-08-31 | G130M | 3 | 1318 | 1908 | |
| LACB51060 | 2009-08-31 | G130M | 3 | 1300 | 650 | |
| LACB51070 | 2009-08-31 | G130M | 3 | 1327 | 1908 | |
| LB6822010 | 2009-12-21 | G160M | 3 | 1589 | 2167 | |
| LB6822020 | 2009-12-21 | G160M | 3 | 1600 | 2965 | |
| LB6822030 | 2009-12-21 | G160M | 3 | 1611 | 2965 | |
| LB6822040 | 2009-12-21 | G160M | 3 | 1623 | 2965 | |
| LB6823010 | 2009-12-21 | G130M | 1 | 1291 | 1000b | |
| 2009-12-21 | G130M | 2 | 1291 | 1400a,b | ||
| 2009-12-21 | G130M | 3 | 1291 | 1000a,b | ||
| 2009-12-21 | G130M | 4 | 1291 | 1430a,b |
Note. — Column (1) is the HST ID for the respective data set, column (2) shows the date of observation, column (3) lists the choice of grating, column (4) gives the FP position used with the grating setting, column (5) shows the grating central wavelength setting, column (6) gives the wavelength range covered under each setting and column (7) lists the duration of integration.
HST IDs dated 2009/08/31 are Early Release Observations (ERO) with program ID: 11508, and those dated 2009/12/21 are GTO observations with program ID: 11541 (P.I. James Green).
a The data sets used in the coaddition to produce the spectrum at the redshifted wavelength of Ne viii .
b The data sets used in the coaddition to produce the spectrum at the redshifted wavelength of Ne viii .
| Line | log | Method | ||||
|---|---|---|---|---|---|---|
| (mÅ) | (km s-1) | dex | (km s-1) | (km s-1) | ||
| Ly | [-240, 320] | AOD | ||||
| Ly | [-150, 150] | AOD | ||||
| Ly | … | Fit | ||||
| … | ||||||
| Ly | [-150, 150] | AOD | ||||
| Ovi | [-100, 150] | AOD | ||||
| Ovi | … | Fit | ||||
| … | ||||||
| Ovi | [-70, 105] | AOD | ||||
| Ne viii | [-100, 100] | AOD | ||||
| Ne viii | [-100, 100] | AOD | ||||
| O iv | [-100, 150] | AOD | ||||
| O iv | … | Fit | ||||
| … | ||||||
| … | ||||||
| O v | [-100, 150] | AOD | ||||
| C iii | [-100, 150] | AOD | ||||
| C iii | … | Fit | ||||
| … | ||||||
| … | ||||||
| O iii | [-100, 55] | 3 | ||||
| C ii | … | … | [-100, 150] | 3 | ||
| Niii | … | … | [-100, 150] | 3 | ||
| Nii | … | … | [-100, 150] | 3 | ||
| O iii | … | … | [-100, 150] | 3 | ||
| Si ii | … | … | [-100, 150] | 3 | ||
| Fe iii | … | … | [-100, 150] | 3 |
Note. — The Ly is FOS data. The O v Å is FUSE data. The Ly could be a 3 upper limit.
The different values for Ovi from the 1032, and 1038 suggests significant saturation for both lines. To first approximation, the true value is . Thus, . The error would be larger, dex.
The Ne viii Å line is a coaddition of four exposures (1 post-focus 1291 exposure and 3 GTO 1291 exposures). The Ne viii Å line is a coaddition of five exposures (1 post-focus 1291 exposure and 4 GTO 1291 exposures).
![[Uncaptioned image]](/html/1008.3192/assets/x1.png)
![[Uncaptioned image]](/html/1008.3192/assets/x2.png)
Fig. 1a – Continuum normalized spectrum of PKS showing absorption profiles and wavelength regions of some prominent lines in the metal line absorption system. The display is in the rest-frame of the absorber, with km s-1 corresponding to . All panels are showing /COS spectrum, except O v and Ly which are covered by and FOS observations respectively. The individual exposures used to produce the coadded COS spectrum are listed in table 1. Ly, Ovi , Ne viii , O iv , C iii , O iii are COS detections of significance. Features that are not part of the absorption system are marked ”x” in each panel. The line measurements are listed in table 2.
![[Uncaptioned image]](/html/1008.3192/assets/x3.png)
![[Uncaptioned image]](/html/1008.3192/assets/x4.png)
Fig. 1b – Continuation of Figure 1a.