11email: ivan,asplund,pbaumann@mpa-garching.mpg.de 22institutetext: Centro de Astrofísica da Universidade do Porto, Rua das Estrelas 4150-762 Porto, Portugal
22email: jorge@astro.up.pt 33institutetext: European Southern Observatory, Alonso de Cordova 3107, Vitacura, Casilla 19001, Santiago 19, Chile
33email: tbensby@eso.org
A possible signature of terrestrial planet formation
in the chemical composition of solar analogs
Recent studies have shown that the elemental abundances in the Sun are anomalous when compared to most (about 85 %) nearby solar twin stars. Compared to its twins, the Sun exhibits a deficiency of refractory elements (those with condensation temperatures K) relative to volatiles ( K). This finding is speculated to be a signature of the planet formation that occurred more efficiently around the Sun compared with the majority of solar twins. Furthermore, within this scenario, it seems more likely that the abundance patterns found are specifically related to the formation of terrestrial planets. In this work we analyze abundance results from six large independent stellar abundance surveys to determine whether they confirm or reject this observational finding. We show that the elemental abundances derived for solar analogs in these six studies are consistent with the trend suggested as a planet formation signature. The same conclusion is reached when those results are averaged heterogeneously. We also investigate the dependency of the abundances with first ionization potential (FIP), which correlates well with . A trend with FIP would suggest a different origin for the abundance patterns found, but we show that the correlation with is statistically more significant. We encourage similar investigations of metal-rich solar analogs and late F-type dwarf stars, for which the hypothesis of a planet formation signature in the elemental abundances makes very specific predictions. Finally, we examine a recent paper that claims that the abundance patterns of two stars hosting super-Earth like planets contradict the planet formation signature hypothesis. Instead, we find that the chemical compositions of these two stars are fully compatible with our hypothesis.
Key Words.:
stars: abundances – Sun: abundances – stars: planetary systems1 Introduction
Finding planets outside the solar system is one of the major endeavors of contemporary astrophysics. Large efforts to detect them using radial velocity, transits, and microlensing observations are currently underway as they have been proven successful. Indeed, more than 450 extrasolar planets have been discovered to date. A majority of the planets that have been detected have masses similar to that of Jupiter and a significant fraction of them are in close-in, short-period orbits, hence their classification as “hot Jupiters” (see, e.g., the review by Udry & Santos 2007). The parent stars are mostly G and K dwarfs. Due to the intrinsic limitations of the techniques currently used to find exoplanets, however, terrestrial planets in Earth-like orbits have remained elusive. This situation may change in the next few years as transiting data from the Kepler mission (Basri et al. 2005) are scrutinized spectroscopically. In the meantime, we face the challenge of developing new practical techniques to find those objects.
Comparisons of the chemical composition of stars that host extrasolar planets and stars for which planets have not yet been detected have been performed by a number of groups (e.g., Gonzalez et al. 2001; Sadakane et al. 2002; Heiter & Luck 2003; Santos et al. 2004; Fischer & Valenti 2005). These studies unanimously agree on the metal-rich nature of planet hosts (i.e., stars known to host planets are on average more metal-rich than a typical field star), first suggested by Gonzalez (1997). From a practical point of view, this result can be used to increase the efficiency of exoplanet searches. Note, however, that it is not clear whether evolved stars which host planets are, on average, more metal-rich than a typical field star (e.g., Hekker & Meléndez 2007; Pasquini et al. 2007; Takeda et al. 2008).
Attempts have been made to find other indicators in the photospheric chemical composition of stars that would suggest the presence of extrasolar planets. For instance, it has been suggested that the lithium abundances in stars that host planets are more depleted than those in single stars (e.g., Chen & Zhao 2006; Gonzalez 2008; Israelian et al. 2009) as a result of a star-planet interaction that has led to enhanced mixing and/or deepening of the convective zone. This, in turn, increases the rate of lithium burning in the stellar interior. It is possible, however, that these results have been affected by a combination of heterogeneous abundance results or, more importantly, observational biases related to stellar age and metallicity (Ryan 2000; Luck & Heiter 2006; Meléndez et al. 2010; Baumann et al. 2010). Therefore, the possible connection between lithium abundance and presence of planets is not conclusive.
Meléndez et al. (2009, hereafter M09) have shown that the chemical composition of the Sun is anomalous when compared to stars of very similar fundamental parameters, so called “solar twins.” Inspection of abundance trends with condensation temperature () revealed, for the first time, that, compared to most solar twins (about 85 %), the Sun has a deficiency of refractory elements (K) relative to volatiles (K). In the solar photosphere, elements with the highest are depleted by about 20 % relative to volatiles. A 20 % difference in relative abundances (about 0.08 dex in the standard [X/H] scale)111We use the standard notation: +12, where is the number density of the element X ; ; and . is extremely difficult to detect because systematic errors are often of similar magnitude or larger. In the M09 study, those errors were minimized by analyzing only stars with fundamental parameters very similar to solar, for which systematic errors in the derived abundances cancel-out in a strictly differential analysis. Using a different sample of stars and a new set of observations (solar twins in the northern hemisphere as opposed to southern hemisphere stars as in the M09 case), Ramírez et al. (2009, hereafter R09) determined abundance trends with condensation temperature which are in excellent agreement with those found by M09. Both the amplitude of the effect ( % deficiency of refractories relative to volatiles) and the frequency of stars in which the trend is observed ( %) were confirmed by this latter study. More recently, Gonzalez et al. (2010) have confirmed both M09 and R09 results using a different sample of stars and approach to the analysis of the stellar abundance data. In addition, they explore the impact of effective temperature and metallicity on these abundance trends.
M09 have speculated that this “solar abundance anomaly” is due to the formation of planets in the solar system, and possibly specifically the terrestrial planets, because the missing refractories are currently inside them. If this hypothesis is proven correct, very precise relative abundances could be used to identify stars that harbor terrestrial planets. A lack of correlation in the abundances relative to solar with would indicate the presence of such systems around other stars. The amount of observing time required to identify planet hosts with this “abundance method” is orders of magnitude smaller than that necessary to detect planets using radial velocity or transit techniques. Only one set of observations is required per star, in contrast to the lengthy campaigns that have to be carefully designed to detect very small radial velocity or photometric variations.
The identification of terrestrial planet hosts using abundances will help us to answer important questions such as (1) how rare is the solar system? and (2) which types of stars are more likely to host terrestrial planets? However, the connection between the abundance trends with condensation temperature and terrestrial planet formation needs to be explored further.
A large number of stellar photospheric chemical composition studies have been published to date. Only a few, however, are based on a homogeneous analysis of high quality data for large samples of stars and deal with more than a handful of chemical elements. In this paper, we compile results from six of those studies. We concentrate on stars that are similar to the Sun, since the signature is difficult to detect and possibly blurred by systematic errors in larger samples including stars with significantly different fundamental parameters. We analyze the trends with condensation temperature for these samples and check whether other independent studies of stellar abundances support the observational findings of M09 and R09.
2 Sample selection and abundances adopted
We have compiled abundance results from six independent studies: Reddy et al. (2003, hereafter R03), Allende Prieto et al. (2004, hereafter A04), Takeda (2007, hereafter T07), Neves et al. (2009, hereafter N09), Gonzalez et al. (2010, hereafter G10), and Bensby et al. (in preparation; hereafter BFO). A common characteristic among these studies is the homogeneity of the analysis and the high quality of the data employed. Each has adopted a unique temperature scale, spectral line selection, and method of abundance determination. In addition, abundances were determined from equivalent width matching and/or line-profile fitting using spectra of high resolution () and high signal-to-noise ratio (). In all cases, abundances for at least 10 elements were determined.
| Sample | Solar analogs range | Number |
|---|---|---|
| of stars | ||
| Reddy et al. (2003) | K / / | 11 |
| Allende Prieto et al. (2004) | K / / | 12 |
| Takeda (2007) | K / / | 14 |
| Neves et al. (2009) | K / / | 19 |
| Gonzalez et al. (2010) | K / / | 11 |
| Bensby et al. (in preparation) | K / / | 20 |
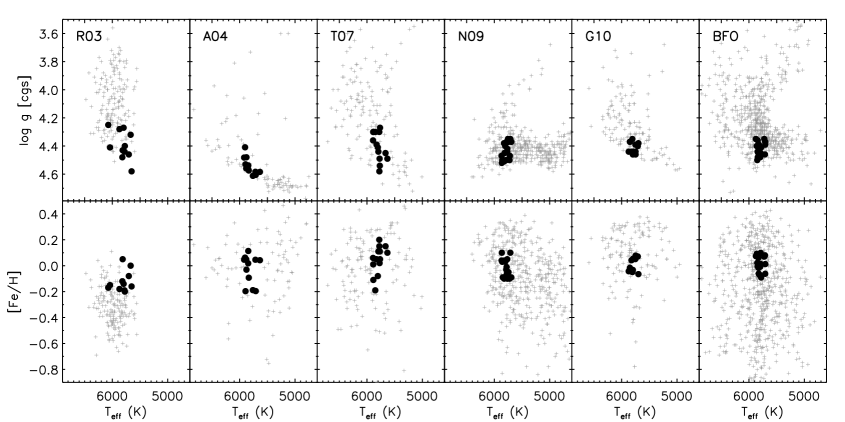
From each sample, only those stars with fundamental parameters () within a certain range from the solar values () were selected. In the R09 study, the ranges adopted were K in effective temperature, dex in surface gravity, and dex in iron abundance. An identical selection was made for the N09, G10, and BFO samples. For the R03, A04, and T07 samples, however, we used wider ranges of allowed stellar parameters in order to have at least 10 solar analogs, as detailed in Table 1. The number of stars selected from each study are listed also in Table 1. In Fig. 1 we illustrate the overall properties of each sample, highlighting the location of the stars selected for this work.
R03 used spectra obtained with the Robert G. Tull spectrograph on the 2.7 m Telescope at McDonald Observatory. The main goal of this work was to study Galactic chemical evolution using 181 nearby stars, almost all of them members of the Galactic thin disk. They derived abundances for 27 elements. The R03 results were complemented with data for 176 stars with high probability of being thick-disk members by Reddy et al. (2006). If we include the data from this later study in our work, the precision of the average abundance ratios that we derive for solar analogs (cf. Sect. 3) decreases from about 0.05 to 0.09 dex. The abundance trend we find with condensation temperature becomes more noisy but its shape does not change significantly. We did not include the Reddy et al. (2006) results in our work because we require the highest precision possible. Small changes in the determination of stellar parameters between R03 and Reddy et al. (2006) and the slightly lower quality of the data employed by the latter may be responsible for the increased scatter of the combined sample.
A04 performed a volume limited survey of 118 stars more luminous than mag within a 15 pc radius from the Sun. Their data were obtained at McDonald Observatory and with the FEROS spectrograph on the 1.52 m Telescope at La Silla. A04 derived abundances for 16 elements. The spectra from the A04 survey are available online.222Spectroscopic Survey of Stars in the Solar Neighborhood (S4N): http://leda.as.utexas.edu/s4n/. We re-determined the stellar parameters of a number of solar analogs using these data and the methods described in R09. We found a mean difference of 152 K in and 0.06 dex in between the re-derived parameters and those given by A04, with the latter being systematically smaller. Indeed, the zero point of the temperature scale adopted by A04 has been recently revised and found to be significantly cooler than previously thought (Casagrande et al. 2010). A04 provide detailed tables that allowed us to compute corrections to the abundances of all elements given an effective temperature correction. Thus, we applied a +152 K correction to the parameters and abundances from A04. We did not correct the abundances for the shift in values because there are no corresponding correction tables. The selection of solar analogs from this study was made after the correction to the abundances was applied. This type of correction was not possible for the other samples because the observational data are not publicly available, thus preventing us from determining the temperature correction required, and because none of the other studies provide detailed tables of abundance corrections for given shifts in fundamental parameters. We discuss the implication of this correction for the A04 results to our work in Sect. 3.
Fundamental parameters and elemental abundances of 15 elements for 160 FGK dwarf and subgiant stars observed with the 1.88 m Telescope at Okayama Astrophysical Observatory were presented by T07. This work discusses chemical evolution, comparison of abundances in planet-host and single stars, and empirical tests of the validity of the LTE approximation in abundance studies.
Using spectra from the HARPS/GTO planet search programs, N09 determined abundances of 12 elements in 451 stars. The stellar parameters adopted in this study are from Sousa et al. (2008). The wavelength coverage and typical S/N of the HARPS data is unfortunately not appropriate to derive precise abundances of the volatile elements C, N, and O. However, very precise abundances for many refractory elements are given by N09.
For more than a decade, G. Gonzalez and collaborators have collected high quality spectra and analyzed them homogeneously to derive precise stellar parameters and abundances with the goal of investigating the connection between stellar abundances and extrasolar planets (e.g., Gonzalez 1997, 1998; Gonzalez et al. 2001). In their most recent publication (G10), the abundance correlation with condensation temperature is explored for about 85 % of their 85 stars with planets and 59 stars not known to host planets. The approach used in G10 consists of a differential comparison of abundance trends weighted by the distance between stars in stellar parameter space, as defined in Gonzalez (2008). In this way they are able to perform differential analyses not restricted to solar twins. Abundances for ten elements are available from G10 although a comment must be made about their Sc abundances, which are based on two Sc ii lines. In R09, three Sc i lines were preferred. The reason was that the star-to-star scatter obtained by R09 for their solar twins reduced from 0.038 dex for Sc ii to 0.018 dex for Sc i. The average [Sc/Fe] abundance ratio for Sc i lines was 0.024 dex while that for Sc ii lines was . Although non-LTE effects are expected to be stronger for the Sc i lines, the [Sc i/Fe] ratio, which is the quantity that we use in this paper, might be less sensitive to non-LTE because the iron abundances are dominated by the large number of Fe i lines. It is likely that the systematic errors are more similar between Fe i and Sc i lines than between Fe i and Sc ii, making Sc i lines more reliable for strictly differential analysis. We proceed our study including the Sc abundances from G10 but we will also comment on how their exclusion, justified by the statements made above, affects the conclusions.
Bensby et al. (2003, 2005) presented abundances for 12 elements in 102 F and G dwarf stars in the solar neighborhood based on high-resolution spectra obtained with the FEROS/ESO 1.5m, SOFIN/NOT, and UVES/VLT spectrographs. Expanding those studies, the BFO study will contain a total of 703 F and G dwarf stars, adding new stars that have been observed with the MIKE spectrograph on the 6.5 m Clay Magellan telescope. These new spectra cover the full optical wavelength regime (350-920 nm), have high spectral resolution (), and high signal-to-noise ratio (). As the analysis method in BFO is very similar to Bensby et al. (2003, 2005), the uncertainties in stellar parameters and abundance ratios are similar as well. First results from this expanded data set have been presented in Bensby et al. (2007a, b), Feltzing & Bensby (2008), and Bensby & Feltzing (2010). The relevant atomic data adopted by BFO are given in Bensby et al. (2003).
The oxygen abundances from the BFO work were derived by them from the 777 nm O i triplet lines, which are known to be severely affected by non-LTE (e.g., Fabbian et al. 2009). Although the range in stellar parameters adopted for the solar analogs in this sample is small, R09 have found that differential non-LTE corrections slightly improve the results. Therefore, we corrected the oxygen abundances from BFO using the non-LTE correction tables by Ramírez et al. (2007). We find that the star-to-star scatter in the average [O/Fe] abundance ratio that we derive for the solar analogs from the BFO study decreases from 0.048 dex in LTE to 0.038 dex in non-LTE. We did not use the more recent non-LTE corrections by Fabbian et al. (2009) because their tables do not cover . The differential non-LTE correction (star relative to Sun) by Ramírez et al. (2007) for a star that is 100 K warmer than the Sun (the other parameters being solar) is about 0.01 dex greater than that by Fabbian et al. (2009). A similar calculation for a star yields a difference of –0.02 dex. The impact of differences is negligible within the range allowed for solar analogs in this paper. These differences are small but could have an impact on the average [O/Fe] abundance ratios we derive. Unfortunately, we are unable to use Fabbian et al. (2009) non-LTE correction tables for the reason exposed above.
As shown by Bensby et al. (2003, 2005), abundance ratios of kinematically selected thin- and thick-disk stars are very similar at . This is not the case at lower metallicities. We checked that the results presented in Sect. 3 are not affected by the inclusion of thick-disk solar analogs (i.e., excluding them did not have a significant impact). Only about 15 % of the stars studied in this paper have high kinematic probability of being thick-disk members, a number that is roughly consistent with current estimates of the fraction of thick-disk stars in the solar neighborhood.
3 Abundances versus condensation temperature
For each of the six samples analyzed in this paper we determined an average [X/Fe] vs. relation. For each element X, we calculated an average [X/Fe] and standard deviation with the data for the solar analogs (weighted by the observational errors, when available). We adopted the 50 % equilibrium condensation temperatures for a solar system composition gas computed by Lodders (2003). The resulting average [X/Fe] vs. relations are shown in Fig. 2, along with the corresponding relation found by R09. Table 3 lists the average [X/Fe] abundance ratios of solar analogs that we obtain for each of the six studies used in this paper. We also list in Table 3 our adopted condensation temperature and first ionization potential for each element. The latter are adopted from the “Atomic Properties of the Elements” compilation by the National Institute of Standards and Technology (NIST).333Available online at http://www.nist.gov/physlab/data/periodic.cfm In Table 3 we show the average [X/Fe] abundance ratios of solar twin stars from the M09 and R09 studies. The adopted condensation temperatures and first ionization potentials for the elements studied in these two papers are given in Table 3, except for element P (Z=15), which is only covered by the M09 study ( K, eV).
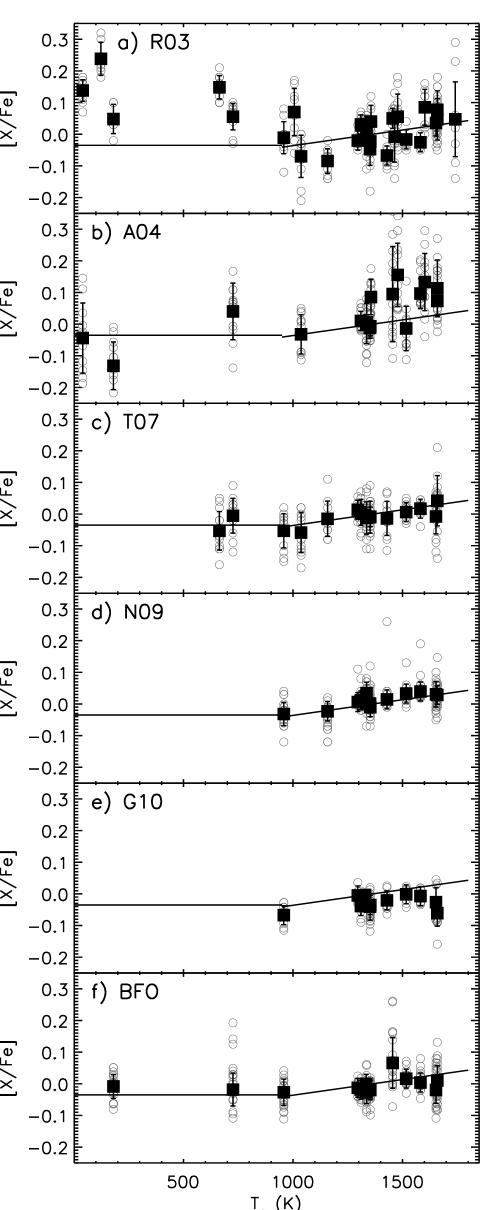
The abundances of volatile elements in the solar analogs from the R03 study are in severe disagreement with those found by R09 but their trends for the refractory elements are in reasonably good agreement (Fig. 2a). In this study, the spectroscopically determined abundances, relative to iron, of carbon, nitrogen, and oxygen, which are the elements with the lowest in Fig. 2a, are very sensitive to errors in the scale adopted. The sensitivity of these elements is stronger than that of other elements. R03 noticed, for example, that their [C/Fe] abundance ratios are systematically higher by 0.15 dex compared to those by Edvardsson et al. (1993), and attributed the difference to an offset of about 80 K in the scales adopted. Their [N/Fe] abundance ratios were determined from the analysis of two weak N lines. Errors in the continuum determination of weak lines may lead to severely overestimated equivalent widths when noisy data are used. In these cases, relative abundances can be systematically off if the reference spectrum (the solar one) has much higher signal-to-noise ratio, as is often the case. Indeed, R03 noted that their N abundances are about 0.2 dex higher on average compared to those determined by Clegg et al. (1981), who used also atomic N lines. The other two elements that depart significantly from the R09 result are Zn and S. In addition to potential systematic and statistical errors which could have resulted in R03 abundances being significantly higher than those by R09, it should be noted that this sample is, on average, slightly more metal-poor than the Sun (Fig. 1). This behavior is not observed in any of the other samples of solar analogs, which are shown to distribute uniformly around . Thus, it is also possible that small chemical evolution effects are partially responsible for the discrepancy observed. Indeed, the four lowest elements from the R03 work show decreasing abundance ratios with , although the slopes are dissimilar for the different elements (see Fig. 9 in R03).
The A04 abundances seem to broadly agree with the solar abundance anomaly reported by M09 and R09, despite the relatively large uncertainties (Fig. 2b). On average, volatiles have whereas refractories have an average [X/Fe] of about 0.02 (weighted average). The trend appears to be steeper compared to R09 but the overall behavior of the abundances with is qualitatively similar. Since we shifted the parameters and abundances from A04 following a 152 K offset in (Sect. 2), it is important to investigate the results using the original values. In this case the average abundance ratio of volatiles is about 0.08 dex whereas that corresponding to the refractories is about 0.09 dex. The linear trend for the refractories is conserved but the difference in average abundance between volatiles and refractories decreases significantly. The result using the original abundances resembles somewhat the R03 result (although the abundances of volatiles are not that high in the A04 case), which reinforces our suspicion that the abundances of volatiles in these two studies (the original ones in the A04 case) are too high due to errors in the scale. As mentioned in Sect. 2, the scale adopted in these two studies, namely that by Alonso et al. (1996), has been recently shown to suffer from a relatively large systematic error ( K) in its zero point (Casagrande et al. 2010).
| Z | El. | FIP | R03 | A04 | T07 | N09 | G10 | BFO | |
|---|---|---|---|---|---|---|---|---|---|
| (K) | (eV) | ||||||||
| 6 | C | 40 | 11.26 | ||||||
| 7 | N | 123 | 14.53 | ||||||
| 8 | O | 180 | 13.62 | ||||||
| 11 | Na | 958 | 5.14 | ||||||
| 12 | Mg | 1336 | 7.65 | ||||||
| 13 | Al | 1653 | 5.99 | ||||||
| 14 | Si | 1310 | 8.15 | ||||||
| 16 | S | 664 | 10.36 | ||||||
| 19 | K | 1006 | 4.34 | ||||||
| 20 | Ca | 1517 | 6.11 | ||||||
| 21 | Sc | 1659 | 6.54 | ||||||
| 22 | Ti | 1582 | 6.82 | ||||||
| 23 | V | 1429 | 6.74 | ||||||
| 24 | Cr | 1296 | 6.77 | ||||||
| 25 | Mn | 1158 | 7.43 | ||||||
| 27 | Co | 1352 | 7.86 | ||||||
| 28 | Ni | 1353 | 7.63 | ||||||
| 29 | Cu | 1037 | 7.73 | ||||||
| 30 | Zn | 726 | 9.39 | ||||||
| 38 | Sr | 1464 | 5.70 | ||||||
| 39 | Y | 1659 | 6.38 | ||||||
| 40 | Zr | 1741 | 6.84 | ||||||
| 56 | Ba | 1455 | 5.21 | ||||||
| 58 | Ce | 1478 | 5.47 | ||||||
| 60 | Nd | 1602 | 5.49 | ||||||
| 63 | Eu | 1356 | 5.67 |
Fig. 2c shows that the abundance data for solar analogs by T07 are consistent with the [X/Fe] vs. trend found in our previous papers. The most volatile elements (C, N, O) are not covered by T07 but the break in the trend at about K, which is crucial for the interpretation of this abundance trend (Sect. 4), appears to be detected.
The abundance vs. trend obtained for the N09 sample of solar twins is in excellent agreement with R09 and M09 (Fig. 2d). Note, however, that this comparison is limited to refractory elements since no volatiles were analyzed by N09. In any case, both the overall effect detected by M09 and R09 and the value of the [X/Fe] vs. slope for K are in good agreement with the N09 data for solar analogs. Moreover, of the 19 solar analogs from N09 show a [X/Fe] vs. slope close to zero (the uncertainties in the abundance ratios of individual stars prevent us from determining this number more accurately). This frequency of stars which do not follow the trend (10–20 %) is also in good agreement with the % frequency found by both R09 and M09. A previous investigation of trends by the same group has been published before (Ecuvillon et al. 2006). This previous work was unable to reach strong conclusions regarding trends, probably because no investigation of solar twin stars alone was made. This study also adopted solar abundances from other works, mainly Anders & Grevesse (1989), instead of performing a strictly differential analysis using their own solar spectra. We have shown that both the sample restriction to solar twins and strictly differential analysis are necessary to detect the small trend in the abundances. The fact that this group (Ecuvillon et al. 2006; Neves et al. 2009) has now been able to detect the abundance signature using our approach (Gonzalez Hernandez et al. 2010) confirms this statement.
In the range between about 900 and 1600 K, the agreement between the R09 [X/Fe] vs. trend and that given by the G10 solar twin data is good, albeit a very small offset in [Fe/H] of at most 0.02 dex (Fig. 2e). The two elements with the highest in the G10 work are Al and Sc. The average Al abundance from G10 is in good agreement with that by R09 and they are both within about 1- of the mean [X/Fe] vs. trend. This is not the case for the Sc abundance by G10. As explained in Sect. 2, this discrepancy may be due to the use of Sc ii lines in the G10 work as opposed to Sc i lines as in R09. The latter were shown to reveal less star-to-star scatter for the solar twins and therefore they are expected to be more reliable in strictly differential analysis. With the exception of the Sc abundances, the trend in the G10 data is consistent with that in R09 and M09.
Although the average [X/Fe] vs. trend obtained for the BFO data is in agreement with the R09 result within 1-, it is clear that the trend of refractories is slightly more shallow in the BFO case (Fig. 2f). The difference in the mean abundance of refractory and volatile elements, weighted by the errors, is only about 0.01 dex, but the sign of such difference is in agreement with all other studies presented thus far in this paper as well as M09 and R09.
In Fig. 3 we show an average [X/Fe] vs. relation for all six samples (\al@reddy03,allende04:s4n,takeda07:abundances,neves09,gonzalez10,bensby11; \al@reddy03,allende04:s4n,takeda07:abundances,neves09,gonzalez10,bensby11; \al@reddy03,allende04:s4n,takeda07:abundances,neves09,gonzalez10,bensby11; \al@reddy03,allende04:s4n,takeda07:abundances,neves09,gonzalez10,bensby11; \al@reddy03,allende04:s4n,takeda07:abundances,neves09,gonzalez10,bensby11; \al@reddy03,allende04:s4n,takeda07:abundances,neves09,gonzalez10,bensby11) combined. For the elements present in more than one study we computed the weighted mean of the individually averaged results. We excluded the R03 results for the volatiles because they are likely affected by systematic errors in the temperature scale, measurement of equivalent widths, and/or chemical evolution effects, as explained above. We also excluded the K abundances from this study because of their large internal error ( dex) and the fact that they are based on the analysis of only one very strong feature ( mÅ), which could be affected by continuum placement and saturation. The impact of the mean Sc abundance from the G10 solar analogs, which we suspect to be slightly off, on this result is minor but we excluded it for consistency. The agreement of this average [X/Fe] vs. trend with the M09 and R09 results is good, but we emphasize the fact that this is an heterogeneous compilation of abundances and that the different samples used for this compilation exhibit a slightly different behavior when analyzed separately. In fact, we argue that because the data used to make this figure are heterogeneous and still show a clear abundance vs. correlation, it strengthens the findings of M09 and R09. The [X/Fe] abundance ratios for the average of the six samples combined are given in Table 3.


Inspection of Fig. 2 clearly reveals that the results obtained for the R03 and A04 samples are much more noisy than those given in the more recent papers. We note that these two older studies are not purely spectroscopic. They both use photometric data to estimate effective temperatures and trigonometric parallaxes to determine the surface gravities, therefore they are not strictly differential. This is not the case for the more recent papers, which use only the spectra to determine the stellar parameters. To make sure that Fig. 3 is not biased by these two older studies, we re-computed the average abundances but only for T07, N09, G10, and BFO. The result is shown in Fig. 4, where it can be seen that the conclusion is not altered by excluding the more noise data. The last column of Table 3 gives the average abundance ratios plotted in Fig. 4.
None of the abundance studies scrutinized in this paper disagree with the M09 and R09 results. In particular, with the exception of the R03 results, which we suspect to be in error for the volatiles, none of them suggest a significant enhancement of volatiles with respect to refractories. Although very good agreement with our previous results is only found for two of the six studies, the other four are still consistent with them.
The internal errors in the abundance ratios of the six studies used in this paper are expected to be in the 0.04 to 0.10 dex range, which is similar to the amplitude of the effect detected by M09 and R09. The latter, on the other hand, reported abundance ratios with a precision of about 0.01 and 0.03 dex, respectively, which were achieved thanks to the extremely high quality and homogeneity of the data, as well as the high internal consistency of the analysis. Therefore, it is not surprising that the trends observed by M09 and R09 were more difficult to detect in the six studies compiled for this paper.
4 A signature of terrestrial planet formation?
As explained by M09 and also R09, the solar abundance anomaly (i.e., the deficiency of refractory elements relative to volatiles in the Sun as compared to solar twins) can be interpreted as a signature of the formation of planets, and perhaps more specifically terrestrial planets, in the solar system. They speculate that the accretion of chemically fractionated material into the solar convective envelope during the formation of the solar system made its chemical composition pattern depleted in refractories as these elements were retained by the planets. The fact that the total mass of refractories in the terrestrial planets of the solar system today is of the same order of magnitude as the mean observed difference between refractories and volatiles in the Sun relative to solar twins supports the hypothesis of a terrestrial planet signature, as well as the observed abundance pattern of meteorites, which mirrors the solar abundance anomaly (Alexander et al. 2001; Ciesla 2008).
Fig. 3 shows that the abundance ratios are a roughly linear increasing function of condensation temperature for K but they become nearly constant for K. This suggests that the process responsible for the observed trend affects only elements with K.444Note that our abundance ratios are all relative to Fe, which, within our “planet formation signature” scenario, is depleted in the solar photosphere. Had we chosen a volatile element as reference, abundance ratios of K elements would be nearly constant at about zero. These high temperatures are only found in the inner parts (2 AU) of protoplanetary disks, regions which, at least in the solar system, are inhabited by terrestrial planets. Moreover, M09 analyzed the abundance vs. trends of about 10 solar analogs with and without detected giant gas planets. They found that those stars hosting hot Jupiters all behave like the majority of solar twin stars, i.e., they have a chemical composition slightly different from solar. More striking is the fact that the fraction of stars which closely resemble the Sun in their chemical composition is about 70 % if the star does not have a close-in giant planet. Within our interpretation of the trend as a planet signature, we are led to conclude that the presence of hot Jupiters prevents the formation of terrestrial planets. One could also speculate that in those systems, the smaller planets have already been accreted by the host star, thus removing the initially imprinted abundance signature.
In order for this proposed terrestrial planet signature to be imprinted in the chemical composition of the Sun, however, a quite short time-scale for the formation of the solar convective zone and/or an unusually long lived protoplanetary disk are required (M09, Nordlund 2009, Gustafsson et al. 2010). Standard hydrostatic models for the early evolution of the solar interior suggest that it took about 30 Myr for the convective zone to reach its present size (e.g., D’Antona & Mazzitelli 1994) while age determinations of observed disks around young stars suggest that they dissipate in about 10 Myr, at most (e.g., Mamajek 2009; Meyer 2009; Fedele et al. 2010). If this were the case, the chemically fractionated material would have been mixed efficiently in an early massive convective zone and the signature of planet formation would have been diluted. Hydrodynamic models of early stellar evolution, however, suggest that the Sun was never fully convective and that the internal structure of the early Sun ( Myr) was not very different from that of the current Sun (Wuchterl & Tscharnuter 2003). Within this latter scenario, the abundance signature can be effectively imprinted, even if the protoplanetary disk was short-lived. Another alternative for solving this problem involves the inclusion of episodic accretion in early stellar evolution calculations, which tends to decrease the size of the convective envelope (Baraffe et al. 2009; Baraffe & Chabrier 2010).


The condensation temperatures of elements correlate very well with their first ionization potentials (FIP), as shown in Fig. 5 for the elements analyzed in this paper. One may therefore question whether the abundance trend with that we attribute to planet formation is instead due to an FIP-related effect. The abundances of low FIP elements in the (average quiet) upper solar atmosphere are found to be about 4 times greater than those observed in the photosphere (e.g., Feldman 1992). This so-called “FIP effect” is attributed to the acceleration of low FIP ions from the chromosphere into higher layers, a process probably driven by magnetic fields (e.g., Hénoux 1998). The FIP effect is not expected to affect the photospheric abundances. Nevertheless, we compared the significance of the correlation between [X/Fe] and FIP with that corresponding to for the samples analyzed in this paper as well as those from the M09 and R09 studies. The results are given in Fig. 6 and Tables 5 and 6.
| Sample | ||||
|---|---|---|---|---|
| (vs. FIP) | (vs. ) | |||
| R03 | 54.8 | 51.5 | ||
| A04 | 1.5 | 1.4 | ||
| T07 | 55.9 | 21.1 | ||
| N09 | 61.9 | 7.9 | ||
| G10 | 60.7 | 63.9 | ||
| BFO | 50.6 | 38.2 | ||
| R09 | 9.7 | 0.8 | ||
| M09 | 1.3 | 0.1 | ||
| Sample | slope | slope | ||||
|---|---|---|---|---|---|---|
| (vs. FIP) | (vs. ) | |||||
| R03 | 10.0 | 0.380 | 13.5 | 1.6 | ||
| A04 | 3.8 | 0.626 | 2.8 | 2.6 | ||
| T07 | 58.7 | 0.386 | 25.1 | 1.2 | ||
| N09 | 61.9 | 0.576 | 7.9 | 2.0 | ||
| G10 | 60.7 | 0.063 | 63.9 | 1.0 | ||
| BFO | 55.5 | 0.322 | 36.3 | 0.9 | ||
| R09 | 46.2 | 0.588 | 5.1 | 2.9 | ||
| M09 | 17.4 | 0.682 | 0.6 | 2.6 | ||
In most cases, the Spearman correlation coefficient (in absolute value) is larger for the trend than the FIP trend. For the R03 and A04 samples, these values are similar although both correlations (FIP and ) are much more significant in the A04 case. The result for the G10 data suggests a lack of correlation with both FIP and . However, this is mainly due to their Sc abundances (see below for a quantitative statement), which we suspect to have a small but significant error in its zero point (Sect. 2). In four of the samples listed in Table 5 the trend has a correlation coefficient greater than 0.5. Only two samples show similarly high correlation coefficients for the FIP trends. In none of the cases investigated here is the correlation with FIP much more significant than that with . This situation is made even more clear when only the abundances of refractory elements are analyzed (Table 6). The correlation coefficients for the trends suggest a similar or higher significance compared to the FIP trends for all samples except G10, unless we exclude their Sc abundances that have a suspected small offset, in which case for FIP and for . For four cases the FIP trend is not significant (T07, N09, G10, and BFO). We also note that a linear fit to the abundance vs. trend of refractories is, for the majority of cases, more significant than the FIP trend. For example, the slope with for the N09 sample is significant at the 2.0 level whereas that corresponding to the FIP trend is not significant at all. For the G10 results excluding Sc we find that the slope divided by its error is about 5 times larger (in absolute value) than that corresponding to the FIP trend. Thus, we find that, statistically, the [X/Fe] abundance ratios correlate better with than FIP. Note that this is particularly true for the M09 and R09 results, which are the most reliable due to the particularly high abundance accuracy.
Finally, we should also note that, for all studies in which this element is included (the only exception being A04), Na, which has one of the lowest FIP (5.139 eV) but not a particularly high (958 K), fits very well the abundance vs. trend but reveals itself as an outlier of the abundance vs. FIP correlation. A similar behavior is exhibited by K but, as noted in Sect 3, its abundance is not as reliable.
5 Future directions
The literature data for solar analogs analyzed in this paper support the observational findings of M09 and R09. The uncertainties in the abundances of individual stars are significantly larger than those by M09 and R09 and it is therefore not possible to establish with confidence which fraction of stars have abundances extremely close to solar (except for N09 for which we find a value of 10 to 20 %). According to our interpretation, stars with no deficiency of refractories relative to volatiles (or overabundance of volatiles) relative to the Sun should also host terrestrial planets. M09 and R09 were able to determine a frequency of about 15 % for these objects.
5.1 Metallicity effects
From studies of extrasolar giant gas planets, it has been well established that the frequency of planet-hosts is roughly proportional to (e.g., Marcy et al. 2005). If we assume that the relative frequency of planet hosts is independent of whether the planets are gas giants or terrestrial planets, the fraction of terrestrial planets at should be about 6 % while that at it should be about 40 % based on the above-mentioned 15 % frequency at . For a sample of about 20 stars, this means that at the number of stars which would closely resemble the Sun in their chemical composition is 1. At the corresponding number is 3, as in R09. In both cases such a low number makes these objects an obvious minority and therefore the solar abundance anomaly manifests itself clearly. Following this line of reasoning, at the number of stars without trends in the abundances should be about 8, a number that is comparable to that of those stars which show the trend (12). If the hypothesis of planet formation signature is correct and the observed frequency of gas giant planet hosts as a function of applies also to the planets responsible for the abundance signature we have uncovered, the trend with (average) abundance ratios should progressively disappear at higher . The signature in this case has been washed out by taking the average of a similar fraction of stars which show and do not show the trend. If sufficient precision is achieved, it may be possible to distinguish between metal-rich stars that show and do not show the planet signature from a bimodal distribution of slopes for refractory elements.

Interestingly, the behavior of the average abundance trend of solar analogs with as a function of described above is in good agreement with the N09 data (Fig. 7). We perform this test on this sample only because it shows the most clear and a very significant trend for refractory elements. Fig. 7 shows that the solar abundance anomaly is observed both at and . This is expected according to our interpretation because the fraction of stars with abundances extremely similar to solar (and therefore potential terrestrial planet hosts) is very small in both cases. At the fraction of terrestrial planet hosts is comparable to that of stars which do not host those planets and therefore the signature is no longer evident. We also expect the scatter to be larger in the metal-rich case because of the even mixture of stars that have different chemical compositions. Indeed, the weighted 1- scatter of the average abundance ratios relative to the linear fits shown in Fig. 7 increases from about 0.012 dex at to 0.024 dex at . We note, however, that the corresponding scatter at is larger (0.033 dex) than that of the two more metal-rich samples.
In addition to the result described above, R09 found that the fraction of stars showing the planet signature in the abundances increases with while a hint of a bimodal distribution for the slopes of refractory elements was also observed (their Fig. 4). Although encouraging, these results rely on the precision of abundance ratios relative to solar for stars which are significantly more metal-rich (or more metal-poor in the N09 case) than the Sun and therefore small systematic errors and/or chemical evolution may affect the abundance determinations. It is crucial that we repeat the exercise of looking for abundance trends with condensation temperature but using large samples () of metal-rich (or metal-poor) twin stars and analyzing them with respect to a well known metal-rich (or metal-poor) reference star.
5.2 Effective temperature effects
Our proposed planet signature in the abundances results from the accretion and subsequent mixing of chemically fractionated material into the stellar convective zone. Thus, the magnitude of the effect depends on the size of the convective envelope at the time of protoplanetary disk accretion. A massive envelope would dilute any chemical peculiarities of the accreted material. It is well established that the mass of the convective envelope reduces with effective temperature. In F-dwarfs at K, the total mass of the convective envelope is , a figure that is significantly smaller than that corresponding to the Sun (about ; Pinsonneault et al. 2001). This implies that the chemical signature, if due to the accretion from a protoplanetary disk of similar mass as the one that gave origin to our solar system, should be enhanced by a factor of in mass, everything else being equal. This corresponds, on the logarithmic abundance ratio scale, to a maximum difference in refractory and volatile elements of 0.30 dex instead of 0.08 dex for the solar case. The samples studied in this paper do not exhibit such behavior. Note, however, that the analysis of these warmer stars is much more affected by systematic errors such as those due to departures from the local-thermodynamic equilibrium assumption as well as surface inhomogeneities (e.g., Asplund 2005). Also, their relatively large projected rotational velocities and macroturbulent velocities make the identification of line blends more difficult and consequently the line profile fitting or equivalent width measurement less accurate. As with the metal-rich example described above, it is crucial that we analyze very high quality spectra of a large sample () of twin F-dwarfs with respect to a well-known object of that class in order to search for the abundance patterns found for solar twins stars, if indeed they are there.
5.3 Recent developments
During the review process of this paper, the two suggestions described above regarding the impact of metallicity and effective temperature on the abundance vs. trends have been tested by G10 but using a different approach, that of weighting the results according to the distance between stars in the stellar parameter space. The method that we use is more direct although it remains to be proven whether it is more reliable. The size of the samples that we propose to analyze (about 50 stars in each case) should allow us to make quantitative tests of the planet signature hypothesis.
Also during the review process of this paper, Gonzalez Hernandez et al. (2010) published a search for our proposed planet signatures in the abundances that they derived for a sample of solar analogs. Most of their sample stars and data employed are included in N09. They find good agreement between their abundance vs. trends for solar twins and the results by M09. They claim, however, that their abundance trends for metal-rich solar analogs are incompatible with those by R09. In particular, they discuss their results for two stars known to host super-Earth like planets (HD 160691 and HD 1461). They find positive [X/Fe] vs. slopes for these two stars, which in our interpretation would suggest the absence of rocky planets. In order to understand the apparent discrepancy with R09, in Fig. 8 we show and examine the [X/Fe] vs. trend obtained by Gonzalez Hernandez et al. for one of these two super-Earth planet hosts (HD 160691). The situation for HD 1461 is very similar, as is that for the majority of the other super-solar metallicity stars discussed in that paper.
The slopes they use to examine our planet formation interpretation include both refractory and volatile elements. The two stars in question are both metal-rich. One must be careful when interpreting these abundance results beyond the realm of solar twins. Chemical evolution is likely affecting the abundances of the volatile elements C and O much more than the majority of refractories at these high metallicities. The other two volatile elements in their work are S and Zn, both of which can be very sensitive to errors in stellar parameters. In R09 we excluded these elements from the discussion of slopes because the trend for refractories is more robust. Note also that, as we have pointed out before as being one of the most important characteristics of the [X/Fe] vs. relation, the overall trend is not linear but rather shows a break at K.

Fig. 8 shows that the slope for HD 160691 is positive if one includes all elements (dashed line).555The value that we derive for this slope is dex K-1, which is slightly different from that given by Gonzalez Hernandez et al. (2010) because they mistakenly considered Sr a volatile element, placing it at K rather than at K, as provided by Lodders (2003). Note that this is also true for all the slopes presented in that paper. As stated above, however, the abundances of volatiles are not as reliable as the trend for refractories, which is the reason why R09 interpretation is based on slopes for K elements only. Interestingly, a linear fit to the refractory elements only ( K) reveals a negative slope of dex K-1 for HD 160691 (solid line in Fig. 8) and also a negative slope of dex K-1 for HD 1461 instead of the positive slopes obtained by Gonzalez Hernandez et al.
In Fig. 9 we show the distribution of K slopes for both the R09 and Gonzalez Hernandez et al. (2010) samples (we derived the slopes for the latter using the same procedure used in R09 and the abundance data provided in their paper). There is good agreement in the distribution of K slopes of these two studies even though the Gonzalez Hernandez et al. sample extends to higher metallicities. Moreover, the two super-Earth planet hosts, shown with the star symbols in Fig. 9 fall in the midst of the distribution of slopes for metal-rich stars.

The hint of a bimodal distribution of K slopes at high metallicity speculated by R09 is not confirmed by the Gonzalez Hernandez et al. (2010) data. Instead, beyond , almost all stars show near zero or negative slope. Within the planet formation signature in the abundances scenario, this suggests that all stars with metallicities higher than are terrestrial planet hosts. In particular, the two super-Earth planet hosts HD 160691 and HD 1461 both reveal the signature of terrestrial planets in their abundance pattern. We thus conclude that, when examined properly, the abundance vs. trends of these two super-Earth planet hosts are fully consistent with R09 results and interpretation.
6 Summary
We have compiled abundance data for six independent spectroscopic surveys (Reddy et al. 2003; Allende Prieto et al. 2004; Takeda 2007; Neves et al. 2009; Gonzalez et al. 2010; and Bensby et al., in preparation) and computed mean abundance ratios [X/Fe] for solar twins and analogs in each of them. With the exception of one study, we find that [X/Fe] correlates with the condensation temperature of the elements in a manner similar to that found by M09 and R09. We show that it is very likely that the one study (Reddy et al. 2003) that disagrees with the M09 and R09 results suffers from systematic errors that affect mostly the abundances of volatile elements, which are the only discrepant ones. Quantitatively, the agreement between the trends derived by us in our previous work and those from the literature is good for two of the six studies analyzed, while it is still consistent for the other four.
When the abundances from the six studies used in this paper are combined without attempting to homogenize the abundance results in any way, the agreement with M09 and R09 is also good. We argue that the heterogeneous nature of this compilation makes the finding of a good agreement even more robust. All six studies are completely independent and employ largely different spectra, model atmospheres, spectrum synthesis codes, linelists, etc.
We have investigated whether the abundance trends that we find with condensation temperature are due to an underlying correlation with the first ionization potential of the elements. Statistical tests show that condensation temperature is the driving parameter in these correlations.
The abundance trends with condensation temperature found for solar twins by M09 and R09 and shown to be consistent with our survey of literature data are speculated to be due to the formation of terrestrial planets in the Sun and a minority of solar twins. We provide suggestions to test specific predictions of this hypothesis.
Acknowledgements.
J. M. would like to acknowledge support from Fundação para a Ciência e a Tecnologia (FCT, Portugal) in the form of a grant (PTDC/CTE-AST/098528/2008) and a Ciência 2007 fellowship. We thank G. Gonzalez for sending us the abundance data from the G10 paper before publication.References
- Alexander et al. (2001) Alexander, C. M. O., Boss, A. P., & Carlson, R. W. 2001, Science, 293, 64
- Allende Prieto et al. (2004) Allende Prieto, C., Barklem, P. S., Lambert, D. L., & Cunha, K. 2004, A&A, 420, 183
- Alonso et al. (1996) Alonso, A., Arribas, S., & Martinez-Roger, C. 1996, A&A, 313, 873
- Anders & Grevesse (1989) Anders, E. & Grevesse, N. 1989, Geochim. Cosmochim. Acta., 53, 197
- Asplund (2005) Asplund, M. 2005, ARA&A, 43, 481
- Baraffe & Chabrier (2010) Baraffe, I. & Chabrier, G. 2010, A&A, submitted
- Baraffe et al. (2009) Baraffe, I., Chabrier, G., & Gallardo, J. 2009, ApJ, 702, L27
- Basri et al. (2005) Basri, G., Borucki, W. J., & Koch, D. 2005, New Astronomy Review, 49, 478
- Baumann et al. (2010) Baumann, P., Ramírez, I., Meléndez, J., Asplund, M., & Lind, K. 2010, A&A, in press
- Bensby & Feltzing (2010) Bensby, T. & Feltzing, S. 2010, in IAU Symposium, Vol. 265, IAU Symposium, ed. K. Cunha, M. Spite, & B. Barbuy, 300–303
- Bensby et al. (2003) Bensby, T., Feltzing, S., & Lundström, I. 2003, A&A, 410, 527
- Bensby et al. (2005) Bensby, T., Feltzing, S., Lundström, I., & Ilyin, I. 2005, A&A, 433, 185
- Bensby et al. (2011) Bensby, T., Feltzing, S., & Oey, M. S. 2011, in preparation
- Bensby et al. (2007a) Bensby, T., Oey, M. S., Feltzing, S., & Gustafsson, B. 2007a, ApJ, 655, L89
- Bensby et al. (2007b) Bensby, T., Zenn, A. R., Oey, M. S., & Feltzing, S. 2007b, ApJ, 663, L13
- Casagrande et al. (2010) Casagrande, L., Ramírez, I., Meléndez, J., Bessell, M., & Asplund, M. 2010, A&A, 512, 54
- Chen & Zhao (2006) Chen, Y. Q. & Zhao, G. 2006, AJ, 131, 1816
- Ciesla (2008) Ciesla, F. J. 2008, Meteoritics and Planetary Science, 43, 639
- Clegg et al. (1981) Clegg, R. E. S., Tomkin, J., & Lambert, D. L. 1981, ApJ, 250, 262
- D’Antona & Mazzitelli (1994) D’Antona, F. & Mazzitelli, I. 1994, ApJS, 90, 467
- Ecuvillon et al. (2006) Ecuvillon, A., Israelian, G., Santos, N. C., Mayor, M., & Gilli, G. 2006, A&A, 449, 809
- Edvardsson et al. (1993) Edvardsson, B., Andersen, J., Gustafsson, B., et al. 1993, A&A, 275, 101
- Fabbian et al. (2009) Fabbian, D., Asplund, M., Barklem, P. S., Carlsson, M., & Kiselman, D. 2009, A&A, 500, 1221
- Fedele et al. (2010) Fedele, D., van den Ancker, M. E., Henning, T., Jayawardhana, R., & Oliveira, J. M. 2010, A&A, 510, 72
- Feldman (1992) Feldman, U. 1992, Phys. Scr, 46, 202
- Feltzing & Bensby (2008) Feltzing, S. & Bensby, T. 2008, Physica Scripta Volume T, 133, 014031
- Fischer & Valenti (2005) Fischer, D. A. & Valenti, J. 2005, ApJ, 622, 1102
- Gonzalez (1997) Gonzalez, G. 1997, MNRAS, 285, 403
- Gonzalez (1998) Gonzalez, G. 1998, A&A, 334, 221
- Gonzalez (2008) Gonzalez, G. 2008, MNRAS, 386, 928
- Gonzalez et al. (2010) Gonzalez, G., Carlson, M., & Tobin, R. W. 2010, MNRAS, in press
- Gonzalez et al. (2001) Gonzalez, G., Laws, C., Tyagi, S., & Reddy, B. E. 2001, AJ, 121, 432
- Gonzalez Hernandez et al. (2010) Gonzalez Hernandez, J. I., Israelian, G., Santos, N. C., et al. 2010, ApJ, in press
- Gustafsson et al. (2010) Gustafsson, B., Meléndez, J., Asplund, M., & Yong, D. 2010, Ap&SS, 328, 185
- Heiter & Luck (2003) Heiter, U. & Luck, R. E. 2003, AJ, 126, 2015
- Hekker & Meléndez (2007) Hekker, S. & Meléndez, J. 2007, A&A, 475, 1003
- Hénoux (1998) Hénoux, J. 1998, Space Science Reviews, 85, 215
- Israelian et al. (2009) Israelian, G., Delgado Mena, E., Santos, N. C., et al. 2009, Nature, 462, 189
- Lodders (2003) Lodders, K. 2003, ApJ, 591, 1220
- Luck & Heiter (2006) Luck, R. E. & Heiter, U. 2006, AJ, 131, 3069
- Mamajek (2009) Mamajek, E. E. 2009, in American Institute of Physics Conference Series, Vol. 1158, American Institute of Physics Conference Series, ed. T. Usuda, M. Tamura, & M. Ishii, 3–10
- Marcy et al. (2005) Marcy, G., Butler, R. P., Fischer, D., et al. 2005, Progress of Theoretical Physics Supplement, 158, 24
- Meléndez et al. (2009) Meléndez, J., Asplund, M., Gustafsson, B., & Yong, D. 2009, ApJ, 704, L66
- Meléndez et al. (2010) Meléndez, J., Ramírez, I., Casagrande, L., et al. 2010, Ap&SS, 328, 193
- Meyer (2009) Meyer, M. R. 2009, in IAU Symposium, Vol. 258, IAU Symposium, ed. E. E. Mamajek, D. R. Soderblom, & R. F. G. Wyse, 111–122
- Neves et al. (2009) Neves, V., Santos, N. C., Sousa, S. G., Correia, A. C. M., & Israelian, G. 2009, A&A, 497, 563
- Nordlund (2009) Nordlund, Å.. 2009, ApJ, submitted (arXiv:astro-ph/0908.3479)
- Pasquini et al. (2007) Pasquini, L., Döllinger, M. P., Weiss, A., et al. 2007, A&A, 473, 979
- Pinsonneault et al. (2001) Pinsonneault, M. H., DePoy, D. L., & Coffee, M. 2001, ApJ, 556, L59
- Ramírez et al. (2007) Ramírez, I., Allende Prieto, C., & Lambert, D. L. 2007, A&A, 465, 271
- Ramírez et al. (2009) Ramírez, I., Meléndez, J., & Asplund, M. 2009, A&A, 508, L17
- Reddy et al. (2006) Reddy, B. E., Lambert, D. L., & Allende Prieto, C. 2006, MNRAS, 367, 1329
- Reddy et al. (2003) Reddy, B. E., Tomkin, J., Lambert, D. L., & Allende Prieto, C. 2003, MNRAS, 340, 304
- Ryan (2000) Ryan, S. G. 2000, MNRAS, 316, L35
- Sadakane et al. (2002) Sadakane, K., Ohkubo, M., Takeda, Y., et al. 2002, PASJ, 54, 911
- Santos et al. (2004) Santos, N. C., Israelian, G., & Mayor, M. 2004, A&A, 415, 1153
- Sousa et al. (2008) Sousa, S. G., Santos, N. C., Mayor, M., et al. 2008, A&A, 487, 373
- Takeda (2007) Takeda, Y. 2007, PASJ, 59, 335
- Takeda et al. (2008) Takeda, Y., Sato, B., & Murata, D. 2008, PASJ, 60, 781
- Udry & Santos (2007) Udry, S. & Santos, N. C. 2007, ARA&A, 45, 397
- Wuchterl & Tscharnuter (2003) Wuchterl, G. & Tscharnuter, W. M. 2003, A&A, 398, 1081