Optical vs. infrared studies of dusty galaxies and AGN: (I) Nebular emission lines
Abstract
Optical nebular emission lines are commonly used to estimate the star formation rate of galaxies and the black hole accretion rate of their central active nucleus. The accuracy of the conversion from line strengths to physical properties depends upon the accuracy to which the lines can be corrected for dust attenuation. For studies of single galaxies with normal amounts of dust, most dust corrections result in the same derived properties within the errors. However, for statistical studies of populations of galaxies, or for studies of galaxies with higher dust contents such as might be found in some classes of “transition” galaxies, significant uncertainty arises from the dust attenuation correction. In this paper we compare the strength of the predominantly unobscured mid-IR [Ne ii] +[Ne iii] emission lines to the optical emission lines in four samples of galaxies: (i) ordinary star forming galaxies (80 galaxies), (ii) optically selected dusty galaxies (11), (iii) ULIRGs (6), (iv) Seyfert 2 galaxies (20). We show that a single dust attenuation curve applied to all samples can correct the luminosity for dust attenuation to a factor better than 2. Similarly, we compare [OIV] and [OIII] luminosities to find that [OIII] can be corrected to a factor better than 3. This shows that the total dust attenuation suffered by the AGN narrow line region is not significantly different to that suffered by the starforming H ii regions in the galaxy. We provide explicit dust attenuation corrections, together with errors, for [OII], [OIII] and . The best-fit average attenuation curve is slightly greyer than the Milky-Way extinction law, indicating either that external galaxies have slightly different typical dust properties to the Milky Way, or that there is a significant contribution from scattering. Finally, we uncover an intriguing correlation between Silicate absorption and Balmer decrement, two measures of dust in galaxies which probe entirely different regimes in optical depth.
keywords:
Type keywords here.1 Introduction
In the last few decades large optical spectroscopic surveys have dramatically improved our knowledge of the global distribution of galaxy physical properties such as stellar mass, star formation rates, star formation histories, and both gas phase and stellar metallicities. Furthermore, at low to intermediate redshifts, the sheer statistics of current optical spectroscopic surveys allow us to identify and study significant numbers of rare objects which represent transient phases in the lifetime of galaxies: starburst, post-starburst and “green-valley” galaxies, major mergers, and powerful active galactic nuclei (AGN). These transient phases, although rare, are globally important. For example, black hole growth occurs primarily in rare, high accretion rate events (??), and it is still debated whether the infrequent gas-rich galaxy major mergers are responsible for the morphological transformation of galaxies and the build-up of the red sequence (???). In the near future, the James Webb Space Telescope (JWST) will allow rest-frame optical spectroscopic observations at high-redshift, where galaxies are more active in both star formation and black hole growth.
There is an obvious benefit in using the information provided in the redshift survey to study the properties of the galaxies in detail. For example, when star formation is the dominant mechanism of excitation, is a very simple and reliable measure of star formation rate in galaxies. However, it must be accurately corrected for dust attenuation. In ordinary galaxies, the tight relations between dust-corrected and other indicators of star formation rate from other wavelength regimes provide circumstantial evidence that dust attenuation in the optical can be corrected for accurately. ?) suggests that errors on SFRs caused by the assumed dust curve (attenuation as a function of wavelength) can be 10-20% for typical star-forming galaxies in the local Universe. However, knowing the “correct” dust curve is crucial. ?) find that the use of different dust curves in spectral-energy-distribution (SED) fitting of high redshift K-selected galaxies can alter parameters such as star formation rates and star formation timescales by factors of 2-3. The large errors reported in this study result from the fact that the “correct” dust-curve to use at high redshift is largely unconstrained and there is a large range in the steepness of dust-curves observed along lines-of-sight to stars in the Magellanic clouds and Milky Way.
With the complex physical processes that occur during transient phases in the life-cycle of a galaxy, it is uncertain how far rest-frame optical studies alone can help us in understanding their true impact. As dust content increases, and galaxy geometries become more complicated, corrections for dust attenuation become more uncertain. How much physical information can we really infer from optical data alone when faced with extreme star formation, dust production, AGN activity and complicated spatial geometries of disturbed galaxies?
In this paper, we compare emission line fluxes in the optical to those in the mid infra-red where dust attenuation is negligible, except in small and well known wavelength bands. To test the recovery of luminosity from optical data in the presence of significant dust, we compare and contrast a low-z “representative” sample of galaxies with (i) dusty galaxies selected from the Sloan Digital Sky Survey (SDSS) based on their Balmer emission line ratios and strong Balmer absorption lines indicating a possible recent decrease in star formation; (ii) local Ultra-luminous Infrared Galaxies (ULIRGs) selected from the Infrared Astronomy Satellite (IRAS) Bright Galaxy Sample (BGS) based on their total IR luminosities (L). The control sample of galaxies arise from the Spitzer-SDSS-GALEX Spectroscopic Survey (SSGSS) and were chosen to be “representative” of the ordinary galaxies within the SDSS and GALEX surveys. For the AGN in these samples, we further compare the [OIII]/[OIV] line ratio to a sample of Seyfert 2 galaxies, to test the recovery of black hole accretion rates from optical [OIII] emission line. In a companion paper we will address the effect of dust on the optical continuum, and thus estimations of star formation histories, and compare the star formation rates derived from the multi-wavelength continuum with those from luminosity.
Understanding our selected “unusual” galaxies is crucial for understanding galaxy evolution. The Balmer-strong galaxies show optical emission lines indicating obscured AGN, and the correction of their [OIII] emission for dust attenuation using different dust-curves results in them contributing between an insignificant 1% and a much more significant 10% to the total [OIII] luminosity (or black hole accretion rate) of all narrow-line AGN in the SDSS. This has important implications for the starburst-AGN connection, for example, as the strong Balmer absorption lines suggest this accretion is happening after the starburst has decayed (?). Low-z ULIRGs are usually associated with major gas-rich mergers (?). Some models of galaxy evolution have used gas-rich major mergers as the driving force to change the observational properties of the galaxy population over cosmic time. The mergers lead to powerful starbursts and QSO driven outflows, resulting in the population of red, quiescent ellipticals seen in the local universe (e.g. ??). ULIRGs become increasingly common at earlier epochs, and dominate the star formation rate density beyond a (?). Understanding the basic properties of ULIRGs at low-redshift, and the limitations of the optical wavelength regime for identifying and understanding the properties of their power sources, is crucial in an era when near-infrared (NIR) ground-based spectrographs and the JWST will soon allow us to study galaxies with rest-frame optical spectra at increasingly early epochs.
The outline of this paper is as follows. After briefly reviewing the topic of dust extinction and attenuation in Section 2, we present the spectral analysis methods and four samples in detail in Section 3. In Section 4 we compare the data with a variety of different dust curves commonly used in the literature. We conclude in Section 5 by discussing the implications of our work for measuring star formation rates, black hole accretion rates, and identifying AGN in optical spectroscopic surveys. Finally, we provide relations for correcting the [OII], [OIII] and emission lines using a measured / flux ratio (Balmer decrement), assuming a single dust curve which provides a good fit to all of the samples studied in this paper.
Throughout the paper we quote line luminosities in erg/s and masses in solar masses. Optical parameters for all samples have been extracted from the SDSS-DR7, and may differ from those in earlier releases due to updates in the SDSS reduction pipeline. All optical wavelengths are quoted as measured in a vacuum, in keeping with SDSS convention, optical wavelengths are given in Å and mid-IR wavelengths in .
2 Review of dust attenuation laws
Dust grains in galaxies which intercept and scatter stellar and nuclear light complicate the analysis of integrated galaxy spectra. Optical light reaching the observer is effected by dust in three different ways: (i) absorption; (ii) scattering out of the line-of-sight; (iii) scattering into the line-of-sight. The first two combined are usually termed “extinction” and all three combined are termed “attenuation”. The final “effective attenuation” observed in the integrated light of galaxies results from the integration of attenuated light over all lines-of-sight to light sources throughout the entire galaxy111Throughout this paper we use the term “effective attenuation” to encompass all effects relating to the dust i.e. absorption and scattering, and geometrical effects. We note that this differs from some other papers which apply the term to “single-line-of-sight” attenuation.. In this section, we introduce the basics of the effects of dust on studying the integrated light from galaxies. ?) gives an extensive recent review of the literature, although note that the terminology differs in places from that adopted here.
The effective attenuation , in magnitudes, at a given wavelength is given by:
| (1) | |||||
| (2) |
where is the observed luminosity, is the intrinsic luminosity of the source, and is the effective optical depth of the dust.
Observationally we measure the dimming and reddening of light from sources, thus deriving an effective attenuation or extinction curve :
| (3) | |||||
| (4) |
where the colour excess is defined by and is the total-to-selective extinction in the band. In the case of extinction, RV is a function of the grain composition, size and shape. In the case of effective attenuation observed in galaxies it is additionally a function of the local geometry of the dust and light sources and global geometry of the galaxy (bulge and disk, and inclination). In this work we will use the term “dust curve” to mean either “effective attenuation” or “extinction” curve, depending on the particular curve under discussion.
The effective attenuation suffered by the ultra-violet (UV) to optical stellar continua of starburst galaxies, where the unattenuated stellar continuum is relatively well understood, has been measured empirically from the ratio of heavily attenuated to less attenuated spectra (??). The dust-curve is found to be “greyer” (i.e. flatter) than extinction curves measured along single lines-of-sight towards stars in the Milky Way222Commonly used MW extinction curves include ?),?) and ?), as expected from geometrical effects. Similarly, ?, hereafter CF00) fit the ratio of far infra-red (FIR) to UV luminosities and UV slope in starburst galaxies to find an effective attenuation curve that is well fit by the shallow powerlaw .
Dust curves derived from stellar continua are not necessarily suitable for the correction of nebular emission lines, however. In starburst galaxies, nebular emission lines are found to be more attenuated than the stellar continua (e.g. ?), indicating that the light passes through a greater quantity, and possibly different distribution or composition, of dust. Any difference in the distribution or composition of dust will result in a different shape for the dust attenuation curve and therefore errors in the correction of nebular emission lines using a dust-curve derived from the stellar continua. The stronger attenuation of nebular emission lines compared to the stellar continuum, can be successfully reproduced by models in which dust is distributed primarily in 2 components: diffuse interstellar dust, and stellar birthclouds which disperse after a finite time ( years) (??, CF00). This allows the emission lines, which are ionised by the hottest stars still enveloped in their dense birthclouds, to experience greater attenuation than the UV stellar continua, which has an additional contribution from cooler stars around which the birthclouds have already dispersed.
In Wild et al. (2007) we presented explicitly the form of the dust-curve for the correction of nebular emission lines in the CF00 dust model:
| (5) |
We reiterate that we use to refer to the final “effective attenuation” suffered by light, including geometrical effects, and that this model is strictly an “angle averaged” model, averaging over all sight-lines through a galaxy. The first term describes the slope of the screen-like extinction suffered as the light leaves the stellar birth-clouds and the exponent is set to match the extinction observed along lines-of-sight in the MW (). The second term describes the additional, much greyer attenuation caused by the intervening diffuse ISM, where CF00 derive a best-fit exponent of . The fraction of the total effective optical depth at 5500Å caused by dust in the diffuse ISM is controlled by the parameter . CF00 showed that the typical value for in their starburst dataset was about 0.3. The resulting model attenuation curve, labelled throughout the paper, naturally lies between the pure continuum attenuation (equivalent to ), and pure screen-like attenuation (equivalent to ).
Recently, ?) applied and extended the two component CF00 dust model to a sample of local galaxies with multi-wavelength photometry and optical and emission line measurements, finding an excellent match to the data.
We note that an additional complication arises in the case of nebular emission from the narrow line region (NLR) of an AGN, where a different dust geometry could lead to a different effective attenuation curve than that found for nebular emission from H ii regions. Additionally, for galaxies with contributions to nebular emission from both star formation and an AGN NLR, the use of the Balmer decrement for the correction of NLR emission lines may be somewhat inappropriate. In general it is reasonably assumed that the Hydrogen recombination lines are dominated by the emission from H ii regions in all but the strongest AGN. However, this is not the case for higher ionization and higher excitation lines where emission from the NLR can dominate. Thus, while the Balmer decrement will show how much dust is in H ii regions, there is no reason to believe that light from the NLR would pass through the same amount of dust333The difference in the intrinsic Balmer decrements between NLR and H ii regions (due to different gas temperatures), will be small relative to the difference caused by attenuation.. Therefore the extinction correction applied to these other lines, such as [[OIII]]Å, may be incorrect. We investigate these effects in Section 4.4.
2.1 Attenuation of nebular emission lines
In order to determine the amount of attenuation suffered by optical nebular emission lines, ideally one would observe a pair of lines whose intrinsic ratio is independent of physical conditions and where one of the pair lies at a wavelength long enough that attenuation is negligible (see also discussion in ?). Hydrogen recombination line ratios that include one line in the NIR wavelength range have been shown to be a powerful tool for constraining the dust attenuation curves for nebular emission lines in galaxies (??). The data are well fit by a screen-like MW extinction curve, which has since been favoured for the correction of emission lines for dust attenuation. These results suggest that a substantial fraction of the attenuation of emission lines must arise from dust in a foreground screen-like geometry (e.g. the birthclouds in the CF00 model). However, the samples studied to date have been small, containing only local starburst galaxies. Extending this study to a larger sample of galaxies, including more ordinary starforming galaxies and dustier galaxies is the purpose of this paper.
Sample sizes using ground based NIR observations are restricted primarily by the difficulty resulting from contamination of observations by OH sky lines. Hubble Space Telescope observations of NIR Paschen- line have been used to reveal the detailed distribution of star formation in galaxies relatively unimpeded by dust (?). The detection of dust lanes in some galaxies in this sample indicate some level of extinction still exists even at 1.875. Uncertainties in the form of dust-curve in the NIR regime therefore cause a small additional source of uncertainty when using NIR emission lines to constrain dust-curves in the optical.
With the launch of the Spitzer Space Telescope, with the Infrared Spectrograph (IRS, ?) on board, high quality, moderate resolution mid-IR spectra are available for the first time for a large number of low- galaxies. Extinction in the mid-IR is negligible, except in small wavelength regions centered on 9.7 and 18 where strong absorption can arise from the stretching and bending modes of amorphous silicate grains. While H recombination lines are found in the Mid-IR, they unfortunately tend to be too weak to be easily measured. Two of the strongest and easily observable emission lines in the mid-IR arise from neon; [Ne ii] 12.8 and [Ne iii] 15.5. In typical H ii regions, over 95% of neon is in these two states (Ne+ and Ne2+), thus we expect that the sum of these two lines will trace very well the ionized gas, and thus , in galaxies. Indeed, ?) have already suggested that these mid-IR Neon lines could provide a useful new indicator of star formation rate in galaxies. They have shown that [Ne ii]+[Ne iii] luminosity correlates strongly with both total infrared luminosity in galaxies and the NIR Br emission line in giant H ii regions. ?) have shown that [Ne ii] luminosity correlates strongly with that of Pa in star-forming regions in LIRGS. Neon has the added benefit of being an abundant element, especially as it is not depleted onto dust grains. Therefore in this work we use the sum of these two lines as a tracer of the unextinguished emission from ionized gas in these galaxies. Although these lines lie on the edge of the silicate absorption features, in general the extinction caused by this is minimal as we verify in Section 3. Combining Spitzer spectra with optical SDSS spectra provides a new and extremely powerful dataset, in which both optical and mid-IR emission lines have been measured much more accurately than was possible in the past.
Starburst/H ii region modelling (??) suggests that for typical twice Solar metallicity H ii regions, the ratio L([Ne ii]+[Ne iii])/L() should be between 0.5-1.0, demonstrating how luminous the mid-IR Ne lines are. The range is caused by ionization effects, arising from different stellar models, the mean age of the ionizing stellar population, and ionizing flux densities. There is one major disadvantage of using the [Ne]-to- ratio to constrain the optical dust-curve in galaxies, in that the intrinsic ratio is directly dependent upon the metallicity of the gas, greatly expanding the range of possible values. For Solar metallicity H ii regions the models predict L([Ne ii]+[Ne iii])/L() should be smaller by a factor of 0.6. However, we expect that this is not a dominant concern in the samples studied in this paper as we are exploring massive, dusty, and therefore metal-rich, galaxies. We discuss the impact of variations in the intrinsic ratio where relevant. We refer the reader to ?) for further details on the formation of the neon lines in H ii regions.
In AGN the ionizing spectrum is much harder than found in star-forming regions, meaning that neon starts to populate higher ionization states. The sum of the mid-IR neon lines still traces the ionized gas very well, but the ionisation is offset to higher values due to the harder radiation field. In addition, the harder radiation field of AGN also create partially (or X-ray) ionized regions, which have a higher L([[Ne ii]])/L() ratio. AGN photoionization models suggest L([Ne ii]+[Ne iii])/L() , a factor of 2-4 higher than H ii regions (?)444These line ratio predictions can be obtained using the publicly available ITERA software package (?). Again, we will indicate the effect of this result where relevant.
3 The Samples
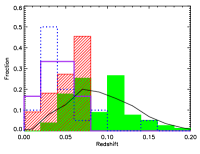
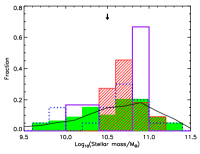
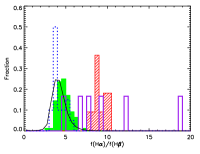
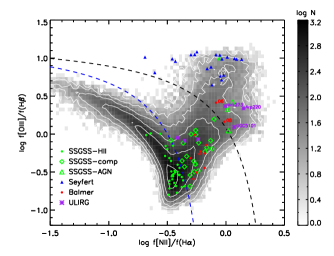
In this section we give the methodology used to measure the nebular emission lines, followed by the selection criteria of our four samples of galaxies. All samples have SDSS optical 5-band imaging and fibre spectroscopy, together with Spitzer IRS spectroscopy. The SDSS specobjid, SDSS-MPA rowindex, RA and Dec of the Balmer-strong, ULIRG and Seyfert samples are given in Tables 1, 2 and 3 to allow easy identification of the objects in the catalogues used in this paper. The equivalent information for the SSGSS sample is available online at http://www.astro.columbia.edu/ssgss. For a quick visualisation of the samples: Figure 1 presents their distributions in redshift, stellar mass and Balmer decrement (/ flux ratio), Figure 2 shows their positions on the BPT diagram ([NII]/ vs. [OIII]/ emission line flux ratios ?), and in Figure 3 we place all our samples on the ?) diagram of PAH6.2 equivalent width vs. the strength of the 9.7 silicate absorption. We discuss these figures further in Section 3.5.
The raw optical emission-line measurements for all SDSS-DR7 galaxies are provided on the SDSS-MPA web pages555http://www.mpa-garching.mpg.de/SDSS/DR7/ and details are given in ?) and ?); errors have been rescaled according to the information provided on the web site. Note that all broad emission line objects have been identified by the SDSS automated pipeline and are not included within the SDSS-MPA sample. Briefly, spectral synthesis models [Bruzual & Charlot (2003); 2008 version using the MILES spectral library, Sánchez-Blázquez et al. (2006)] are used to fit the stellar continuum, including stellar absorption features, and emission lines are measured from the residual of the data and model fit. Therefore underlying stellar absorption is accurately accounted for when measuring optical emission line fluxes. Intervening Galactic extinction is corrected for prior to the calculation of the emission line fluxes. The quality of the fits obtained is excellent.
For all samples, IRS spectroscopy was carried out in staring mode and 1D spectra were extracted using the standard Spitzer IRS Custom Extraction (SPICE). For the Balmer-strong galaxies the “optimal extraction” option was chosen (?), which weights the extraction by the object profile and the signal-to-noise of each pixel and is suitable for faint sources. Individual 1D spectra were combined using custom algorithms.
To maximise consistency between the heterogeneous samples in this paper, the final low-resolution 1D spectra of all samples were reanalysed using the same custom algorithms and analysis packages where appropriate. To obtain [Ne ii] and [Ne iii] fluxes for the SSGSS and Seyfert samples we used the mid-IR spectral fitting package PAHfit (v1.2 ?) which fits Gaussian profiles with widths set according to the instrument module. PAHfit was run in the rest-frame using a screen-like dust model, and although dust attenuation is tiny at the wavelengths of the Ne lines, for complete consistency between samples we removed the correction applied by the code (Eqn. 4, ?). Our final results are unchanged whether the minimal dust correction is applied or not. Where high resolution spectroscopy is available, we use the high-resolution measurements of [Ne ii] and [Ne iii] due to the smaller error bars. For the Balmer-strong sample, the [Ne ii] and [Ne iii] emission line fluxes were measured interactively from the short-high (SH) IRS spectra using the 2-step baseline and Gaussian line-fit module from the SMART IDEA package (?)666http://isc.astro.cornell.edu/SmartDoc/LineFitting. For the ULIRG sample, fluxes were taken from high resolution spectroscopy, given in Table 4 of ?). To ensure consistency between the four samples, where possible777 We found that PAHfit does not fit the continuum well for ULIRGs with strong Silicate absorption, and therefore the emission line measurements were unreliable in these cases. we verified that [Ne ii] and [Ne iii] fluxes measured with PAHfit or directly from the low-resolution spectra for the Balmer-strong and ULIRG samples were equal within the errors to those measured from the high-resolution spectra (with and without the minimal correction for attenuation applied in PAHfit). For the Seyfert sample, [Ne ii] fluxes were found to match within the errors those measured in the high-resolution mode, given in Table 6 of ?).
[OIV] was measured from high-resolution (LH) IRS spectroscopy in all cases (measurement from the low-resolution spectra is not possible due to a nearby FeII line). For the Balmer-strong sample, [OIV] line fluxes were measured interactively using the SMART IDEA package as described above. For the ULIRG and Seyfert samples [OIV] line fluxes were taken from the tables in Armus et al. (2007) and ?) respectively.
One of the major components of a star-forming galaxy spectrum in the mid-IR is the broad emission features generally accepted to result from the vibrational modes of polycyclic aromatic hydrocarbons (PAHs). While we do not study the PAH features in detail in this paper, PAHfit outputs their fluxes and equivalent widths which we use to provide further clarification of the nature of our objects where necessary.
To visualise the different dust and AGN properties of our different samples in Section 3.5, we measure the equivalent width of PAH6.2 and the strength of the 9.7 silicate absorption. We attempted in both cases to follow closely the methods as described in ?), and we used the ULIRG sample to verify that our results are consistent with those given in ?) over the full range of the measurements.
3.1 The SSGSS sample
Our control sample is the Spitzer-SDSS-GALEX Spectroscopic Survey (SSGSS, ??), a Spitzer Legacy survey (P.I. D. Schiminovich) which targeted 100 “ordinary” galaxies from the SDSS spectroscopic survey and GALEX surveys for follow-up mid-IR spectroscopy with the Infrared Spectrograph (IRS, ?) using the Spitzer Space Telescope. The galaxies are magnitude limited to the SDSS spectroscopic magnitude limit of and additionally were selected to have GALEX-NUV fluxes Jy for the faint sample (40 galaxies) and Jy for the bright sample (60 galaxies). They were chosen such that their mass, colour, star formation rate and redshift distribution are representative of galaxies in the SDSS survey. A description of the survey, together with data tables containing SDSS and mid-IR measurements and derived parameters, are available at the team website888http://www.astro.columbia.edu/ssgss/. In this paper we make use of the IRS low resolution spectroscopy of 80 SSGSS galaxies. The IRS spectra of the remaining galaxies are either incomplete due to problems during observations or reductions, or suffer from considerable noise at short wavelengths, 5 of these caused by a solar flare. A further 4 galaxies with median per-pixel-SNR in their SDSS spectra are removed, as the spectra were of insufficient SNR to allow accurate stellar continuum fitting around the Balmer emission lines. Further details of the SSGSS can be found in ?) and ?).
3.2 The dusty Balmer-strong sample
Our first sample of galaxies with significant dust contents are 12 Balmer-strong galaxies selected from the SDSS-DR4 to have an observed / flux ratios greater than 8 (where a ratio close to 3 indicates little dust) and optical line ratios that indicated the possible presence of an AGN. Additionally, they were selected to have strong Balmer absorption lines, which might indicate a recent sharp decline in star formation rate (“post-starburst”). However, the strong Balmer absorption lines might alternatively be caused by unusual dust properties rather than star formation history(e.g. as postulated in ?). This is the subject of a future paper. Both high- and low-resolution IRS spectra were obtained for all of these 12 galaxies during Spitzer Cycle-4 (P.I. T. Heckman). Further observational details of this sample are provided in Appendix B. One of the 12 galaxies was subsequently discovered to have double peaked narrow and [NII] lines, together with significant underlying broad emission which was not accounted for in the original emission line measurements. Its IRS spectrum is dominated by emission from the AGN. Attempts to robustly remeasure the line accounting for the double peak were unsuccessful due to significant stellar absorption, and its Ne/ and PAH/ ratios suggests that it is not in fact unusually dusty. We therefore remove it from all further discussion, leaving 11 Balmer-strong galaxies.
3.3 The ULIRGS
Our second sample of dusty galaxies is composed of the 10 ULIRGs () from the IRAS Bright Galaxy Sample (?); the Spitzer IRS low- and high-resolution observations of these galaxies have been presented in detail in ?). Of the 10 BGS ULIRGs, 6 are found in the SDSS spectroscopic sample [IRAS15327+2340 (Arp220), IRAS 08572+3915, IRAS 15250+3609,IRAS 09320+6134 (UGC 5101),IRAS 12112+0305], 3 do not lie within the SDSS footprint (IRAS 05189-2524, IRAS 22491-1808, IRAS 14348-1445), and 1 is optically too faint to have been targeted [IRAS 12540+5708 (Mrk 231) has an SDSS -band magnitude of 19.4]. All 6 of the ULIRGs with SDSS spectra are late stage mergers (?).
3.4 The Seyfert sample
In Section 4.4 we compare the high ionisation emission lines in the dusty galaxies with those of a sample of relatively dust-free (low Balmer decrement) Seyfert galaxies. This is composed of the top 20 [OIII] flux emitters out of all SDSS-DR4 main-sample galaxies classified as Seyfert galaxies based on their position on the BPT diagram. They have [OIII] fluxes greater than erg/s/cm2, corresponding to a luminosity of erg/s at the median redshift of the sample. Both high- and low-resolution IRS spectra were obtained, with high signal-to-noise ratio. Further details of the Seyfert sample, along with a study of their X-ray properties can be found in ?) and ?).
3.5 Sample comparison
The samples that we will compare and contrast in this paper were targeted for different purposes and thus any conclusions drawn must take account of potential systematics caused by their different selections.
The redshift distribution of the 4 samples is shown in the left panel of Figure 1. The black line shows the redshift distribution of the SDSS spectroscopic galaxy catalog with -band extinction corrected petrosian magnitude999Petrosian magnitudes and radii are estimates of total magnitudes suitable for all types of galaxies. They are derived by the SDSS photometry pipelines, with details found here: http://www.sdss.org/dr7/algorithms/photometry.html in the range . The Seyfert and ULIRG sample are flux limited in nebular emission and IR flux respectively, and lie predominantly at low redshifts. The SSGSS galaxies were selected to be representative of the full SDSS sample, and therefore their redshift distribution tracks closely that of the full SDSS survey. The Balmer-strong sample is limited to to ensure that the stellar population sampled by the optical fibre through which the spectrum is taken lies within the central region of the galaxy close to the AGN.
The stellar mass distribution of the 4 samples is shown in the central panel of Figure 1. The stellar masses101010Courtesy of Jarle Brinchmann, publicly available at http://www.mpa-garching.mpg.de/SDSS/DR7/ have been estimated from stellar population model fits to the optical 5-band SDSS photometry, using a Bayesian analysis similar to that described in ?) and ?). Most samples cover the full range in stellar mass probed by the SDSS, although the Balmer-strong galaxies do not cover the low-mass end of the distribution. Note that the histograms are not corrected for incompleteness effects due to sample or survey flux limits, and therefore are not suitable for drawing conclusions about the underlying distributions of galaxy mass. To aid the reader, the position of the galaxy mass bimodality is marked by a downward arrow. The right hand panel of Figure 1 shows the Balmer decrement distributions of the 4 samples, showing how the Balmer-strong and ULIRG samples are significantly dustier on average than the SSGSS and Seyfert samples.
In Figure 2 we show the position of the four samples on the BPT diagram, with the underlying grayscale showing the distribution of spectroscopically observed galaxies in the SDSS. Only those galaxies with SNR in all four emission lines are plotted. This is the most commonly used optical diagram for diagnosing the presence of an AGN. Throughout this paper, we distinguish 4 classes of galaxies: (i) AGN-dominated, with emission-line ratios which place them above the stringent theoretical starburst criterion of ?), or have [NII]/; (ii) star-formation dominated, which lie below the observationally determined demarcation line of ?), or have [NII]/; (iii) composite objects, which lie between the AGN-dominated and star-forming dominated samples; we term them “composite” to indicate that the emission may be caused by a combination of both AGN and starformation (?, although see caution below); and (iv) unclassified objects with non-existent or weak (SNR) emission lines which do not allow classification into the first three samples.
We note that the BPT diagram does not provide a firm demarcation between the samples and that the demarcation lines are not motivated by robust theoretical predictions; we use the lines only to provide a convenient broad classification. ?) present up-to-date modelling of the “maximum starburst” demarcation line, placing it much closer to the observed star forming branch in the SDSS than the ?) line. Shocks, high metallicity, and ionisation by old stars can also cause galaxies to lie in the “composite” class (?). We note that most of the Balmer-strong galaxies have detectable molecular H2 lines, as do the majority of ULIRGs (?). In the case of ULIRGs these lines are thought to arise primarily from photodissociation regions (PDR) associated with star formation. The H2/PAH flux ratio of the Balmer-strong galaxies is exactly that expected for star forming galaxies (Ogle et al. in prep.), indicating that shocks are similarly not a dominant excitation mechanism in the Balmer-strong galaxies. This suggests that the high [NII]/ line ratios in these samples are in general caused by a central AGN, rather than shocks. Signal-to-noise ratio limits placed on emission lines may preferentially cause very high-metallicity galaxies and LINERs caused by shocks and/or ionisation by old stars to be “unclassified” in the SSGSS sample (?). However, none of these caveats affect the results of this paper which do not rely on a precise identification of weak AGN, or on the precise positioning of pure AGN or starforming galaxies on the BPT diagram. Where possible we include unclassified SSGSS galaxies in the figures.
Out of the 80 SSGSS galaxies, 4 are AGN-dominated, 21 are composite objects, 35 are star-forming and 20 are unclassified. Out of the 11 Balmer-strong galaxies 2 are AGN-dominated and the remainder composite objects. 3 ULIRGs are AGN-dominated (Arp220, Mrk273 and UGC5101) and 3 are composite objects (08572, 12112, 15250). All Seyferts clearly lie in the AGN dominated region by definition. Figure 2 supports our assumption that the intrinsic L([Ne ii]+[Ne iii])/L() ratio will not vary greatly between our samples. Most galaxies in the samples lie in the solar and greater region of this line ratio diagnostic diagram (??).
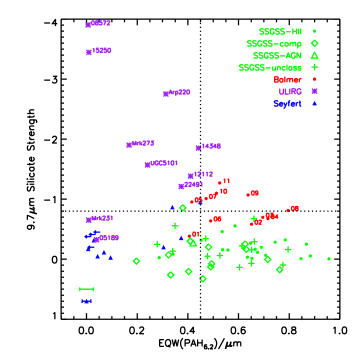
Finally, in Figure 3 we follow ?) and plot the equivalent width (EQW) of the 6.2 PAH feature against the strength of the 9.7 silicate absorption. We plot only those objects with mean SNR-per-pixel in the wavelength regions used to define the continuum for the measurement of the silicate absorption at 9.7 and with total flux/error in the 6.2 PAH feature. The lower branch is interpreted as a mixing between AGN and starformation activity, and the upper branch as an evolution from a dust obscured, to dust unobscured nuclear starburst or AGN (see Rowan-Robinson & Efstathiou 2009). Because of its focus on both dust and AGN activity, Fig. 3 is particularly useful for characterising our 4 different samples:
- Galaxies in the SSGSS
-
occupy the bottom right corner of the diagram as expected for “ordinary” star-forming galaxies or weak narrow-line AGN. They have strong EQW(PAH6.2) and weak silicate absorption. The composite galaxies in this sample have a lower mean EQW(PAH6.2) than the star-forming galaxies, strengthening the argument that these galaxies contain an AGN. The large scatter, and significant number of objects with apparent silicate emission, is indicative of the generally lower quality of these spectra compared to our other samples. SSGSS galaxies with optical emission lines which are too weak to classify them on the optical BPT diagram do not differ in mid-IR properties from their classified counterparts.
- The Balmer-strong galaxies
-
generally have stronger Silicate absorption than SSGSS galaxies, placing them between the ULIRG and SSGSS samples and therefore, within the common interpretaion of the diagram, at the end of their evolution from a dusty starburst. M82 is the prototype galaxy for this region of the diagram.
- The ULIRGS
-
are a mixed group, as has been discussed at length in the literature. Although our sample is small, it is interesting to note that the ULIRGs with particularly strong silicate dust absorption (08572, 15250), show optical emission line ratios indicative of a mixture of star formation and AGN and/or shocks. Three out of the four ULIRGs with weaker silicate absorption (Arp220, Mrk273, UGC5101), have AGN-dominated optical emission (i.e. implying little contribution from star formation, except possibly in the case of extreme shocks). This is consistent with the interpretation of the upper branch as an evolution from dusty starburst galaxies in the top-left to galaxies undergoing less intense, less dusty star formation in the bottom-right, with dust-obscured AGN activity occurring throughout the evolution.
- The Seyferts
-
are generally found to have very weak PAH equivalent widths and little Silicate absorption, and therefore lie in the region of the diagram commonly interpreted as being occupied by strong AGN which heat the dust to high temperatures. 2/20 show some silicate absorption together with stronger EQW(PAH6.2). The median (mean) BPTy values of the 4 Seyferts with EQW(PAH6.2) are 0.78 (0.75), compared to 1.01 (0.99) for the remainder of the sample. This suggests that emission from star formation contributes to the optical emission lines even in the Seyfert branch of the BPT diagram. These results are consistent with the interpretation of the lower branch of Fig. 3 as mixing between AGN and starformation activity.
3.6 Aperture Corrections
“Aperture bias” describes the effects caused by the fact that a fixed aperture or slit width may probe only a small fraction of a galaxy’s total light, and this fraction is a function of galaxy radius and redshift. The physical size probed by the SDSS 3″ fibre varies from under 1kpc for the majority of the ULIRG sample to around 10kpc at the maximum redshift of the SSGSS galaxies. Fortunately the results in this paper rely upon line ratios or equivalent widths rather than absolute luminosities, and therefore aperture bias in this usual sense is less relevant.
However, comparing line strengths from the IRS spectra with those from the SDSS spectra leads to other aperture related issues. The finite (and different) slit and fibre apertures may mean that the IRS and SDSS spectra sample a different fraction of the same galaxy, and this will cause measured line ratios to differ from the true values. There are two important issues: (i) light is lost from the slit/fibre due to the PSF; (ii) light is lost from the outer regions of extended sources, depending on the size of the aperture and the accurate positioning of the aperture on the source. In this paper the precise flux calibration between the two datasets is relatively unimportant, but it is still important that we minimise any additional scatter in the observed relations. To help the reader to understand the limitations of our data, we outline here the flux calibration procedures of the mid-IR and optical spectra.
The IRS PSF increases substantially from the blue to the red wavelength extremes of the instrument, and therefore each IRS slit has a different width designed so as not to loose too much of the light at the reddest ends111111The short-low (SL) IRS module covering the wavelength range 5.2-14.5 has a slit aperture of 3.6″57″. The long-low (LL) IRS module covering the wavelength range 14.0-38.0 has a slit aperture of 10.6″168″. At high resolution, the short-high (SH) module covers 9.9-19.6 with a slit aperture of 4.7″11.3″ and the long-high (LH) module covers 18.7-37.2 with a slit aperture of 11.1″22.3″.. The spectral extraction procedure accounts for the varying PSF along the slit by normalising the flux at each wavelength according to the fraction of light missed from a calibration stellar point-source.
The SDSS DR7 spectra have been spectrophotometrically calibrated using the PSF magnitudes of stars observed on the same plate as the galaxies (?). To aid aperture corrections, the SDSS-MPA emission line measurements have been recalibrated to the 3″ fibre magnitudes. Therefore, to match the stellar PSF-normalised mid-IR spectra, we have removed this recalibration, returning the flux level of the SDSS emission lines to the stellar PSF-normalised values.
The use of stellar PSF spectrophotometric calibration for both optical and mid-IR spectra allows good relative calibration for point sources, but inaccuracies will still arise in the case of extended sources. For centrally concentrated sources, such as circumnuclear starbursts in ULIRGs or AGN NLR emission, the point-source approximation is a good one. However, for extended sources, the measured mid-IR to optical line ratios may depend on the relative size of the apertures, and the relative surface brightness distribution of the sources. Both effects are difficult to correct for accurately, especially in the case of radial differences within the sources (for example, in AGN vs. starforming nebular emission). We have therefore not attempted any further aperture correction, and will caution the reader at points in the text where this effect may be relevant.
4 Results
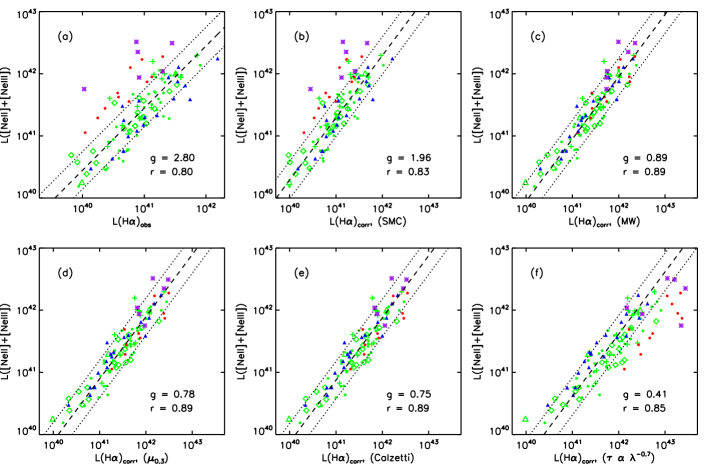
In Figure 4 we plot vs. [Ne ii] [Ne iii] (from now on [Ne]) luminosities for all of the samples, firstly with uncorrected for dust attenuation, and then corrected with five different dust-curves selected from the literature to cover the full range in possible greyness. The panels are ordered by increasing greyness of the dust-curve used, from the screen-like extinction-curves (SMC and MW), to galaxy continuum derived attenuation-curves (Calzetti and ). The SMC curve was evaluated from the tabulated results of ?) with an R; the MW curve was taken from ?) with an R; the curve is from ?); the Calzetti curve is from ?) with R; the curve is from CF00 as discussed in Section 2.
In each panel a maximum-likelihood best-fit linear relation is fit to the SSGSS-starforming sample allowing for errors in both and axis quantities and fixing the intercept to be zero (dashed line). Twice and half the best-fit [Ne] luminosity for each luminosity is indicated as dotted lines to aid comparison between the panels of the scatter between the two quantities. The best-fit gradient (, equal to the best-fit intrinsic [Ne]/ ratio) and Pearson’s correlation coefficient () are given in the bottom right of each panel, both evaluated using the SSGSS-starforming sample only.
In panel a it is immediately evident that without correcting for dust attenuation the scatter between and [Ne] emission luminosities is large, even for the SSGSS galaxies with normal levels of dust. For the dusty Balmer-strong and ULIRG samples, there is a clear excess of [Ne] for their observed luminosity as expected for dusty galaxies.
As we move through the dust laws, from least to most grey [panels b to f], we see steady trends. The best-fit intrinsic [Ne]/ ratio monotonically decreases, and the correlation coefficient is maximal for the MW, and Calzetti dust-curves. Focussing on the dusty Balmer-strong and ULIRG samples, we notice that these move from lying above the relation defined by the SSGSS-starforming galaxies in panels a and b, to lying below the relation in panel f. This is caused by their under- and over-correction for dust attenuation using the different dust-curves.
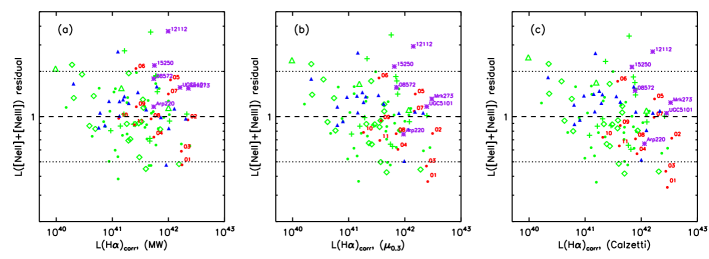
In Figure 5 we show the samples more clearly by plotting the residual of the [Ne] luminosity from the linear fit using the MW, and Calzetti dust curves. The mean and variance of each sample in these figures is informative for comparing the different dust curves. For the dusty ULIRGs the mean is 2.0, 1.6, 1.5 for the MW, and Calzetti dust-curves respectively i.e. they are significantly offset for all dust-curves (see below for further discussion). For the Balmer-strong sample, the mean is 1.1, 0.9 and 0.8, suggesting perhaps that a dust curve in between the MW and is most appropriate but any offset between this extreme dusty sample and ordinary starforming galaxies is very small. For the SSGSS starforming sample, the mean is 1 by definition for all dust-curves. The variance is 0.15 for all dust-curves, i.e. the scatter is less than a factor of 2 and there is no strong trend with luminosity for the starformation dominated galaxies.
From these figures we can identify the expected offset of the AGN caused by a higher intrinsic [Ne]/ ratio. For the Seyfert sample and dust curve the mean offset is 1.26, i.e. about a 25% enhancement in [Ne] for their luminosity. The magnitude of this offset does not correlate with position on the BPT diagram or PAH equivalent width, although the size of the sample is too small to rule out the possibility that those with a smaller offset have a greater contribution to star formation in their lines. Averaged over the samples, the offset is seen only for the Seyfert galaxies, and the three SSGSS-AGN which lie in or close to the Seyfert region on the BPT diagram. The SSGSS composite sample have a mean of 1 for all dust-curves, which suggests that the AGN in general does not contribute significantly to the Ne/ line ratio in these composite galaxies. However, the trend upwards at low luminosities is driven by composite objects, suggesting there may be a small effect at low star formation rates. The observed average enhancement in the [Ne]/ ratio of the ULIRGs noted above, could be due to small number statistics, the dust curve (i.e. a shallower dust curve would be more appropriate), or the presence of deeply buried AGN. We note that the ULIRGs are only offset by at most a factor of 3, i.e. dust corrected luminosity tracks mid-IR [Ne] luminosity to better than a factor of 3 even in extreme dusty and disturbed objects. We will return to these points below.
The maximum likelihood fits provide a measure of the dust-free ratio of [Ne] to luminosity in our IRS/SDSS datasets, when star formation is the dominant excitation mechanism for the line emission:
| (6) |
where L[Ne] = L([Ne ii] )+L([Ne iii] ) and for the MW, and Calzetti dust-curves respectively. While it is encouraging that the measured intrinsic ratio lies exactly at the center of the range predicted by the models for twice Solar metallicity H ii regions (see Section 2.1), a precise comparison between models and data would only be possible after much greater care has been taken to perform precise aperture corrections. In the case of the AGN, the emission line source is point-like and therefore the relative calibration between the mid-IR and optical spectra should be the most accurate. The fact that the average [Ne]/ ratio is a little lower than predicted may be due to contamination by star formation in a subset of the Seyfert sample (see Section 3.5).
In the following subsection we study the differences between the dust curves in more detail.
4.1 Comparison of common dust attenuation laws
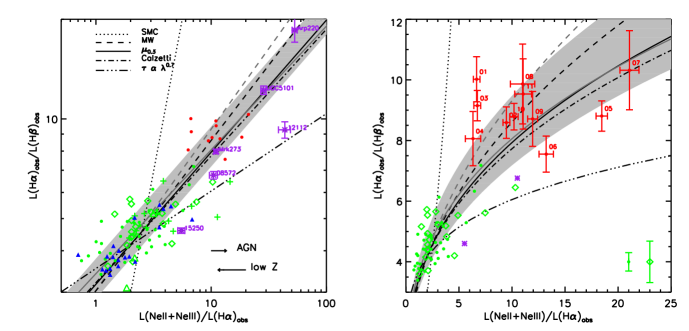
In Fig. 6 we plot the observed [Ne]/ vs. / luminosity ratios for all of our samples. In the left-hand panel we use a logarithmic scale to allow the dustiest ULIRGs to appear. In the right-hand panel we focus on the less extreme objects, and only include galaxies where their optical emission line ratios indicate starformation is a significant emission line source (classified as composite or starforming in the optical BPT diagram, Fig. 2). Overplotted as black lines are the predicted line ratios from the different dust curves presented in the previous subsection. In each case the intrinsic [Ne]/ ratio is set from the fit to the SSGSS-starforming galaxies as described above.
Although there are several factors which can move galaxies within this diagram, dust has the strongest effect, increasing both the Balmer decrement and observed [Ne]/ ratio by an order of magnitude over the range probed by our samples. The different dust-curves predict different relations between these two line ratios, even when we allow the intrinsic [Ne]/ ratio to be a free parameter fit by the data. As shown in the previous section, the MW, and Calzetti dust-curves provide the best fits to the SSGSS-starforming galaxies. Figure 6 shows that the and Calzetti attenuation curves also pass through the center of the Balmer-strong sample.
The scatter of the SSGSS-starforming galaxies about the best-fit dust-curves is large, and this may have several origins. Firstly, the errors on the line flux measurements, particularly in are significant. Secondly, we expect some variation due to different metallicities. The grey shaded region shows the range predicted by the theoretical models for twice Solar H ii regions, and the arrow in the left hand panel shows how this region moves for Solar H ii regions. The 3 galaxies with the lowest measured [Ne]/ ratio lie significantly to the left of the prediction, but within the prediction. These 3 galaxies also have some of the highest [OIII]/ and [Ne iii]/[Ne ii] ratios of the sample, indicative of harder ionisation perhaps resulting from lower metallicity star formation. The single Seyfert galaxy with a [Ne]/ ratio less than 1 has the lowest [NII]/ ratio of the whole sample, unusually low for Seyfert galaxies, and likely associated with accretion of low-metallicity gas (?).
While low metallicities can explain the scatter of SSGSS-starforming galaxies to the left of the dust-curve predictions, the scatter to the right is unlikely to be caused by metallicity variations as scatter in this direction requires significant and unlikely neon abundance increases (i.e. greater than twice solar). This leads us to the third, and most interesting, cause for scatter in the line ratio relation: intrinsic differences in the type or distribution of dust in galaxies121212Face-on galaxy orientations can also cause increased scattering into the line-of-sight and thus greyer dust curves (?). . In a 2-component dust model, increasing the fraction of dust in the diffuse ISM relative to the dense birthclouds increases the contribution from scattering and makes the dust-curve greyer. In the CF00 emission line dust model given in Eqn. 5 this relative amount of diffuse vs. dense dust is controlled by the parameter . By increasing to 0.9 (i.e. 90% of the effective optical depth from the dust comes from the ISM, and 10% from the stellar birthclouds), we can describe the lower envelope of the SSGSS galaxies. While this qualitative result is suggestive, a further detailed study including orientation, metallicity and ionisation effects would be required to confirm that these galaxies do indeed have a significantly different dust geometry.
It is evident that the 3 ULIRGs classified as composite galaxies by their optical line ratios also appear to favour a greyer dust curve than the dusty Balmer-strong galaxies. However, as we discuss further below, it is also plausible that the high Ne/ ratio observed in these ULIRGs, as well as in some SSGSS-composite galaxies, is simply due to a deeply buried AGN.
We summarise the results up to this point by noting that a single appropriate dust curve, combined with an accurately measured Balmer decrement, can recover the intrinsic optical emission line luminosities to better than a factor of two in the majority of ordinary starforming and dusty galaxies. Our data shows that this remains true for galaxies with dust contents up to an of 4.4. However, while the use of a MW, or Calzetti dust-curves for large samples of galaxies will cause the least overall bias in the final dust-corrected emission line luminosities, the effect of a greyer dust-curve in individual galaxies should not be understated. A galaxy with a very typical measured / ratio of 4.5 would have its luminosity, and thus star-formation rate, corrected by a factor of around 2.5 using the average dust curve, whereas a factor of 7 would be more appropriate if the majority of its dust were in the diffuse ISM.
4.2 Fitting the dust curve
Throughout the remainder of the paper we will focus on results using the CF00 dust-curve as it allows greater flexibility than the traditional dust-curves in the calculation of errors, and the discussion of variations in dust-curves within the sample as presented in the previous section. Additionally, it is the only dust-curve specifically motivated and justified for the correction of nebular emission lines. The MW dust-curve assumes a screen-like dust distribution, and the Calzetti dust-curve is intended for correcting the continuum light from galaxies. Rather than assuming as derived by CF00, we can fit the [Ne] vs. luminosities of the SSGSS-starforming galaxies to obtain the best-fit and intrinsic [Ne]/ ratio together with errors. We use a maximum-likelihood linear fit, accounting for errors on both quantities, and fix the intercept to be zero131313Allowing the intercept to be non-zero results in the same fitted parameters within the errors.. Formal, statistical errors on the derived are at the level of 5%. The errors obtained from bootstrap resampling with replacement of the data are more significant, and we quote these errors below, and use them to obtain errors on the dust correction formulae presented in Section 5.1 and 5.2.
We find , i.e. on average 40% of the optical depth at 5500Å arises in the ISM of the galaxies. This is consistent within the errors with the derived by CF00 for their sample of local starburst galaxies. The intrinsic [Ne]/ ratio fit at the same time is . The resulting curve is shown as the solid gray line in Figure 6 and given explicitly as:
| (7) |
where is in Å. Given a measured / flux ratio, the optical depth at any wavelength can be obtained from:
| (8) |
where is given in Eqn. 7 is the attenuation in magnitudes, and a Case B recombination ratio of 2.86 is assumed.
4.3 Dense vs. diffuse dust
Extinction in the mid-IR continuum is dominated by the stretching and bending modes of amorphous silicate grains with two strong features at 9.7 and 18. Importantly for this section, it is evident from the many theoretical models that any significant silicate absorption, as found in the ULIRGs and many of the Balmer-strong galaxies, implies optical extinction at levels of (e.g. ??). It is therefore impossible for ionising UV continuum and associated line radiation to pass through these clouds directly.
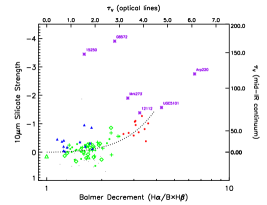
In Figure 7 we plot the Balmer decrement [/(B) where B is the unattenuated ratio] against the 9.7 Silicate absorption strength for all four samples. For H ii regions we set for Case B recombination at 10,000K and electron density of /cm-3 (?). For AGN we set (?). Surprisingly, we see a correlation between these two measures of dust content for most galaxies in our samples. However, it is clear that they do not trace the same dust because the measured from the Balmer emission lines (upper axis) is an order of magnitude lower than that indicated by the mid-IR silicate absorption strengths (right-hand axis, from zero-age starburst models of Rowan-Robinson & Efstathiou 2009). The dotted line is the best-fit squared relation to the SSGSS-starforming, composite and Balmer-strong galaxies:
| (9) |
In the case of starforming galaxies without a strong AGN, the mid-IR continuum predominantly arises from dust grains situated within the H ii regions re-radiating the light from young and hot stars. It is this dust continuum that is absorbed by the Silicate grains along the line-of-sight between the light source and the observer. Balmer emission lines also come from ionised gas within H ii regions. Thus, the observed correlation between the Silicate absorption strength and Balmer decrement implies either: (i) a correlation between the amount of dust in dense stellar birth clouds which cause the Silicate absorption, and the amount of dust in more diffuse stellar birth clouds which cause the absorption of the optical emission lines; or (ii) a self-similar structure for H ii regions in which the Balmer lines that reach the observer have passed through a fixed fraction of the dense dust clouds.
There are two notable exceptions where the optical Balmer decrement fails to predict the presence of an extremely significant attenuation in the mid-IR: the ULIRGs 15250 and 08572. ?) find that both of these ULIRGs have significant contributions from AGN to their bolometric luminosity (53 and 87% respectively), using a spectral decomposition between 5 and 8. Models have shown that extremely strong silicate absorption, as observed in these two ULIRGs, requires a steep temperature gradient within the obscuring cloud, which can only be obtained where the light source responsible for heating the dust that causes the mid-IR continuum is deeply buried in a smooth thick shell of dust that is both geometrically and optically thick (?). This is again consistent with the source being an AGN, although a nuclear starburst may suffice. A clumpy distribution of dust leads to much shallower absorption or emission (?). Our emission line analysis is also consistent with these galaxies harbouring a buried AGN, they have an increased [Ne]/ ratio and lie in the composite region of the BPT diagram. While the position of these galaxies on the BPT diagram is not in itself conclusive proof that these two ULIRGs harbour an AGN, if their position is caused by the AGN then it indicates that ionising radiation from the AGN escapes to ionise the NLR, despite the dense dust cloud that presumably surrounds the central continuum source. Two dusty Seyfert galaxies and one ULIRG with a Seyfert nucleus (Mrk273) also lie above the relation defined by the SSGSS and Balmer-strong galaxies, further supporting the idea that dust along the line-of-sight to a deeply buried AGN can lead to stronger silicate absorption, relative to nebular line absorption, than normal H ii regions.
We are not aware of any models which simultaneously predict the strength of silicate absorption and attenuation of the optical emission lines. Qualitatively Figure 7 suggests a two component model is required to describe the dust distribution in galaxies/AGN. The lower branch is consistent with silicate absorption arising in the clumpy distribution of stellar birthclouds, with the densest clouds causing some silicate absorption, and the Balmer emission lines originating from the same star formation regions but further out in the clouds. The upwards scatter of some sources from this branch is consistent with the dust being concentrated in a dense shell-like distribution obscuring a single nuclear source, most likely an AGN in the cases studied here, but also conceivably a strong nuclear starburst.
4.4 Galaxies with an AGN
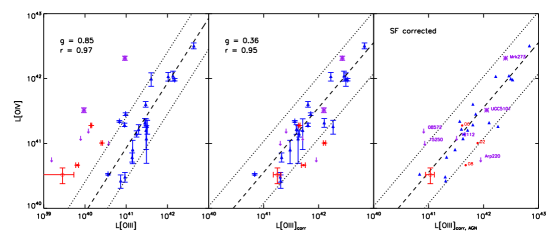
As explained in Section 2.1, a dust curve and accurate Balmer decrement that adequately corrects H ii region emission lines for dust attenuation, will not necessarily do the same for lines from the NLR of AGN. Particularly in composite objects, a higher fraction of Balmer lines will arise from within the H ii regions of the galaxy compared to lines such as [OIII] which are stronger in NLRs. Therefore a form of differential extinction might arise between the Balmer and higher ionisation lines, and a corresponding bias in the correction of AGN NLR lines for dust using the measured Balmer decrement. Additionally, the form of the dust curve may not be the same for light originating from H ii regions and from an AGN NLR, due to the different relative geometry between the light source and the dust cloud, and the different balance between dense and diffuse dust attenuating the lines. The mid-IR [OIV] line at 25.89 has been shown to be an accurate indicator of AGN power (?), and the [OIII]/[OIV] ratio a possible measure of AGN attenuation (?). In this section we test the accuracy of dust-corrected L[OIII] as a measure of AGN luminosity in our sources by comparing to the mid-IR [OIV] line.
In Figure 8 we plot dust-uncorrected and dust-corrected L[OIII] vs. L([OIV] ) for the Seyferts, the 3 Balmer-strong galaxies and the 2 ULIRGs with measured [OIV] lines. Note that the correlation coefficient is similar for the Seyferts whether the dust correction is performed or not. These Seyferts have very small Balmer decrements so the dust correction has only a small effect. Because some of these objects are classified as composite AGN-starformation by their optical line ratios, and [OIII] is also produced by starformation, in the right hand panel we apply a correction for this following the method of ?), based on the expected [OIII]/ ratio for metal-rich starforming galaxies141414We note that such a correction would not be appropriate for the ULIRGs if shocks were a significant contributor to the total luminosity.. [OIV] is also produced in H ii regions, although the contamination is expected to be much smaller than for [OIII] due to the higher ionisation level. Clearly, there is a tight correlation between dust-corrected L[OIII] and L[OIV] for the Seyfert sample (see also ?). All of the dusty Balmer-strong galaxies and ULIRGs with measured [OIV] fall within a factor of 3 of the relation defined by the Seyferts. Only the upper limit for Arp220 is marginally inconsistent with the relation defined by the Seyfert galaxies. Taking the remainder of the Balmer-strong galaxies and stacking the SH spectra in luminosity units shows a clear [OIV] line, which we fit together with the neighbouring Fe ii line using a double Gaussian. The corresponding stacked L[OIV]-L[OIII] luminosity also lies exactly on the Seyfert relation, once contamination of L[OIII] from star formation has been accounted for. Errors are estimated from the standard deviation of the luminosity on removing one spectrum at a time from the stack. This strong correlation between [OIV] and [OIII] dust corrected using the observed Balmer decrement and dust-curve appropriate for H ii regions, for even dusty composite galaxies, shows that there is no evidence for significant differential extinction between lines emitted from the NLR and H ii regions of a galaxy. Although slightly surprising, this may imply that the majority of dust attenuation suffered by NLR emission lines comes from the diffuse dust and H ii regions in the intervening galaxy, through which they must pass on their way to the observer.
Unfortunately neither of the two ULIRGs with extreme silicate absorption (08572 and 15250) have measured L[OIV], so we cannot test directly whether optical and mid-IR NLR lines agree even in the presence of extreme, dense obscuration of the central light source. Such a study may be possible with the large samples of ULIRGs now available in archives.
5 Discussion
The potential of dust attenuation and complicated dust geometries to render useless optical observations of extreme galaxies is sometimes used to justify rest-frame IR observations. In the previous sections we have used the correlation between the unattenuated mid-IR and attenuated optical nebular emission lines to argue that a single dust curve can accurately correct optical emission lines for dust attenuation in a large range of different galaxies. The correction is accurate to within a factor of 2 in most cases, and to at least a factor of 4 for even the most heavily obscured ULIRGs.
Here, we discuss the implications of our work for deriving SFRs and black hole accretion rates from the optical emission lines , [OII], and [OIII]. We present useful relations for dust corrections at the wavelengths of each of these lines.
5.1 Star formation rates
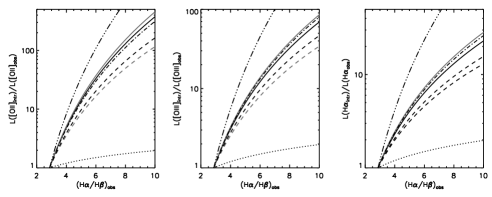
The left and right panels of Fig. 9 show the fractional attenuation (in flux units) as a function of observed Balmer decrement at and [OII], for each of the different dust curves discussed in Section 4. Using the best-fit dust curve, the recommended correction at is:
| (10) |
and at [OII]151515Note that this is an extrapolation of the dust-curve beyond the wavelength region directly tested in this paper.:
| (11) |
where is the unattenuated ratio as discussed above and errors are propagated from the errors on the best-fit . While for H ii galaxies and strong Seyferts the choice of is clear, for composite galaxies the unknown may cause small systematic uncertainties. However as H ii regions have relatively stronger emission, a value of is probably close to reality.
To derive a star formation rate from optical nebular emission lines, two steps are required. This paper has focused on the first step: to correct the line for dust attenuation. The second step is to convert the dust-corrected line luminosity into a star formation rate. While our results show that dust-corrected luminosity traces [Ne] luminosity, this is not enough to confirm the reliability of as an indicator of star formation rate in extremely dusty objects. This is because dense dust clouds can have high optical depths even in the mid-IR, as indicated by the strong Silicate absorption in some galaxies, and thus even the neon lines may be attenuated in some objects. In addition, the most extreme compact, dusty galaxies may even have a non-negligible fraction of their ionizing photons absorbed by dust and not gas (and thus not traced by H). Encouragingly, Ho & Keto (2007) have already shown how [Ne] luminosity correlates strongly with both the total infrared luminosity and Brackett- luminosity in star-forming galaxies. Their galaxy sample includes a handful of ULIRGs, showing that these relations hold even at extreme luminosities. This result provides circumstantial evidence that the neon luminosity is tracing star-formation even in the dustiest of galaxies. In contrast, Farrah et al. (2007) find [Ne] luminosity in ULIRGs to be deficient by 0.4dex from the Ho & Keto relation, which they ascribe to extinction of the [Ne] lines. In a companion paper we plan to address this issue directly by comparing the star formation rates derived from the full SEDs, with that derived from the emission lines.
5.2 Black hole accretion rates
As with star formation rate, the derivation of black hole accretion rates (BHAR) from nebular emission line luminosities requires two steps: correction for dust emission discussed in this paper, and then conversion into BHAR via a bolometric correction.
For the best-fit dust curve, the relevant correction for dust attenuation at [OIII] is:
| (12) |
where B is the unattenuated ratio as discussed above. The correction caused by the different dust curves is presented in the central panel of Figure 9.
The exponent for the dust curve is larger than that used in some AGN literature and can lead to significant differences in estimated bolometric AGN luminosity and accretion rates as a fraction of (see also the discussion in ?). Using a smaller exponent than appropriate will cause an underestimate in L[OIII]corr which will vary with dust content. For example, for the relatively dust-free sample of Seyfert galaxies studied in this work, the difference between the dust curve exponent of 3.55, and 2.94 (from a MW extinction law) used in e.g. ?) and ?) leads to differences ranging from 5 to 30%. The potential increase in the under- (or over-)estimation of the line luminosity with increasing dust content because of an inappropriate dust-curve has important implications for understanding whether the bolometric correction for L[OIII] changes systematically with L[OIII], due to the correlations between SFR of the host galaxy and the luminosity of the central AGN (e.g. ????) and the SFR and dust content of the host (?). Our results do not explicitly constrain which dust-curve is most appropriate for Seyferts, however, we would like to emphasise the importance of including the errors caused by the dust-attenuation correction when studying emission line trends.
5.3 AGN detection
Even in the two ULIRGs in our sample where there is evidence for a heavily buried central nucleus, we would like to emphasise that the optical emission line ratios still indicate the possible presence of an AGN, albeit not conclusively. This shows that even where the AGN is deeply buried, some radiation may still escape to ionise the NLR clouds. This has important implications for using optical emission line ratios to identify AGN in objects such as ULIRGs, and will become increasingly important at high-z. Unfortunately neither of the two ULIRGs with strong silicate absorption in our sample have measured [OIV], and therefore we cannot directly verify that their position on the BPT diagram, and therefore their correction of [OIII] for contamination from star formation, is correct. The specific study of a larger sample of ULIRGs to compare the bolometric AGN luminosities derived from mid-IR lines, mid-IR continuum and dust- and star-formation corrected high-quality optical emission lines would now be possible with samples in the SDSS and Spitzer archives.
6 Conclusions
The purpose of this paper was to verify, or otherwise, the accuracy of fundamental quantities derived from optical emission lines, particularly in the case of significant dust attenuation of the lines. In particular, optical emission lines provide powerful measures of star formation rate and black hole accretion rate. We compared two “dusty” galaxy samples, including 6 ULIRGs, to a sample of “ordinary” galaxies from the SSGSS all with high quality SDSS optical spectra and mid-IR spectra from the Spitzer Space Telescope IRS spectrograph. The results are extremely encouraging for using rest-frame optical spectra to study dusty galaxies with an . Our results are promising even for galaxies as dusty as ULIRGs, although a much larger sample should be studied covering the full range of this diverse population, in order to verify our conclusions. Our results have important implications for future high-redshift spectroscopic surveys, where galaxies have higher star formation rates and dust contents may be correspondingly higher.
We have compared several different dust curves used in the literature to correct optical emission lines for dust attenuation. Our results favour a dust curve which lies close to the MW extinction curve, indicating that a significant fraction of the dust which attenuates nebular emission lines has a screen-like geometry. This is in agreement with the model for emission line attenuation presented by ?) and ?) and based upon the 2-component CF00 dust model. In this model, the screen-like extinction arises from the dense stellar birth clouds which surround the hottest stars responsible for ionising the gas. We find a best-fit dust-curve with on average 40% of the optical depth at 5500Å arising from diffuse ISM dust. The dust curve is not significantly different from the Calzetti dust-curve in the optical wavelength regime, however, we focus our results and analysis on the former which was intended for emission lines and allows greater flexibility, rather than the latter which was derived from galaxy continua.
Particular conclusions with regard to measuring star formation from optical emission lines in the presence of dust:
-
•
The MW, Calzetti, and best-fit dust curves all allow accurate correction of (to better than a factor of 2), and therefore accurate calculation of star formation rates, for galaxies with observed / ratios of as much as 10 ().
-
•
For only 2/6 ULIRGs with does the optical differ from the mid-IR [Ne] lines by more than a factor of 2, but then only by a factor of 4. In these two cases (08572 and 15250) we have argued that the observed excess of [Ne] is in fact caused by a buried AGN, rather than uncertainties in the dust correction (in agreement with the results of ?).
-
•
The majority of galaxies in our samples favour a dust curve close to the MW screen-like dust extinction curve. This suggests that much of the extra dust in the unusually dusty objects is located in dense clouds, rather than in the diffuse ISM.
-
•
There is tentative evidence for a range in the shape of the dust curves in ordinary starforming galaxies. For the CF00 dust model, this range translates into a variation in the fraction of optical depth arising in the diffuse ISM of between around 30% and 90%, with the remaining fraction arising in dense birth clouds. However, the variation in the intrinsic [Ne]/ ratio with metallicity, the issue of relative aperture correction between the IRS and SDSS data, and the large statistical errors on the emission line, prevent us from quantifying this scatter more precisely.
Particular conclusions with regard to identifying AGN and measuring their accretion rates from optical emission lines in the presence of dust:
-
•
The best-fit dust curve and measured Balmer decrement allows accurate correction of [OIII] for dust attenuation, to within a factor of 3. This is slightly surprising, and suggests that the effects of variations in the relative geometry of the source and dust, and differential extinction between the Balmer and higher ionisation lines, are minimal.
-
•
The method to separate the contributions to optical emission lines from both star formation and AGN presented in ?) tightens the relation between L[OIV] and L[OIII] for composite objects. This supports the use of the position of galaxies on the optical BPT line ratio diagram to measure the amount of L[OIII] originating from the AGN, and therefore the estimates of black hole accretion rates from L[OIII] corrected for dust attenuation and star formation contamination.
-
•
All ULIRGs in our sample are classified as AGN or composite objects from their optical emission line ratios. While the composite line ratios may be caused by shocks, we have argued that other observational results favour the presence of a buried AGN contributing significantly to the mid-IR continuum. It is therefore possible that sufficient ionising flux escapes from the central source to ionise the NLR, even in the case of heavily buried nuclei such as in ULIRGS 08572 and 15250. Unfortunately these two ULIRGs do not have measured L[OIV] preventing us from verifying our corrections to L[OIII] for dust attenuation and star formation contamination in such extreme cases. In the case of ULIRGs, whose properties vary widely, clearly a much larger sample should be studied before firm conclusions can be drawn.
7 Acknowledgements
We would like to thank Jarle Brinchmann for his help in understanding aperture bias issues and Stephane Charlot for comments on an early draft. We thank the anonymous referee for a careful reading of the manuscript and comments which improved its clarity. The function fitting performed in this paper used the IDL MPFIT software http://purl.com/net/mpfit (Markwardt 2009). The ITERA package was used to investigate intrinsic emission line ratios http://www.strw.leidenuniv.nl/ brent/itera.html (?).
Funding for the SDSS and SDSS-II has been provided by the Alfred P. Sloan Foundation, the Participating Institutions, the National Science Foundation, the U.S. Department of Energy, the National Aeronautics and Space Administration, the Japanese Monbukagakusho, the Max Planck Society, and the Higher Education Funding Council for England. The SDSS Web Site is http://www.sdss.org/.
The SDSS is managed by the Astrophysical Research Consortium for the Participating Institutions. The Participating Institutions are the American Museum of Natural History, Astrophysical Institute Potsdam, University of Basel, University of Cambridge, Case Western Reserve University, University of Chicago, Drexel University, Fermilab, the Institute for Advanced Study, the Japan Participation Group, Johns Hopkins University, the Joint Institute for Nuclear Astrophysics, the Kavli Institute for Particle Astrophysics and Cosmology, the Korean Scientist Group, the Chinese Academy of Sciences (LAMOST), Los Alamos National Laboratory, the Max-Planck-Institute for Astronomy (MPIA), the Max-Planck-Institute for Astrophysics (MPA), New Mexico State University, Ohio State University, University of Pittsburgh, University of Portsmouth, Princeton University, the United States Naval Observatory, and the University of Washington.
Bibliography
- Adelman-McCarthy J. K., et al collaboration T. S., 2008, ApJS, 175, 297
- Armus L., Charmandaris V., Bernard-Salas J., et al. 2007, ApJ, 656, 148
- Baldwin J. A., Phillips M. M., Terlevich R., 1981, PASP, 93, 5
- Bassani L., Dadina M., Maiolino R., Salvati M., Risaliti G., della Ceca R., Matt G., Zamorani G., 1999, ApJS, 121, 473
- Böker T., Calzetti D., Sparks W., Axon D., Bergeron L. E., Bushouse H., Colina L., Daou D., Gilmore D., Holfeltz S., MacKenty J., Mazzuca L., Monroe B., Najita J., Noll K., Nota A., Ritchie C., Schultz A., Sosey M., Storrs A., Suchkov A., 1999, ApJS, 124, 95
- Borgne D. L., Elbaz D., Ocvirk P., Pichon C., 2009, A&A, 504, 727
- Brinchmann J., Charlot S., White S. D. M., Tremonti C., Kauffmann G., Heckman T., Brinkmann J., 2004, MNRAS, 351, 1151
- Bruzual G., Charlot S., 2003, MNRAS, 344, 1000
- Calzetti D., 2001, PASP, 113, 1449
- Calzetti D., Armus L., Bohlin R. C., Kinney A. L., Koornneef J., Storchi-Bergmann T., 2000, ApJ, 533, 682
- Calzetti D., Kinney A. L., Storchi-Bergmann T., 1994, ApJ, 429, 582
- Calzetti D., Kinney A. L., Storchi-Bergmann T., 1996, ApJ. 458, 132
- Cardelli J. A., Clayton G. C., Mathis J. S., 1989, ApJ, 345, 245
- Charlot S., Fall S. M., 2000, ApJ, 539, 718 (CF00)
- da Cunha E., Charlot S., Elbaz D., 2008, MNRAS, 388, 1595
- da Cunha E., Eminian C., Charlot S., Blaizot J., 2010, arXiv, astro-ph.CO
- Díaz-Santos T., Alonso-Herrero A., Colina L., Packham C., Levenson N. A., Pereira-Santaella M., Roche P. F., Telesco C. M., 2010, ApJ, 711, 328
- Eliche-Moral M. C., Prieto M., Gallego J., Zamorano J., 2010, eprint arXiv, 1003, 686
- Farrah D., et al., 2007, ApJ, 667, 149
- Fernandes R. C., Stasińska G., Schlickmann M. S., Mateus A., Asari N. V., Schoenell W., Sodré L., 2010, MNRAS, 403, 1036
- Groves B. A., Allen M. G., 2010, New Astronomy, 15, 614
- Groves B. A., Dopita M. A., Sutherland R. S., 2004, ApJS, 153, 75
- Groves B. A., Heckman T. M., Kauffmann G., 2006, MNRAS, 371, 1559
- Haas, M., Siebenmorgen, R., Schulz, B., Krügel, E., & Chini, R. 2005, A&A, 442, L39
- Heckman T. M., Kauffmann G., Brinchmann J., Charlot S., Tremonti C., White S. D. M., 2004, ApJ, 613, 109
- Higdon S. J. U., Armus L., Higdon J. L., Soifer B. T., Spoon H. W. W., 2006, ApJ, 648, 323
- Higdon S. J. U., Devost D., Higdon J. L., Brandl B. R., Houck J. R., Hall P., Barry D., Charmandaris V., Smith J. D. T., Sloan G. C., Green J., 2004, PASP, 116, 975
- Ho L. C., Keto E., 2007, ApJ, 658, 314
- Hopkins P. F., Hernquist L., Cox T. J., Matteo T. D., Robertson B., Springel V., 2006, ApJS, 163, 1
- Houck J. R., Roellig T. L., van Cleve J., et al. 2004, ApJS, 154, 18
- Ilbert O., Salvato M., Floc’h E. L., et al. 2010, ApJ, 709, 644
- Johnson B. D., Schiminovich D., O’Dowd M., Meder K., Treyer M., 2009, The Evolving ISM in the Milky Way and Nearby Galaxies, p. 31
- Kauffmann G., Heckman T. M., Tremonti C., et al 2003, MNRAS, 346, 1055
- Kauffmann G., Heckman T. M., White S. D. M., et al 2003, MNRAS, 341, 33
- Kennicutt R. C., Hao C.-N., Calzetti D., Moustakas J., Dale D. A., Bendo G., Engelbracht C. W., Johnson B. D., Lee J. C., 2009, ApJ, 703, 1672
- Kewley L. J., Dopita M. A., Sutherland R. S., Heisler C. A., Trevena J., 2001, ApJ, 556, 121
- Kewley, L. J., Groves, B., Kauffmann, G., & Heckman, T. 2006, MNRAS, 372, 961
- LaMassa S. M., Heckman T. M., Ptak A., Hornschemeier A., Martins L., Sonnentrucker P., Tremonti C., 2009, ApJ, 705, 568
- LaMassa, S. M., Heckman, T. M., Ptak, A., Martins, L., Wild, V., Sonnentrucker, P., & Tremonti, C. 2010, arXiv:1007.0900
- Lamastra A., Bianchi S., Matt G., Perola G. C., Barcons X., Carrera F. J., 2009, A&A, 504, 73
- Levenson N. A., Sirocky M. M., Hao L., Spoon H. W. W., Marshall J. A., Elitzur M., Houck J. R., 2007, ApJ, 654, L45
- Levesque E. M., Kewley L. J., Larson K. L., 2010, AJ, 139, 712
- Markwardt, C. B. 2009, Astronomical Society of the Pacific Conference Series, 411, 251
- Meléndez, M., et al. 2008, ApJ, 682, 94
- Muzzin A., Marchesini D., van Dokkum P. G., Labbé I., Kriek M., Franx M., 2009, ApJ, 701, 1839
- Naab T., Khochfar S., Burkert A., 2006, ApJL, 636, L81
- Nandy K., Thompson G. I., Jamar C., Monfils A., Wilson R., 1975, A&A, 44, 195
- Nardini E., Risaliti G., Salvati M., Sani E., Watabe Y., Marconi A., Maiolino R., 2009, MNRAS, 399, 1373
- Narron R., Ogle P., Laher R. R., 2007, Astronomical Data Analysis Software and Systems XVI ASP Conference Series, 376, 437
- Nenkova M., Ivezić Ž., Elitzur M., 2002, ApJ, 570, L9
- Netzer H., 2009, MNRAS, 399, 1907
- O’Donnell J. E., 1994, ApJ, 422, 158
- O’Dowd M. J., Schiminovich D., Johnson B. D., Treyer M. A., Martin C. D., Wyder T. K., Charlot S., Heckman T. M., Martins L. P., Seibert M., van der Hulst J. M., 2009, ApJ, 705, 885
- Osterbrock D. E., Ferland G. J., 2006, Astrophysics of gaseous nebulae and active galactic nuclei
- Pei Y. C., 1992, ApJ, 395, 130
- Poggianti B. M., Wu H., 2000, ApJ, 529, 157
- Rocha M., Jonsson P., Primack J. R., Cox T. J., 2008, MNRAS, 383, 1281
- Rowan-Robinson M., Efstathiou A., 2009, MNRAS, 399, 615
- Salim S., Charlot S., Rich R. M., Kauffmann G., Heckman T. M., Barlow T. A., Bianchi L., Byun Y.-I., et al 2005, ApJL, 619, L39
- Sánchez-Blázquez P., Peletier R. F., Jiménez-Vicente J., Cardiel N., Cenarro A. J., Falcón-Barroso J., Gorgas J., Selam S., Vazdekis A., 2006, MNRAS, 371, 703
- Sanders D. B., Soifer B. T., Elias J. H., Madore B. F., Matthews K., Neugebauer G., Scoville N. Z., 1988, ApJ325, 74
- Schweitzer M., Lutz D., Sturm E., Contursi A., Tacconi L. J., Lehnert M. D., Dasyra K. M., Genzel R., Veilleux S., Rupke D., Kim D.-C., Baker A. J., Netzer H., Sternberg A., Mazzarella J., Lord S., 2006, ApJ, 649, 79
- Seaton M. J., 1979, MNRAS, 187, 73P
- Silva L., Granato G. L., Bressan A., Danese L., 1998, ApJ, 509, 103
- Sirocky M. M., Levenson N. A., Elitzur M., Spoon H. W. W., Armus L., 2008, ApJ, 678, 729
- Smith J. D. T., Draine B. T., Dale D. A., et al. 2007, ApJ, 656, 770
- Soifer B. T., Sanders D. B., Madore B. F., Neugebauer G., Danielson G. E., Elias J. H., Lonsdale C. J., Rice W. L., 1987, ApJ, 320, 238
- Spoon H. W. W., Marshall J. A., Houck J. R., Elitzur M., Hao L., Armus L., Brandl B. R., Charmandaris V., 2007, ApJL, 654, L49
- Stasińska G., Asari N. V., Fernandes R. C., Gomes J. M., Schlickmann M., Mateus A., Schoenell W., Sodré L., 2008, MNRAS, 391, L29
- Veilleux S., Kim D.-C., Sanders D. B., 2002, ApJS, 143, 315
- Wild V., Heckman T., Charlot S., 2010, arXiv, astro-ph.CO
- Wild V., Heckman T., Sonnentrucker P., Groves B., Armus L., Schiminovich D., Johnson B., Martins L., LaMassa S., 2010, arXiv, astro-ph.CO
- Wild V., Kauffmann G., Heckman T., Charlot S., Lemson G., Brinchmann J., Reichard T., Pasquali A., 2007, MNRAS, 381, 543
- Wild V., Walcher C. J., Johansson P. H., Tresse L., Charlot S., Pollo A., Fèvre O. L., de Ravel L., 2009, MNRAS, 395, 144
- Yu Q., Tremaine S., 2002, MNRAS, 335, 965
- Zheng X. Z., Bell E. F., Somerville R. S., Rix H.-W., Jahnke K., Fontanot F., Rieke G. H., Schiminovich D., Meisenheimer K., 2009, ApJ, 707, 1566
Appendix A Sample information
| Name | RA (deg) | Dec (deg) | specobjid | rowindex | z |
|---|---|---|---|---|---|
| PSB01 | 181.225 | 52.395 | 248485859366535168 | 284940 | 0.0632 |
| PSB02 | 169.600 | 56.036 | 256085720727289856 | 296570 | 0.0680 |
| PSB03 | 173.251 | 60.275 | 268189274979958784 | 315471 | 0.0644 |
| PSB04 | 167.291 | 45.857 | 404988882665340928 | 491844 | 0.0636 |
| PSB05 | 136.004 | 1.458 | 132797726868897792 | 105860 | 0.0535 |
| PSB06 | 120.199 | 37.729 | 213582458531086336 | 232315 | 0.0416 |
| PSB07 | 339.726 | 13.194 | 208235580251701248 | 223368 | 0.0628 |
| PSB08 | 128.311 | 32.583 | 262560681922920448 | 306604 | 0.0558 |
| PSB09 | 239.431 | 27.465 | 391758540508758016 | 472114 | 0.0316 |
| PSB10 | 139.864 | 33.791 | 448335754997792768 | 536057 | 0.0193 |
| PSB11 | 158.162 | 12.178 | 450306505485320192 | 539391 | 0.0329 |
| Name | RA (deg) | Dec (deg) | specobjid | rowindex | z |
|---|---|---|---|---|---|
| IRAS 08572+3915 | 135.106 | 39.065 | 337714854909444096 | 394321 | 0.0579 |
| IRAS 12112+0305 | 183.441 | 2.811 | 146028589375029248 | 126942 | 0.0730 |
| IRAS 15250+3609 | 231.748 | 35.977 | 394574695615168512 | 476759 | 0.0553 |
| Arp220 | 233.738 | 23.504 | 609061542893191168 | 755340 | 0.0181 |
| Mrk273 | 206.176 | 55.887 | 372055066565148672 | 439991 | 0.0373 |
| UGC5101 | 143.965 | 61.353 | 137019791402598400 | 111495 | 0.0393 |
| Name | RA (deg) | Dec (deg) | specobjid | rowindex | z |
|---|---|---|---|---|---|
| 2MASXJ08244333+2959238 | 126.180 | 29.990 | 339966523504328704 | 397741 | 0.0250 |
| CGCG064-017 | 149.812 | 12.988 | 491120230488080384 | 603606 | 0.0340 |
| Mrk0609 | 51.356 | -6.144 | 129701503752470528 | 101843 | 0.0340 |
| NCG0291 | 13.375 | -8.768 | 185153160128495616 | 190581 | 0.0190 |
| NGC5695 | 219.342 | 36.568 | 389226545811554304 | 467780 | 0.0140 |
| 2MASXJ15522564+2753435 | 238.107 | 27.895 | 391758541012074496 | 472216 | 0.0740 |
| 2MASXJ12384342+0927362 | 189.681 | 9.460 | 347285137836212224 | 409636 | 0.0830 |
| 2MASXJ08035923+2345201 | 120.997 | 23.756 | 356292212926971904 | 415287 | 0.0290 |
| 2MASXJ16164729+3716209 | 244.197 | 37.273 | 297464197648744448 | 366718 | 0.1520 |
| 2MASXJ11570483+5249036 | 179.270 | 52.818 | 248485858699640832 | 284823 | 0.0360 |
| 2MASXJ12183945+4706275 | 184.664 | 47.108 | 408648327781941248 | 498207 | 0.0940 |
| SBS1133+572 | 173.954 | 56.952 | 369240319515951104 | 435171 | 0.0510 |
| SBS1609+490 | 242.716 | 48.911 | 175301007746531328 | 174339 | 0.0450 |
| IC0486 | 120.087 | 26.614 | 261716087635181568 | 305068 | 0.0270 |
| CGCG242-028 | 170.755 | 47.052 | 405833433537839104 | 493622 | 0.0250 |
| Mrk1457 | 176.840 | 52.450 | 247922896524017664 | 283914 | 0.0490 |
| 2MASXJ13463217+6423247 | 206.634 | 64.390 | 170234565783191552 | 166011 | 0.0240 |
| CGCG218-007 | 200.952 | 43.301 | 387537584101785600 | 464960 | 0.0270 |
| 2MASXJ10181928+3722419 | 154.580 | 37.378 | 401892408733728768 | 486221 | 0.0490 |
| 2MASXJ11110693+0228477 | 167.779 | 2.480 | 143495710086529024 | 122473 | 0.0350 |
Appendix B Balmer-strong galaxies
While three of the samples studied in this paper have been presented elsewhere, the Balmer-strong sample has not. Here we summarise its selection criteria and the mid-IR observations.
B.1 Selection
The galaxies were selected to have:
-
•
Observed / flux ratios greater than 8
-
•
Strong Balmer absorption lines compared to their 4000Å break strength [, ?)]. Although they were not selected on a single Balmer absorption line equivalent width, which have considerably larger errors than the spectral indices used here, most have HÅ and .
-
•
Accurately measured emission lines: a signal-to-noise for all four BPT lines, together with a flux .
-
•
A contribution to their emission lines by an AGN, i.e. they lie above the empirically derived demarcation line of ?) on the BPT diagram.
-
•
so that the SDSS spectrum, taken through a 3″fibre, samples only light coming from the central few kpc of the galaxy.
B.2 Mid-IR observations
IRS observations in both high and low resolution were carried out using staring mode during program 40330 (PI Timothy Heckman).
We used SPICE to extract the 1D spectra from the low-resolution basic calibrated data (BCD) pipeline products, using the point-source and optimal extraction options. The two 1D spectra (i.e. one for each nod) were combined using a weighted mean. For the high-resolution spectra, we first identified and interpolated over additional rogue pixels using a custom IDL routine and the rogue pixel masks suitable for our campaign numbers (41-46). This procedure was repeated for the dedicated off-source background observations. All 3 science exposures were combined using a simple arithmetic mean, resulting in two 2D spectra. These were sky-subtracted and the 1D spectra were extracted using SPICE with the point-source and optimal extraction options. For each nod, the edges of each order were inspected and trimmed and the orders combined using a weighted mean where wavelengths were covered by more than one order. The 1D spectra of each nod were subsequently combined using a weighted mean.