The evolution of the Fundamental Plane of radio galaxies from to the present day
Abstract
We present deep spectroscopic data for a 24-object subsample of our full 41-object radio galaxy sample in order to investigate the evolution of the Fundamental Plane of radio galaxies. We find that the low-luminosity, FRI-type, radio galaxies in our sample are consistent with the local Fundamental Plane of radio galaxies defined by Bettoni et al. when corrected for simple passive evolution of their stellar populations. However, we find that the higher luminosity, FRII-type radio galaxies are inconsistent with the local Fundamental Plane if only passive evolution is considered, and find evidence for a rotation in the Fundamental Plane at when compared with the local relation. We show that neither passive evolution, nor a mass-dependent evolution in the mass-to-light ratio, nor an evolution in the size of the host galaxies can, by themselves, plausibly explain the observed tilt. However, we suggest that some combination of all three effects, with size evolution as the dominant factor, may be sufficient to explain the difference between the planes.
We also find evidence for a correlation between host galaxy velocity dispersion and radio luminosity at the 97% significance level within our sub-sample, although further observations are required in order to determine whether this is different for the FRI and FRII radio sources. Assuming that the relation still holds at , this implies that radio luminosity scales with black hole mass, in agreement with previous studies.
keywords:
galaxies: active – galaxies: fundamental parameters – galaxies: nuclei.1 Introduction
A number of tight correlations exist between the central black hole and the host galaxy of an active galactic nucleus (AGN): for example, the relation between black-hole mass and stellar velocity dispersion (-) (Gebhardt et al. 2000; Ferrarese & Merritt 2000; Merritt & Ferrarese 2001; Gültekin et al. 2009) and the relation between black hole mass and bulge luminosity (e.g. McLure & Dunlop 2001; McLure & Dunlop 2002; Gültekin et al. 2009). The existence of these relationships suggests that AGNs have an important role to play in the formation and evolution of galaxies via AGN-driven feedback. Various mechanisms have been suggested for this feedback, including a scenario proposed by Silk & Rees (1998) in which quasar outflows limit black hole masses, dependent on the depth of the potential wells of dark matter halos.
AGN-driven feedback is now incorporated into models of galaxy formation and evolution: for example, the semi-analytic model of Croton et al. (2006), where AGN-driven feedback is separated into “quasar-mode” (associated with the efficient accretion of cold gas) and “radio-mode” (associated with the less efficient accretion of warm gas) feedback. Sijacki et al. (2007) also separate AGN feedback into two modes in their full hydrodynamical model: the “quasar regime” (corresponding to central black holes with high accretion rates) and mechanical feedback (corresponding to central black holes with low accretion rates). Despite the nomenclature, radio galaxies can exhibit either “quasar-mode” or “radio-mode”/mechanical feedback, dependent on the accretion onto the central black hole. There is increasing evidence (e.g. Hardcastle, Evans & Croston 2007, 2009) that the accretion mode of the AGN has a direct link with the emission line classification scheme introduced by Hine & Longair (1979), where radio galaxies are classified as either high-excitation (HEGs) or low-excitation (LEGs). By studying the host galaxies of radio-loud AGN spanning luminosities from the radio mode (typically lower radio luminosities) through to the quasar mode (typically higher radio luminosities) we should be able to place important constraints on the validity of the feedback mechanisms in the models of galaxy formation and evolution. Furthermore, radio galaxies reside in the most massive galaxies at all epochs (e.g. Jarvis et al. 2001; Willott et al. 2003) and as such allow us to trace the evolution of the most massive galaxies across virtually all of cosmic time.
One method of doing this is to study the evolution of the Fundamental Plane of radio galaxies. The concept of the Fundamental Plane (Djorgovski & Davis 1987; Dressler et al. 1987) describes the observation that a three-dimensional representation of versus versus (where is the effective radius, the velocity dispersion and the effective surface brightness of the galaxy) for local elliptical and lenticular galaxies yields a plane. The Fundamental Plane has a lower scatter than the Faber-Jackson - relation (Faber & Jackson 1976), and thus was initially of interest for its use as an alternative distance determination method. However, it was also realised that the fundamental plane scalings and small scatter were important for constraining models of elliptical galaxy formation. We may describe the fundamental plane as follows:
| (1) |
Use of the virial theorem with constant mass-to-light ratio permits us to reproduce this relation with coefficients of and (Faber et al. 1987). However, the observed fundamental plane does not follow this virial scaling. For example, Jørgensen, Franx & Kjærgaard (1996) find and . This “tilt” in the fundamental plane suggests that the mass-to-light ratio (M/L) varies as a function of galaxy mass (Robertson et al. 2006). Faber et al. (1987) also note that deviations from the fundamental plane can be caused by other changes in M/L, for example due to stellar metallicity or age, or the distribution of dark and baryonic matter. Robertson et al. (2006) comment that each of these effects could, in principle, introduce a systematic tilt into the fundamental plane if they vary as a function of galaxy mass. Jørgensen et al. (1996) also find that the slope of the Fundamental Plane is independent of cluster properties such as cluster velocity dispersion and gas temperature.
1.1 The Fundamental Plane of Radio Galaxies & AGN
Bettoni et al. (2001) collected photometric and dynamical data for 73 low redshift () radio galaxies from a variety of samples. They find that these local active galaxies lie on the same Fundamental Plane as the inactive population, with the implication that the gas accretion of the central black hole does not influence the global properties of early-type galaxies. Wolf & Sheinis (2008) investigate the location on the Fundamental Plane of ten nearby () luminous quasars. They find that the radio-loud objects in their sample fall on the upper extreme region of the Fundamental Plane and have host galaxy properties similar to those of giant early-type galaxies, whilst their radio-quiet objects are located in the region of the Fundamental Plane occupied by normal early-type galaxies and have host galaxy properties more similar to intermediate-mass galaxies.
1.2 Redshift Evolution of the Fundamental Plane
Work has also been undertaken to examine the redshift evolution of the Fundamental Plane. The intermediate redshift Fundamental Plane (-) for cluster (Dokkum & Franx 1996; Kelson et al. 2000) and field (Treu et al. 2001) early-type galaxies is found to be similar to that observed locally. Treu et al. (2001) find an offset (from the local relation) in their intermediate redshift Fundamental Plane of early-type field galaxies. This offset increases with redshift and is attributed to an increase in effective brightness of these galaxies with respect to a local sample. Woo et al. (2004) study the Fundamental Plane of the host galaxies of 15 AGN out to a redshift of . They find that the host galaxies of these intermediate redshift BL Lac objects and radio galaxies lie on the same Fundamental Plane as normal local early type galaxies and the local radio galaxy sample of Bettoni et al. (2001), although their higher redshift objects possess an offset in the same fashion as the one obeserved by Treu et al. (2001). Woo et al. (2004) also observe an increase in the mass-to-light ratio of their galaxies of 40% since , also in agreement with the findings for normal early-type galaxies.
At higher redshifts (-) various authors (di Serego Alighieri et al. 2005; Treu et al. 2005a; Jørgensen et al. 2006; Jørgensen et al. 2007; Fritz & Ziegler 2009; Fritz et al. 2009; Fritz, Jørgensen & Schiavon 2010) find not only an offset but also a rotation in the Fundamental Plane when compared to the local relation. For example, Jørgensen et al. (2007) find a slope described by and for galaxies in their two clusters whilst di Serego Alighieri et al. (2005) find a slope described by and for their early-type galaxies. The latter authors show at the 90% confidence level that the Fundamental Plane rotates with redshift. This is interpreted as a mass-dependent evolution of the mass-to-light ratio, where the evolution is faster for less massive galaxies. Fritz et al. (2010) study field-type early galaxies and demonstrate that the rotation of the Fundamental Plane appears to be independent of the environment of the galaxies. There is thus an emerging picture in which variation in the mass-to-light ratio causes a redshift-dependent offset in the Fundamental Plane (see also van Dokkum & Stanford 2003; van der Wel et al. 2005). This variation is mass-dependent, giving rise to the redshift-dependent rotation observed in the Fundamental Plane. In this picture it is galaxy mass, rather than environment, which plays the major role in determining galaxy evolution (Treu et al. 2005b), and less massive distant galaxies have much younger stellar populations than more massive galaxies [consistent with the downsizing scenario of Cowie et al. (1996) in which the most massive galaxies form earliest]. It should, however, be noted that there is not universal agreement on this picture: Gebhardt et al. (2003) study the Fundamental Plane of 36 field galaxies (21 early-type and 15 disc galaxies) in the redshift range 0.3-1.0 (with a median redshift ) and find no difference in the slope of the plane when compared to the local relation.
Robertson et al. (2006) employ a multiphase interstellar medium model to investigate the contribution made by various different factors to the tilt of the fundamental plane. They find that merging gas-rich disc galaxy models (with gas fractions ) including the effects of gas dissipation (cooling, star formation and supernova feedback) yields a scaling of the Fundamental Plane which is similar to the observed infrared Fundamental Plane of Pahre, Djorgovski & de Carvalho (1998). Changing the redshift of the progenitor galaxies within the range 0-6 has little effect on the plane produced. The inclusion of gas dissipation has the effect of decreasing the total-to-stellar mass ratio (/) in the central regions of the galaxies. This decrease varies as a function of galaxy mass (with a greater decrease in lower mass systems) thus producing the required tilt in the Fundamental Plane. Re-merging the remnants of these gas-rich galaxy mergers leaves the Fundamental Plane largely intact. Including the effects of feedback from accreting supermassive black holes in their models makes little difference to the Fundamental Plane inhabited by the merger remnants. However, use of these full-model simulations allow Robertson et al. (2005) to reproduce the power-law scaling of the - relation between and . The remnant remergers of Robertson et al. (2006) preserve the - relation (albeit with increased scatter).
1.3 The Fundamental Plane at
In this paper we present spectroscopic data for a sample of radio galaxies at . We use a direct spectral fitting procedure to obtain the velocity dispersions of our galaxies. The effective radii and surface brightnesses for our sample have already been determined and published (see McLure et al. 2004). Combining our velocity dispersion results with this data thus permits us to study the Fundamental Plane at and draw comparisons with the well documented local relation. Our results also allow us to investigate any possible correlation between the low-frequency radio luminosity at 151 MHz, , and the velocity dispersion. This enables us to investigate (via the - relation) the possible link between radio luminosity and black hole mass in radio-loud AGN (e.g. Nelson & Whittle 1996; McLure & Jarvis 2004; Jarvis & McLure 2006).
We begin in Section 2 of the paper by describing our sample, before detailing our observations and data reduction in Section 3. Section 4 describes our spectral fitting and aperture correction techniques, followed by a description of our Fundamental Plane fitting in Section 5. We present and discuss our findings in Section 6 before concluding in Section 7. Unless otherwise stated, throughout the paper we assume a standard cosmology in which = 70 km s-1, = 0.3 and = 0.7.
| Source | RA | Dec | z | Reduced | Telescope | ||||
|---|---|---|---|---|---|---|---|---|---|
| 3C16 | 00 37 45.39 | +13 20 09.6 | 0.405 | 26.82 | 22.9 | 21.75 | - | - | WHT |
| 3C19 | 00 40 55.01 | +33 10 07.3 | 0.482 | 26.96 | 30.9 | 21.86 | 1.16 | WHT | |
| 3C46 | 01 35 28.47 | +37 54 05.7 | 0.437 | 26.84 | 15.8 | 20.78 | 1.34 | WHT | |
| 3C172 | 07 02 08.32 | +25 13 53.9 | 0.519 | 27.17 | 12.6 | 20.65 | 1.10 | Gemini | |
| 3C200 | 08 27 25.38 | +29 18 45.5 | 0.458 | 26.92 | 13.2 | 20.15 | 1.39 | Gemini | |
| 3C244.1 | 10 33 33.97 | +58 14 35.8 | 0.428 | 27.10 | 15.8 | 20.76 | 1.31 | WHT | |
| 3C295 | 14 11 20.65 | +52 12 09.0 | 0.464 | 27.68 | 29.5 | 21.03 | 0.99 | Gemini | |
| 3C341 | 16 28 04.04 | +27 41 39.3 | 0.448 | 26.88 | 16.6 | 21.08 | 1.78 | WHT | |
| 3C427.1 | 21 04 07.07 | +76 33 10.8 | 0.572 | 27.53 | 18.2 | 20.68 | - | - | Gemini |
| 3C457 | 23 12 07.57 | +18 45 41.4 | 0.428 | 27.00 | 14.1 | 20.40 | - | - | WHT |
| 6C0825+3407 | 08 25 14.59 | +34 07 16.8 | 0.406 | 26.09 | 14.5 | 21.12 | - | - | WHT |
| 6C0850+3747 | 08 50 24.77 | +37 47 09.1 | 0.407 | 26.15 | 12.6 | 20.41 | - | - | WHT |
| 6C0857+3945 | 08 57 43.56 | +39 45 29.0 | 0.528 | 26.34 | 11.7 | 20.15 | 1.13 | Gemini | |
| 6C1303+3756 | 13 03 44.26 | +37 56 15.2 | 0.470 | 26.29 | 12.3 | 20.65 | 3.24 | Gemini | |
| 7C0213+3418 | 02 13 28.39 | +34 18 30.6 | 0.465 | 25.66 | 6.3 | 19.47 | 1.26 | WHT | |
| 7C0219+3423 | 02 19 37.83 | +34 23 11.2 | 0.595 | 25.98 | 10.9 | 20.45 | - | - | Gemini |
| 7C0810+2650 | 08 10 26.10 | +26 50 49.1 | 0.435 | 25.58 | 14.8 | 21.16 | 1.27 | WHT | |
| 7C1731+6638 | 17 31 43.84 | +66 38 56.7 | 0.562 | 25.52 | 6.0 | 20.47 | 1.12 | Gemini | |
| 7C1806+6831 | 18 06 50.16 | +68 31 41.9 | 0.580 | 26.36 | 14.8 | 20.54 | 1.15 | Gemini | |
| TOOT0009+3523 | 00 09 46.90 | +35 23 45.1 | 0.439 | 24.79 | 12.6 | 20.48 | 1.35 | WHT | |
| TOOT0018+3510 | 00 18 53.93 | +35 10 12.1 | 0.416 | 25.16 | 19.5 | 21.21 | 1.29 | WHT | |
| TOOT1626+4523 | 16 26 48.50 | +45 23 42.6 | 0.458 | 25.03 | 7.4 | 19.54 | 1.24 | WHT | |
| TOOT1630+4534 | 16 30 32.80 | +45 34 26.0 | 0.493 | 25.17 | 10.2 | 19.71 | 2.10 | WHT | |
| TOOT1648+5040 | 16 48 26.19 | +50 40 58.0 | 0.420 | 25.12 | 9.5 | 19.71 | 1.18 | WHT |
2 The Sample
Our full 41-object radio-galaxy sample (the ZP5 sample) consists of all of the narrow-line radio galaxies in the redshift interval from four complete, low-frequency selected radio surveys; 3CRR (Laing, Riley & Longair 1983), 6CE (Eales et al. 1997; Rawlings, Eales & Lacy 2001), 7CRS (Lacy et al. 1999; Willott et al. 2003) and TexOx-1000 (“TOOT”; Hill & Rawlings 2003; Vardoulaki et al. 2010). The choice of was motivated by several factors. In particular, a sample at provides a full three decades in radio luminosity (including some of the most radio luminous objects in existence). It therefore allows us to construct subsamples of objects, divided by radio luminosity, containing sufficient numbers of objects to investigate correlations of various properties with radio luminosity. In addition, the use of ensures that satisfactory data can be obtained (both Hubble Space Telescope imaging and spectroscopic data) without excessively long integration times. Full details of the sample can be found in McLure et al. (2004) and Herbert et al. (2010).
In this paper we use a 24-object subsample of the full ZP5 sample (see Section 3 and Table 1). Spectroscopic observations were made using the William Herschel Telescope (WHT) or the Gemini North telescope. Objects were chosen at random from the full sample, aside from the constraint of for objects observed with the WHT. In Figure 1 we show the radio luminosity-redshift plane for the ZP5 objects in this paper.

3 Observations and Data Reduction
3.1 WHT Spectroscopy
In August 2002 we used the ISIS spectrograph on the 4.2-metre William Herschel Telescope to obtain spectra for 15 of the objects in the full sample. The objects were chosen to have so that satisfactory signal to noise ratios could be obtained without excessively long integration times. This constraint aside, the objects were chosen at random from the objects in the full sample that were visible on the dates of observation. Details of the objects observed with the WHT can be found in Table 1. We used the R316R grating on the red arm together with a 1.0 arcsec slit resulting in a resolution of 3.7 Å FWHM. This corresponds to a velocity resolution of FWHM = 185 km s-1 at 6000Å which results in a minimum measurable velocity dispersion of km s-1. The central wavelength used was dependent on the redshift such that the spectra contain the Mg complex to determine the velocity dispersion. Each object was observed for a total integration time of 7200s, split into three 2400s observations to allow the removal of cosmic rays. The individual spectra were bias subtracted, illumination and flat-field corrected, and wavelength and flux-calibrated using standard IRAF routines. Coaddition was done using an average sigma-clipping routine and the galaxy was extracted using an aperture defined at the FWHM of the galaxy light profile and at full-width zero intensity to ensure both high signal-to-noise ratio in the former and total light spectra for the latter.
3.2 GMOS Spectroscopy
Between August 2008 and June 2009 we used the Gemini Multi-Object Spectrograph (GMOS) on the 8.1-metre Gemini North telescope to obtain spectra for nine of the objects in the full sample. Objects with were permitted and were chosen at random (given RA constraints) from the objects in the ZP5 sample left unobserved after the WHT observations. Details of the objects observed using Gemini can be found in Table 1. The B600_G5303 grating (and subsequently the new B600_G5307 grating) was used together with a 0.75 arcsec slit resulting in a spectral resolution of 4.0 Å FWHM. This corresponds to a velocity resolution of FWHM = 190 km s-1 at 6200Å which results in a minimum measureable velocity dispersion of km s-1. Within each observation block, two 600s observations were made with a central wavelength of 610nm, and a further two 600s observations were made using a central wavelength of 605nm. The use of two different central wavelengths allows us to cover the gaps between the CCDs. Each observation block was repeated four times per source. Thus each object was observed for 9600s in total. The GMOS spectra were reduced (bias subtraction, cosmic ray subtraction, flat field correction, wavelength calibration, sky subtraction, flux calibration and spectrum extraction) using the gmos tools in the gemini IRAF package.
4 Spectral Fitting
4.1 Our Fitting Procedure
In order to determine the velocity dispersion of each galaxy we perform a minimisation, fitting each galaxy spectrum to a set of templates. The template set comprises 23 Elodie stellar templates 111http://atlas.obs-hp.fr/elodie/ and (following Greene & Ho 2006) 34 G and K stars from the old open cluster M67 observed with SDSS. The templates are broadened using a series of Gaussians whose width depends on the velocity dispersion () and wavelength. We exclude from our fit regions of the galaxy spectra that feature emission lines ionised by the central engine, as well as skylines. The effect of broadening due to the instrumental resolution is accounted for in our fitting procedure, and the effect is typically within the uncertainties of our fitted velocity dispersions.
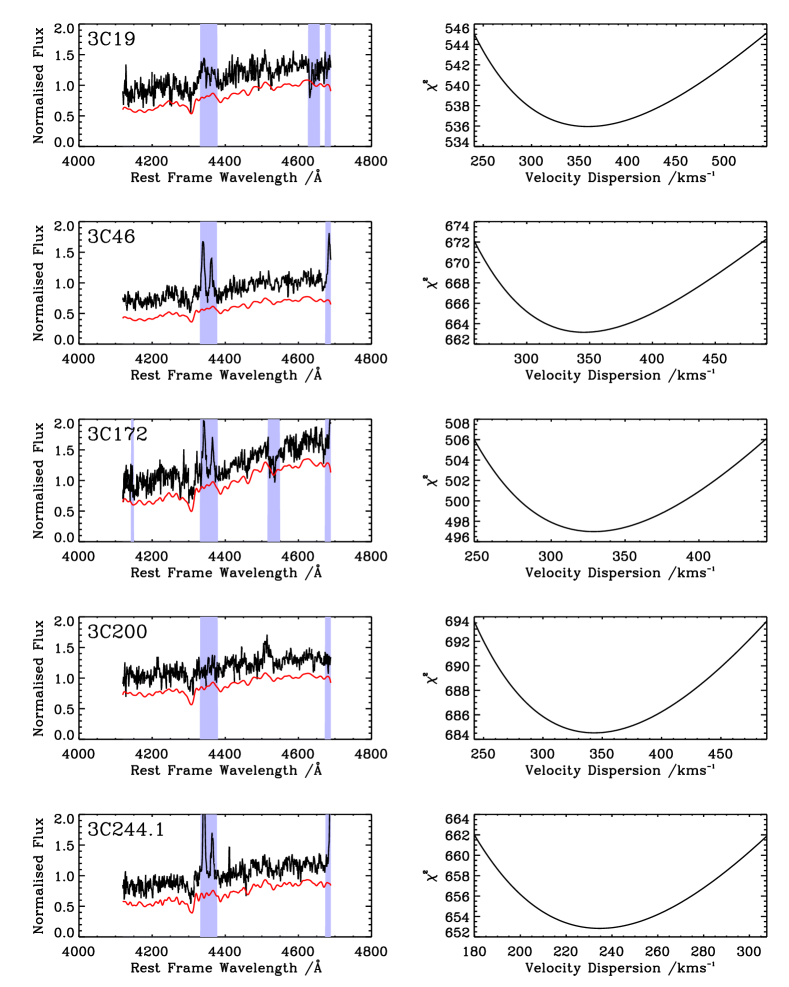
To implement our fitting we fit each galaxy in turn, using all 57 templates and with the velocity dispersion incrementing in steps of 1 km s-1. At each step we minimise the reduced of the fit using the Amoeba routine in IDL. We then inspect the resulting matrix of reduced values in order to find the minimum reduced and thus the best fitting template and velocity dispersion. Using simulated spectra generated from our stellar template library, we find that our minimum measureable velocity dispersion is 100 km s-1, well below the expected velocity dispersions of our radio galaxy hosts. We are unable to determine reliable measurements of the velocity dispersion for the cases where the mean signal-to-noise ratio per resolution element (measured between rest frame 4400Å and 4600Å where spectral features, in particular the Mgb complex, dominate the fitting) is less than 10. On this basis we exclude our fits to 3C16, 3C427.1, 6C0825+3407, 6C0850+3747 and 7C0219+3423. Since this is based merely on the quality of the data we do not expect this to introduce any notable selection effects. In addition, we are unable to obtain a sensible fit in the case of 3C457 due to a combination of the signal-to-noise ratio and emission lines from the AGN. Given that this is the only object lacking a fit due to the AGN, we are confident that this has a negligible effect on our results. Our final fits to the remaining objects are shown in Figure 2. Spectra for which we were unable to determine a reliable measurement of the velocity dispersion are shown in the Appendix.
An advantage of explicity looping over the velocity dispersion is that it allows us to obtain the standard errors on from the distribution. We convert the matrix (corresponding to the variation of with for the best-fitting template for each galaxy) into a probability distribution matrix and normalise. We then inspect the probability distribution function in order to determine the range in velocity dispersion which contains 68.27% of the probability distribution function and thus obtain the standard errors on . As a check we note that this procedure results in the same standard errors as produced by . We note that three objects (3C341, 6C1303+3756 and TOOT1630+4534) have reduced values . The errors on these objects are therefore undoubtedly underestimated (see Table 1).
![[Uncaptioned image]](/html/1008.2344/assets/x3.png)
Figure 2 continued.
![[Uncaptioned image]](/html/1008.2344/assets/x4.png)
Figure 2 continued.
![[Uncaptioned image]](/html/1008.2344/assets/x5.png)
Figure 2 continued.
4.2 Aperture Correction
The galaxies in our sample are smaller on the sky than those of a local sample. Consequently the aperture size for our sample is of order 20 times greater than the aperture size for a local sample. This has the effect of including more of the galaxy in the slit, resulting in a lower determined velocity dispersion than would be the case for a local sample. Therefore, in order to be able to compare our results with existing results for local samples we perform an aperture correction on our derived velocity dispersion values and their errors. We perform the aperture correction using the procedure described by Jørgensen, Franx & Kjærgaard (1995), where our values of are corrected to a circular aperture with an aperture diameter of kpc (equivalent to 3.4 arcsec projected onto a galaxy in the Coma cluster). The average correction is 7.1%.
Our derived velocity dispersion values, including aperture correction, can be found in Table 1. Table 1 also contains the McLure et al. (2004) values for the major-axis effective radii, , and the mean R-band surface brightnesses within , , of the galaxies in the sample. The values of have been corrected for passive evolution as described in McLure et al. (2004).
5 Fundamental Plane Fitting
5.1 Initial Plane Fitting
In order to fit a plane to our data we adopt the formulation of the fundamental plane used by Robertson et al. (2006), namely
| (2) |
where is the effective radius and the velocity dispersion as before. is the mean surface brightness within , in units of /pc2, and is related to our previous quantity :
| (3) |
where for the R-band (see Jørgensen et al. 1996). In order to fit the fundamental plane we rewrite Equation 2 in the following form:
| (4) |
where is a constant. For a plane described by Equation 4 using coordinates the residual of point perpendicular to the plane is given by:
| (5) |
where
| (6) |
We note that 12 of our 18 fitted objects have symmetric errors on . To fit a plane we therefore initially adopt symmetric errors in , , and . For the six sources which do not have a symmetric error on we use the mean of and , where and correspond to the upper and lower errors on listed in Table 1. The values of and taken from McLure et al. (2004) and used here have linear errors of 10%. We use the same procedure as above to estimate symmetric errors in log space for these quantities. In order to fit a plane to our results we use a technique similar to the one used by di Serego Alighieri et al. (2005), where we use a finely sampled grid over , and . At each point we use Equations 5 and 6 to calculate the residual perpendicular to the plane of each of our objects. We use our symmetric errors in log space in order to determine the error on each residual. We define a statistic thus:
| (7) |
where the summation is over the objects we are fitting the plane to, is the residual of object perpendicular to the plane, and is the standard error on the residual. Finally we find the values of , and which minimise this statistic and thus determine the best fitting plane. Our best fit fundamental plane can be found in Table 2.
| Symmetric log errors | |||
|---|---|---|---|
| MC, squared residuals | |||
| MC, weighted | |||
| Squared residuals | |||
| Absolute residuals |
Jørgensen et al. (1996) and Bettoni et al. (2001) fit a plane by minimising the sum of the absolute residuals. However, by using our -based technique, we can determine the standard errors on , and in a similar fashion to that employed in Section 4.1. We convert our three-dimensional matrix into a probability distribution matrix and normalise. We then determine the volume that contains 68.27% of the probability distribution function and from this the standard errors on , and . The reduced- also provides us with a measure of the goodness of our fit. Alongside these advantages we do, however, emphasize that this technique does not make use of the exact errors on , and and that small approximations are required. However, we show in Section 5.2 that the plane we obtain using this method is consistent with the plane produced using a method which involves no approximations.
5.2 Monte Carlo Simulations
In order to fit a plane (with errors) to our data, using the actual error distributions on , we employ a Monte Carlo technique. For each of our objects we randomly sample 12,000 values from each of the , and probability distribution functions (PDFs). We use sufficient samples to produce smooth final distributions in , and . The procedure outlined in section 4.1 provides the PDF. For each sample set we again grid over a range of , and and obtain the best fitting values of these parameters for 12,000 simulations by minimising the sum of the squared residuals according to equation 5. We obtain the standard errors by finding the range containing 68.27% of the PDF for each parameter. Table 2 lists our fitting results.
Next we repeat this procedure but rather than minimise just the sum of the square residuals, we minimise the sum of the square residuals weighted by the square of the error on the residual (where we estimate the residual error using the procedure described in Section 5.1). Finally, we fit a plane to the data by minimising the sum of the squared residuals, and another by minimising the sum of the absolute residuals (as per Jørgensen et al. 1996; Bettoni et al. 2001), but without any Monte Carlo sampling in either case. The results from all of these plane fittings can be found in Table 2, and in all cases our Fundamental Plane parameters are consistent.
5.3 Local Plane Fitting
In order to compare our plane with results for local active galaxies we use the data presented in Bettoni et al. (2001). This comprises both new data and data from the literature on their sample of low redshift radio galaxies. The median redshift of their sample is 0.03. We note that we use the same procedure as Bettoni et al. to apply the aperture corrections and thus our results can be compared directly. The first row of Table 3 contains the published plane fitting of Bettoni et al. (2001), converted from from their plane parameterisation to ours using Equation 3. The second row of Table 3 gives our fit to the data of Bettoni et al. (2001) using their fitting procedure (minimising the sum of the absolute residuals perpendicular to the plane). We exclude from our data set the objects 0053-016 and 0431-134 from Ledlow & Owen (1995), for which we have been unable to locate published redshifts.
| Published | |||
|---|---|---|---|
| Uncorrected absolute residuals | |||
| Absolute residuals | |||
| Squared residuals | |||
| Symmetric log errors |
In order to compare our plane fitting with the data of Bettoni et al. (2001) we correct the scalelengths in the data from their cosmology ( = 50 km s-1, = 1 and = 0) to ours. Once again we exclude the objects 0053-016 and 0431-134 from Ledlow & Owen (1995) due to the lack of redshift information. We fit the Fundamental Plane to the corrected data by minimising the sum of the absolute residuals and then repeat, this time minimising the sum of the squared residuals (see Table 3). Finally, we use the procedure described in Section 5.1 to fit the Fundamental Plane to the corrected data of Bettoni et al. (2001) using a fitting statistic, yielding uncertainties on the plane fitting as well as an indication of the goodness of fit. Uncertainties on have been published for the data presented by Bettoni et al. (2001) and Smith, Heckman & Illingworth (1990). For the remainder of the data we use a typical linear error of 10%. We also assume linear errors of 10% on and . The fitting results can be found in Table 3.
6 Discussion
6.1 The Local Fundamental Plane
In Figure 3 we show a two-dimensional projection of the Fundamental Plane that we fit to the cosmologically corrected data of Bettoni et al. (2001) using their fitting procedure (row three of Table 3). As well as showing the data of Bettoni et al. in this projection we also show our ZP5 objects with symbols corresponding to their radio luminosities. The y-axis uncertainties for the ZP5 objects were determined by assuming errors as in Section 5.1 and combining in quadrature according to the equation of the plane. It can be seen in Figure 3 that our objects with radio luminosity W Hz-1 sr-1 appear to lie on the local Fundamental Plane. The traditional division between lower radio luminosity Fanaroff-Riley type I (FRI) and higher radio luminosity Fanaroff-Riley type II (FRII) radio galaxies falls at W Hz-1 sr-1 (Fanaroff & Riley 1974), and this is also where there appears to be a difference in the evolution (Clewley & Jarvis 2004; Sadler et al. 2007), and thus these objects are probably FRI type radio galaxies, although some overlap in the populations is inevitable (see Herbert et al. 2010). We note that the majority of the sample of Bettoni et al. (90% of the objects which have published radio luminosities) also have W Hz-1 sr-1 and are thus classified as FRI type radio galaxies. We therefore find evidence that the FRI type objects in our sample can inhabit the local Fundamental Plane of similar objects simply by passively evolving from to the present day.

Many of the remaining (FRII type, W Hz-1 sr-1) objects also lie close to the plane and within the scatter displayed by the data of Bettoni et al. (2001). However, we note that our FRII type radio galaxies exhibit a tendency to lie above the local Fundamental Plane, some by a reasonable distance (although there are also objects lying a reasonable distance below the plane). Passive evolution is not sufficient to explain how these objects would move from their position at onto the Fundamental Plane. The FRII type objects of Bettoni et al. are consistent with the plane occupied by the rest of the sample, although there are insufficient objects with high radio luminosity to study this properly. Therefore, in contrast to our FRI type objects, we find evidence that the host galaxies of our FRII type objects must undergo evolution above and beyond their passive evolution to move them onto the local Fundamental Plane (Section 6.3). We find no clear correlation within the FRII type group between radio luminosity and the offset from the local Fundamental Plane, suggesting that this is indeed an evolutionary effect (rather than one related to the radio luminosity).
We also study the offsets of our ZP5 objects from the local Fundamental Plane of Figure 3 as a function of radio morphology and spectral classification. Details of our classification schemes can be found in Herbert et al. (2010). We find that those objects with large offsets are predominantly ‘Classical Double’ (FRII) HEG sources, consistent with the above result based on radio luminosity and with a similar strength of trend. It is also worth emphasizing that we find no link between disturbed morphology from a recent merger (see McLure et al. 2004) and the size of the offset.
6.2 The ZP5 Fundamental Plane

In Figure 4 we show a two-dimensional projection of the Fundamental Plane fitting the ZP5 data assuming symmetric errors in log space (row one of Table 2). It is apparent that our ZP5 objects do inhabit a Fundamental Plane, which is common to both the FRI type and the FRII type objects in our sample.
The reduced- of the ZP5 plane fitting shown in Figure 4 is 2.9 (tabulated, along with other reduced- values, in Table 4). The reduced- obtained when we compare the ZP5 data to the local Fundamental Plane of Figure 3 (, , ) is 10.2 (whereas comparing this local plane to the data of Bettoni et al. 2001 yields a reduced- of 3.4). For comparison we also fit a plane to our ZP5 data that follows the Kormendy ( - ) relation (Kormendy 1977) by setting and fitting for and . Our best fit in this case (, ) has a reduced- of 5.1. We find that our ZP5 fit is a noticeably better fit to the ZP5 data than the local Fundamental Plane is. It is interesting to note from row one of Table 2 and row three of Table 3 that this ZP5 fit is significantly different from the fit to the local data. The most prominent difference between the local Fundamental Plane and the Fundamental Plane is that the exponent is much smaller for the plane. That is to say, the power law index that relates the effective radius and the surface brightness to the velocity dispersion is far smaller at than in the local universe. The velocity dispersion is related to the mass () of the galaxy, and thus we infer that at the mass and size of these powerful radio galaxies are less closely related than in the local universe. However, despite the smaller exponent in our ZP5 relation, a comparison of the the reduced- values for our normal ZP5 fit and our Kormendy fit suggests that our Fundamental Plane is indeed a plane involving rather than merely a - relation; a fit with is noticeably worse than one where a dependence on is allowed.
Inspecting Figure 4 we find that, whilst the objects of Bettoni et al. are offset with regard to the ZP5 Fundamental Plane, there nevertheless appears to be a good agreement between the two data sets. We therefore perform a plane fitting (assuming symmetric errors in log space) to the two data sets combined. However, the resulting plane (, , ) yields reduced- values of 4.8, 6.1 and 3.5 when compared to the combined data, the ZP5 data and the data of Bettoni et al. respectively. We therefore find that a plane fitted to the combined data is not acceptable.
In Section 4.1 we noted that the errors on for some of our objects are undoubtedly underestimated. This contributes in part to the large reduced- values of the fits. In order to test whether these underestimated errors are leading us to reject acceptable plane fittings we repeat our fittings and comparisons, but requiring a minimum error of 15% on , , and . The reduced- values we obtain from comparing the data to the various plane fittings are shown in Table 5. We find, with a reduced- of 1.3, that the local plane (Figure 3) is an acceptable fit to the data of Bettoni et al.. We also find that the ZP5 plane (Figure 4) is an acceptable fit to the ZP5 data (reduced- of 1.2). However, we find that the local plane is not an acceptable fit to the ZP5 data (with a reduced- of 3.5), and nor is the ZP5 plane an acceptable fit to the local data (with a reduced- of 2.4). Finally, a plane fitted to the two data sets combined is also still rejected (reduced- values of 1.9, 2.6 and 1.3 when compared to the combined data, the ZP5 data and the data of Bettoni et al. respectively).
Taken altogether, our results therefore suggest that radio galaxies with lower and higher radio luminosities may share the same Fundamental Plane, but that there is substantial evolution in this plane between and .
| Data of Bettoni et al. | ZP5 Data | |
|---|---|---|
| Local Plane | 3.4 | 10.2 |
| ZP5 Plane | 5.4 | 2.9 |
| Size-evolved ZP5 Plane | 4.8 | 2.9 |
| Data of Bettoni et al. | ZP5 Data | |
|---|---|---|
| Local Plane | 1.3 | 3.5 |
| ZP5 Plane | 2.4 | 1.2 |
| Size-evolved ZP5 Plane | 1.9 | 1.2 |
6.3 Evolution of the Host Galaxies?
One explanation for the difference between the local Fundamental Plane of Bettoni et al. (2001) and our Fundamental Plane is evolution of the host galaxies. We have already shown in Sections 6.1 and 6.2 that passive evolution is not sufficient to explain the difference between the planes, or at least for the high radio-luminosity population. Other possibilities include an evolution in the mass-to-light ratio or a size evolution of the host galaxies. We discuss each of these in turn.
Various authors have found evidence for a mass-dependent evolution of the mass-to-light ratio (Section 1.2), and this in principle could explain the observed rotation between our ZP5 Fundamental Plane and the local one. We use our two plane fittings (row one of Table 2 and row three of Table 3) to calculate the mass-dependent evolution of the mass-to-light ratio that would be required to transform our plane into the local one (assuming and remain constant and expressing in terms of and ). However, we find an implausibly large dependence on the luminosity would be required (greater than 10 orders of magnitude, with a correspondingly small dependence on the mass), and we therefore discount the possibility that this, by itself, could explain the difference between the two planes.
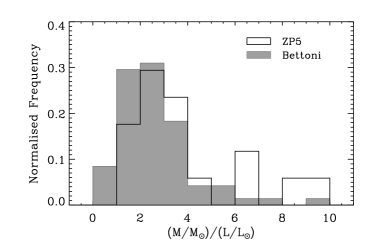
In Figure 5 we show histograms of the mass-to-light ratio distributions for the ZP5 and Bettoni samples. A two-dimensional K-S test on the two distributions rejects at the 96% level the null hypothesis that the samples are drawn from the same distribution. We therefore find tentative evidence of an evolution in the mass-to-light ratio which, whilst not explaining the observed rotation between the and the planes by itself, may make some contribution to the tilt. Considering only the FRII type objects in our sample we reject the null hypothesis that this sample and that of Bettoni et al. are drawn from the same distribution at the 98% level. However, we find no clear evidence that the distribution of mass-to-light ratios is different for our FRI type objects and the sample of Bettoni et al. (rejecting the null hypothesis at only the 86% level), consistent with these objects lying on the local Fundamental Plane of Figure 3.
We next turn to consider the possibility of size evolution of the host galaxies. There exists evidence for the growth of early-type galaxies from higher redshifts to the present day: for example, the observational work of van der Wel et al. (2008) and the model of Hopkins et al. (2010), but see Mancini et al. (2010). We use the size evolution model of van der Wel et al. (2009), where mergers cause the mass and effective radius to increase by the same factor. Thus remains constant (since ), along with the mass-to-light ratio, whilst and vary. We characterise the size evolution using a factor where . We investigate what value of gives the smallest offset between the ZP5 plane and the local data by varying (and adjusting and accordingly), refitting a plane using the procedure described in Section 5.1, and minimising the reduced- of the fit of the local data of Bettoni et al. (2001) to this plane. For each value of we adjust the amount of passive evolution such that our ZP5 objects still satisfy the Kormendy relation of the bottom panel of figure 5 in McLure et al. (2004). We note that using the same factor for all galaxies simply produces a uniform translation of the objects with respect to the and axes and thus affects the offset but not the slope of the corresponding ZP5 plane. However, for each value of we re-fit a plane (rather than simply adjust the plane parameter) in order to account for the uncertainties in the and plane parameters. The best fit is obtained with (although the reduced- is fairly constant between 0.3 and 0.6) and is shown in Figure 6. This is in contrast to a value of 0.91 expected from the model of van der Wel et al. (where we consider only the effects of mergers and exclude the effects of late-type galaxies turning into early-types) but the upper end of our range is in good agreement with the model of Khochfar & Silk (2006) who predict a value of – for the most massive galaxies. The size evolution implied by would result in a mean scalelength for our objects of 37.7 kpc. This is similar to the size of Brightest Cluster Galaxies (BCGs) in the local universe (Graham et al. 1996; McLure et al. 2004), which suggests that the host galaxies of powerful radio galaxies may evolve into BCGs.

However, as discussed above, whilst applying a uniform size evolution factor to our ZP5 objects can reduce the offset to the local galaxies, it does not affect the rotation. This is seen in Figure 6 where the tilt of the plane is still not consistent with the local data of Bettoni et al. (2001). Indeed, whilst the reduced- obtained by comparing the size-evolved ZP5 data to the plane of Figure 6 is 2.9 (Table 4), or 1.2 when we use errors , when we compare the data of Bettoni et al. to this plane the reduced- is 4.8 (or 1.9 with errors). Similarly, fitting a plane to the combined data of Bettoni et al. and the size-evolved ZP5 data yields a plane (, , ) whose reduced- values are 4.5, 5.3 and 3.4 when compared to the combined data, the ZP5 data and the data of Bettoni et al. respectively. Using errors these values reduce to 1.8, 2.3 and 1.3 respectively. We therefore find that size evolution of the host galaxies by a uniform factor is not sufficient, in and of itself, to explain the difference between the and the Fundamental Planes, since it doesn’t address the difference in rotation between these two planes.
In order for the tilt to be explained by size evolution we would require a mass (and size) dependent evolution of the host galaxies. Once more comparing the ZP5 plane fitting in row one of Table 2 with the local fitting in row three of Table 3, and taking (as defined above) to be a function of mass, we find (neglecting any other forms of evolution). This seems more plausible than the mass-dependent mass-to-light ratio evolution, although the actual evolutionary factors required for our objects (0.09–86.7, calculated using the same method) are not. A mass-dependent size evolution could be driven by environmental effects (where the most massive galaxies are found only in virialized clusters where mergers are suppressed), which we will investigate (Herbert et al., in preparation) using deep multi-band imaging data.
We therefore find that, whilst a mass-dependent size evolution may be the dominant effect behind the evolution of the Fundamental Plane, it is not sufficient in and of itself to explain the observed rotation between the and planes. We suggest that size evolution may combine with passive evolution and a mass-dependent evolution of the mass-to-light ratio to produce the observed rotation.
6.4 A Link with Recent Star Formation?
We next consider the possibility that our powerful ZP5 radio galaxies already inhabit the local Fundamental Plane, but that the effects of recent star formation make them appear to lie off it. In other words, is it possible that our objects that lie below the local Fundamental Plane could have a bright extended disc of recent star formation that would increase the observed effective radius? Conversely, is it possible that our objects that lie above the local plane could have a bright nucleocentric region of recent star formation that would decrease the observed effective radius? If the star formation terminates by then the observed effective radius would be altered in both cases, possibly moving the objects back on to the local relation.
We test this hypothesis using the strength of the 4000 break for our objects; the Dn(4000) indices (taken from Herbert et al. 2010) can be used as a measure of recent star formation, where younger populations have smaller 4000 breaks, as discussed in Herbert et al. (2010). In Figure 7 we show the residual perpendicular to the plane of Figure 3 versus Dn(4000) for the ZP5 objects. We see that those objects that fall significantly below the local Fundamental Plane, as well as the two furthest above it, all have lower Dn(4000) indices and thus younger stellar populations. This lends a degree of support to the recent star formation hypothesis, although we note that some of the objects that fall furthest from the plane have no evidence of recent star formation whilst some falling on or near the plane do have evidence for younger stellar populations.
In order to test the hypothesis further we extract the spectra for our objects using a range of apertures across the galaxy. We calculate Dn(4000) indices in each case and look for any trends between Dn(4000) and extraction radius for each object. However, we find no such trends within the uncertainties on Dn(4000) and the amount of possible contamination discussed in Herbert et al. (2010). We cannot therefore, with our current data, prove star formation in extended discs and nucleocentric regions as an explanation for why some of our objects lie away from the local Fundamental Plane.

6.5 Correlations with Radio Luminosity
Evidence of a correlation between black hole mass and radio luminosity was first presented by Franceschini, Vercellone & Fabian (1998), who showed that both the nuclear and the total radio fluxes of their sample of nearby radio galaxies displayed a remarkably tight dependence on black hole mass. This result has been confirmed by more recent work (e.g. McLure et al. 1999; Lacy et al. 2001; McLure & Jarvis 2004) whilst evidence has also emerged of a connection between black hole mass and radio loudness (e.g. Laor 2000; McLure & Dunlop 2001; McLure & Jarvis 2004), although other studies have found no evidence of such connections (e.g. Ho 2002; Woo & Urry 2002).
In order to investigate the possible link between radio luminosity and black hole mass for the objects in our sample we calculate the black hole mass from using the - relation for elliptical galaxies published by Gültekin et al. (2009) and propogate errors in the standard fashion by assuming symmetric errors on as above. It is important to note that, whilst the majority of the previous studies have used the high-frequency (5-GHz) radio luminosity, we use the extended low-frequency (151-MHz) radio luminosity. This may be significant, since the 151-MHz radio luminosity is closely connected with the time-averaged kinetic energy of the jets (e.g. Rawlings & Saunders 1991) and the effects of beaming are smaller on the 151-MHz radio luminosity than on the 5-GHz radio luminosity (e.g. Jarvis & McLure 2002).
In Figure 8 we show versus black hole mass. Figure 8 provides evidence in support of a link between radio luminosity and black hole mass: using the Spearman rank correlation coefficient we find a positive correlation between the radio luminosity and at a significance level of 97%. This is in good agreement with the - relation for the whole ZP5 sample found at a significance level of 97% by McLure et al. (2004) where the black hole masses were estimated via the - relation of McLure & Dunlop (2002). However, in contrast to McLure et al. (2004), who find that the significance of the correlation is increased to 99.5% by excluding the TOOT objects, we find that excluding the TOOT objects decreases the correlation significance to 84%. However, this could be purely due to the decrease in the number of objects we use for our analysis; 24 compared to the full sample of 41 used in the work of McLure et al. (2004). Additional spectroscopy on the remaining 27 radio galaxies would be needed to confirm this.
We also find a positive correlation between and (Figure 9). Applying the Spearman rank correlation coefficient yields a significance of 98%. It is interesting to note that the TOOT objects (triangles) — FRI type objects with W Hz-1 sr-1 — do not appear to follow this relation; for the TOOT objects appears to be largely independent of . This is consistent with our findings for the Fundamental Plane, where the low-luminosity radio sources are consistent with being able to passively evolve onto the local relation.


7 Conclusions
In this paper we have presented deep spectroscopic observations of 24 powerful radio galaxies at . We have used a direct fitting procedure to determine the velocity dispersions of our objects and combined these with the host galaxy data from McLure et al. (2004) to study the Fundamental Plane.
-
•
We have shown that the FRI type objects in our sample, once corrected for passive evolution, lie on the Fundamental Plane inhabited by the local radio galaxies of Bettoni et al. (2001). The FRII type objects in our sample do not lie on the local plane. However, whilst the majority of the sample of Bettoni et al. are lower radio luminosity (FRI type) objects, the FRII type objects in their sample are consistent with the local plane. Furthermore, our FRI type objects and our FRII type objects appear able to share the same plane at . We therefore suggest that radio galaxies with lower and higher radio luminosities may share the same Fundamental Plane, but that there is substantial evolution in this plane between and .
-
•
One explanation for the tilt observed between the and the Fundamental Planes is evolution of the host galaxies. We consider passive evolution, a mass-dependent evolution in the mass-to-light ratio and an evolution in the size of the host galaxy, but find that none of these effects can, by themselves, plausibly explain the observed rotation. We suggest, however, that some combination of all three effects, with size evolution as the dominant factor, may be sufficient to explain the difference between the planes. Indeed, indirect evidence for size evolution for the high-luminosity sources comes from the significant correlation (98%) between the effective radius and the radio luminosity for these sources, whereas the FRI sources do not appear to align with such a relation.
-
•
We also consider the possibility that our radio galaxies do, in fact, lie on the local Fundamental Plane (once passive evolution has been corrected for), but that a bright extended disc or nucleocentric region of recent star formation alters the observed effective radius, thus causing some of our objects to appear to lie off the local relation. Using the Dn(4000) index as an indicator of recent star formation, we see some hints that this may be having an effect, but the evidence is far from conclusive.
-
•
We find evidence at the 97% level of a correlation between galaxy velocity dispersion and the radio luminosity, suggesting that radio luminosity scales with black-hole mass. This is in line with previous work on this sample using the host galaxy luminosity as a proxy for black-hole mass (McLure et al. 2004). Unlike McLure et al., however, we do not find that this correlation becomes stronger in the absence of the low-luminosity (FRI-type) radio sources. We attribute this to the lack of objects in the present study (24) compared with the analysis of the full sample of 41 in McLure et al..
In future work (Herbert et al. in preparation) we will use deep multi-band imaging data to investigate the environments of the full sample and how they relate to the power of the AGNs and the masses and star formation histories of the host galaxies.
ACKNOWLEDGEMENTS
We thank the referee, Brant Robertson, for his useful comments. PDH thanks the UK STFC for a studentship. MJJ ackowledges the support of an RCUK fellowship. RJM and JSD acknowledge the support of the Royal Society through a University Research Fellowship and a Wolfson Research Merit award respectively. The William Herschel Telescope is operated on the island of La Palma by the Isaac Newton Group in the Spanish Observatorio del Roque de los Muchachos of the Instituto de Astrofisica de Canarias. Based on observations obtained at the Gemini Observatory (programs GN-2008B-Q-103 & GN-2009A-Q-105), which is operated by the Association of Universities for Research in Astronomy, Inc., under a cooperative agreement with the NSF on behalf of the Gemini partnership: the National Science Foundation (United States), the Science and Technology Facilities Council (United Kingdom), the National Research Council (Canada), CONICYT (Chile), the Australian Research Council (Australia), Ministério da Ciência e Tecnologia (Brazil) and Ministerio de Ciencia, Tecnología e Innovación Productiva (Argentina).
References
- [1] Balogh M. L., Morris S. L., Yee H. K. C., Carlberg R. G., Ellingson E., 1999, ApJ, 527, 54
- [2] Bettoni D., Falomo R., Fasano G., Govoni F., Salvo M., Scarpa R., 2001, A&A, 380, 471
- [3] Bettoni D., Falomo R., Parma P., de Ruiter H., Fanti R., 2009, A&A, 508, 1253
- [4] Clewley L., Jarvis M. J., 2004, MNRAS, 352, 909
- [5] Cowie L. L., Songaila A., Hu E. M., Cohen J. G., 1996, AJ, 112, 839
- [6] Croton D. J., Springel V., White S. D. M. et al., 2006, MNRAS, 365, 11
- [7] di Serego Alighieri S., Vernet J., Cimatti A. et al., 2005, A&A, 442, 125
- [8] Djorgovski S., Davis M., 1987, ApJ, 313, 59
- [9] Dressler A., Lynden-Bell D., Burstein D., Davies R., Faber S. M., Terlevich R., Wegner G., 1987, ApJ, 313, 42
- [10] Eales S., Rawlings S., Law-Green D., Cotter G., Lacy M., 1997, MNRAS, 291, 593
- [11] Faber S. M., Jackson R. E., 1976, ApJ, 204, 668
- [12] Faber S. M., Dressler A., Davies R. L., Burstein D., Lynden-Bell D., Terlevich R., Wegner G., 1987, in Faber S.M., ed., Nearly Normal Galaxies: From the Planck Time to the Present. Springer, New York, p. 175
- [13] Faber S. M., Tremaine S., Ajhar E. A. et al., 1997, AJ, 114, 1771
- [14] Fanaroff B. L., Riley J. M., 1974, MNRAS, 167, 31P
- [15] Ferrarese L., Merritt D., 2000, ApJ, 539, L9
- [16] Franceschini A., Vercellone S., Fabian A. C., 1998, MNRAS, 297, 817
- [17] Fritz A., Ziegler B. L., 2009, AN, 330, 1010
- [18] Fritz A., Jørgensen I., Schiavon R. P., Chiboucas K., 2009, AN, 330, 931
- [19] Fritz A., Jørgensen I., Schiavon R. P., 2010, preprint (astro-ph/1002.2205)
- [20] Gebhardt K., Bender R., Bower G. et al., 2000, ApJ, 539, L13
- [21] Gebhardt K., Faber S. M., Koo D. C. et al., 2003, ApJ, 597, 239
- [22] Graham A., Lauer T. R., Colless M., Postman M., 1996, ApJ, 465, 534
- [23] Greene J.E., Ho L.C., 2006, ApJ, 641, 117
- [24] Gültekin K., Richstone D. O., Gebhardt K. et al., 2009, ApJ, 698, 198
- [25] Hardcastle M. J., Evans D. A., Croston J. H., 2007, MNRAS, 376, 1849
- [26] Hardcastle M. J., Evans D. A., Croston J. H., 2009, MNRAS, 396, 1929
- [27] Herbert P. D., Jarvis M. J., Willott C. J., McLure R. J., Mitchell E., Rawlings S., Hill G. J., Dunlop J. S., MNRAS, in press
- [28] Hill G. J., Rawlings S., 2003, NewAR, 47, 373
- [29] Hine R. G., Longair M. S., 1979, MNRAS, 188, 111
- [30] Ho L. C., 2002, ApJ, 564, 120
- [31] Hopkins P. F., Bundy K., Hernquist L., Wuyts S., Cox T. J., 2010, MNRAS, 401, 1099
- [32] Jackson N., Rawlings S., 1997, MNRAS 286, 241
- [33] Jarvis M. J., McLure R. J., 2002, MNRAS, 336, L38
- [34] Jarvis M. J., McLure R. J., 2006, MNRAS, 369, 182
- [35] Jarvis M. J., Rawlings S., Eales S., Blundell K. M., Bunker A. J., Croft S., McLure R. J., Willott C. J., 2001, MNRAS, 326, 1585
- [36] Jørgensen I., Franx M., Kjærgaard P., 1995, MNRAS, 276, 1341
- [37] Jørgensen I., Franx M., Kjærgaard P., 1996, MNRAS, 280, 167
- [38] Jørgensen I., Chiboucas K., Flint K., Bergmann M., Barr J., Davies R., 2006, ApJ, 639, L9
- [39] Jørgensen I., Chiboucas K., Flint K., Bergmann M., Barr J., Davies R., 2007, ApJ, 654, L179
- [40] Kelson D. D., Illingworth G. D., van Dokkum P. G., Franx M., 2000, ApJ, 531, 184
- [41] Khochfar S., Silk J., 2006, ApJ, 648, L21
- [42] Laor A., 2000, ApJ, 543, L111
- [43] Lacy M., Rawlings S., Hill G. J., Bunker A. J., Ridgway S. E., Stern D., 1999, MNRAS, 308, 1096
- [44] Lacy M., Laurent-Muehleisen S. A., Ridgway S. E., Becker R. H., White R. L., 2001, ApJ, 551, L17
- [45] Laing R. A., Riley J. M., Longair M. S., 1983, MNRAS, 204, 151
- [46] Laing R. A., Jenkins C. R., Wall J. V., Unger S. W., 1994, in Bicknell G. V., Dopita M. A., Quinn P.J., eds, ASP Conf. Ser. Vol. 54, The Physics of Active Galaxies. Astron. Soc. Pac., San Francisco, p. 201
- [47] Ledlow M. J., Owen F. N., 1995, AJ, 110, 1959
- [48] Magorrian J., Tremaine S., Richstone D. et al., 1998, AJ, 115, 2285
- [49] Mancini C., Daddi E., Renzini A. et al., 2010, MNRAS, 401, 933
- [50] McLure R. J., Dunlop J. S., 2001, MNRAS, 327, 199
- [51] McLure R. J., Dunlop J. S., 2002, MNRAS, 331, 795
- [52] McLure R. J., Jarvis M. J., 2004, MNRAS, 353, L45
- [53] McLure R. J., Kukula M. J., Dunlop J. S., Baum S. A., O’Dea C. P., Hughes D. H., 1999, MNRAS, 308, 377
- [54] McLure R. J., Willott C. J., Jarvis M. J., Rawlings S., Hill G. J., Mitchell E., Dunlop J. S., Wold M., 2004, MNRAS, 351, 347
- [55] Merritt D., Ferrarese L., 2001, ApJ, 547, 140
- [56] Nelson C. H., Whittle M., 1996, ApJ, 465, 96
- [57] Pahre M. A., Djorgovski S. G., de Carvalho R. R., 1998, AJ, 116, 1591
- [58] Rawlings S., Saunders R., 1991, Nature, 349, 138
- [59] Rawlings S., Eales S., Lacy M., 2001, MNRAS, 322, 523
- [60] Robertson B., Bullock J. S., Cox T. J., Di Matteo T., Hernquist L., Springel V., Yoshida N., 2006, ApJ, 645, 986
- [61] Robertson B., Cox T. J., Hernquist L., Franx M., Hopkins P. F., Martini P., Springel V., 2006, ApJ, 641, 21
- [62] Sadler E. M., Cannon R. D., Mauch T. et al., 2007, MNRAS, 381, 211
- [63] Sijacki D., Springel V., Di Matteo T., Hernquist L., 2007, MNRAS, 380, 877
- [64] Silk J., Rees M. J., 1998, A&A, 331, L1
- [65] Smith E. P., Heckman T. M., Illingworth G. D., 1990, ApJ, 356, 399
- [66] Treu T., Stiavelli M., Bertin G., Casertano S., Møller P., 2001, MNRAS, 326, 237
- [67] Treu T., Ellis R. S., Liao T.X. et al., 2005, ApJ, 633, 174
- [68] Treu T., Ellis R. S., Liao T. X., van Dokkum P. G., 2005b, ApJ, 622, L5
- [69] van der Wel A., Franx M., van Dokkum P. G., Rix H.-W., Illingworth G. D., Rosati P., 2005, ApJ, 631, 145
- [70] van der Wel A., Holden B. P., Zirm A. W., Franx M., Rettura A., Illingworth G. D., Ford H. C., 2008, ApJ, 688, 48
- [71] van der Wel A., Bell E. F., van den Bosch F. C., Gallazzi A., Rix H.-W., 2009, ApJ, 698, 1232
- [72] van Dokkum P. G., Franx M., 1996, MNRAS, 281, 985
- [73] van Dokkum P. G., Stanford S. A., 2003, ApJ, 585, 78
- [74] Vardoulaki E., Rawlings S., Hill G. J. et al., 2010, MNRAS, 401, 1709
- [75] Willott C. J., Rawlings S., Jarvis M. J., Blundell K. M., 2003, MNRAS, 339, 173
- [76] Wolf M. J., Sheinis A. I., 2008, AJ, 136, 1587
- [77] Woo J.-H., Urry C. M., 2002, ApJ, 579, 530
- [78] Woo J., Urry C. M., Lira P., van der Marel R. P., Maza J., 2004, ApJ, 617, 903
APPENDIX
In Figure 10 we show the spectra of the six objects for which we were unable to obtain a reliable measurement of the velocity dispersion (Section 4.1).
