Galaxy protocluster candidates at ††thanks: Based on observations obtained at the European Southern Observatory using the Very Large Telescope on Cerro Paranal through ESO programs 081.A-0673(A) and 083.A-0231(A).
We present a study of protoclusters associated with high redshift radio galaxies. We imaged MRC 1017-220 () and MRC 0156-252 () using the near-infrared wide-field () imager VLT/HAWK-I in the , and bands. We present the first deep -band galaxy number counts within a large area (200 arcmin2). We then develop a purely near-infrared colour selection technique to isolate galaxies at that may be associated with the two targets, dividing them into (i) red passively evolving or dusty star-forming galaxies or (ii) blue/star-formation dominated galaxies with little or no dust. Both targeted fields show an excess of star-forming galaxies with respect to control fields. No clear overdensity of red galaxies is detected in the surroundings of MRC 1017-220 although the spatial distribution of the red galaxies resembles a filament-like structure within which the radio galaxy is embedded. In contrast, a significant overdensity of red galaxies is detected in the field of MRC 0156-252, ranging from a factor of times the field density at large scales ( Mpc, angular distance) up to a factor of times the field density within a Mpc radius of the radio galaxy. Half of these red galaxies have colours consistent with red sequence models at , with a large fraction being bright (, i.e. massive). In addition, we also find a small group of galaxies within 5″ of MRC 0156-252 suggesting that the radio galaxy has multiple companions within kpc. We conclude that the field of MRC0156-252 shows many remarkable similarities with the well-studied protocluster surrounding PKS1138-262 (=2.16) suggesting that MRC 0156-252 is associated with a galaxy protocluster at .
Key Words.:
large scale structure - galaxies: clusters: general - galaxies: evolution - galaxies: high redshift - galaxies: individuals (MRC 1017-220; MRC 0156-252)1 Introduction
It is well established that the evolution of galaxies strongly depends on environment. In the nearby Universe, the highest density regions (e.g., the cores of local galaxy clusters) are dominated by red, early-type galaxies with the fraction of blue galaxies with on-going star-formation significantly smaller than lower density regions (Dressler 1980; Tanaka et al. 2005; Postman et al. 2005; Balogh et al. 2007; Poggianti et al. 2009). The spectra of these red passively evolving galaxies show a characteristic break at — i.e., the light from old stellar populations is more prominent than that emitted by younger stars. These galaxies lie on a tight red sequence in colour-magnitude diagrams. Studies have shown that this red sequence is already well populated in clusters of galaxies out to high redshifts (; Stanford et al. 2005, 2006; Mei et al. 2006, 2009; Lidman et al. 2008; Kurk et al. 2009). To understand when this red sequence appeared, i.e., when the segregation between passive and star-forming galaxies occurred in clusters, one needs to study overdensities at higher redshifts.
However, the number of known galaxy clusters at high redshifts () is small. Indeed, searching for higher redshift clusters rapidly becomes challenging using classical detection methods such as using red-sequence algorithms aimed at identifying red galaxy overdensities (Gladders & Yee 2000; Andreon et al. 2008) or detecting the extended X-ray emission from the intracluster medium (Stanford et al. 2006; Rosati et al. 2004, 2009). Until recently, the two highest redshift clusters were discovered through X-rays: XMMXCS J2215.9-1738 at (with spectroscopically confirmed members within the cluster virial radius; Stanford et al. 2006; Hilton et al. 2007) and XMMU J2235.3-2557 at (with spectroscopically confirmed members; Rosati et al. 2009). Galaxies in the core of this second cluster already lie on a well defined and tight red sequence (Lidman et al. 2008). These X-ray selected clusters were however recently supersceded by the discovery of a galaxy cluster at , ClG J0218-0510, using photometric redshifts. It is located in the Subaru/XMM-Newton deep field and has confirmed members to date (Tanaka et al. 2010; Papovich et al. 2010).
One of the most efficient methods to search for galaxy clusters at even higher redshifts () is to look in the vicinity of high-redshift radio galaxies (HzRGs hereafter). These galaxies are among the most massive galaxies in the Universe (MM⊙; Rocca-Volmerange et al. 2004; Seymour et al. 2007) and are good tracers of high density regions in the early universe (see Miley & De Breuck 2008, for a review on HzRGs and their surroundings). Narrow line emitter surveys of HzRGs at show that they are often located in overdense regions, designated as ‘protoclusters’ that are likely to be the progenitors of the present day massive groups and clusters (Venemans et al. 2002, 2005, 2007; Pentericci et al. 2000; Kurk et al. 2004). The narrow line emitters are, however, only a low-mass subset of the general population of UV-selected, star-forming galaxies (Miley et al. 2004; Overzier et al. 2008) and likely do not represent the majority of the total stellar mass.
Studies have tried to identify more massive cluster galaxies associated with these radio-loud sources by looking for the red passively evolving galaxies that may be populating the cores of high redshift clusters. Best et al. (2003) observed, for example, the environment of powerful radio-loud sources at and found overdensities of red galaxies () on two scales around the AGN: a pronounced central peak (within kpc) and weaker excesses between and Mpc radius. More recently, Galametz et al. (2009) studied the environment of 7C 1756+6520, a radio galaxy at , and found an excess of red sources (passive, early-type galaxy candidates at ) within Mpc of the HzRG. A galaxy cluster associated with 7C 1756+6520 has since been spectroscopically confirmed (Galametz et al. 2010). At higher redshifts (), studies have searched for red evolved galaxies by bracketing the redshifted break with near-infrared filters. Kajisawa et al. (2006) explored the environments of six HzRGs at and isolated the evolved galaxy population at using purely near-infrared () colour cuts. Kodama et al. (2007) used the same near-infrared criteria to select protocluster member candidates in the field of HzRGs at (see also Zirm et al. 2008, for a near-infrared study of a forming red sequence in a protocluster at ). They both found that some of their targeted fields contained overdensities by a factor of compared to blank fields. Recent spectroscopic follow-up of these red sources has been conducted in a couple of these protocluster fields by Doherty et al. (2010). They confirm two red galaxies associated with PKS 1138-262 at , a dusty star-forming galaxy and an evolved galaxy with little ongoing star formation. These HzRG companions have an estimated mass of M⊙. Doherty et al. (2010) also confirm that a pure near-infrared criterion is efficient at selecting high redshift galaxies — e.g. % of their -selected galaxies with spectroscopic redshift fall at . However, the low success rate of their spectroscopic campaign confirms however the challenge in deriving redshifts for passively evolving galaxies whose spectra do not show prominent and easily identifiable emission lines.
Building on these previous studies of individual HzRG fields, we defined a first uniformly selected sample of the most powerful radio galaxies in the pivotal redshift range where we expect the cluster galaxies to start settling on the red sequence. Our method is to select potential cluster members (in particular, evolved passive galaxies) using near-infrared colour cuts. We observed our sample with the High Acuity Wide field K-band Imager (HAWK-I; Pirard et al. 2004; Casali et al. 2006; Kissler-Patig et al. 2008) on the Very Large Telescope (VLT) in 2008 and 2009 in a set of three filters ( or depending on the redshift of the targeted HzRG). This paper reports the results on our two lowest redshift targets. A companion paper presents results on the higher redshift targets (Hatch et al., 2010).
We design a news near-infrared criterion to isolate galaxies at . We apply this selection technique to study the galaxy population in the vicinity of the lowest redshift HzRGs of the HAWK-I sample: MRC 1017-220 () and MRC 0156-252 (). We first describe in §2 the multi-wavelength data available for the targets and four control fields (including two sub-fields of GOODS South). The extraction of the source catalogues and galaxy number counts are described in §3 and §4. Section 5 presents the colour-colour selection technique we developed to isolate cluster member candidates at . The properties of these cluster candidates, such as overdensities and spatial distribution are detailed in §6. Section 7 summarizes our results.
We assume a CDM cosmology with km s-1 Mpc-1, and . All magnitudes are expressed in the AB photometric system unless stated otherwise.
2 The data
2.1 The targets
We present a study of the two lowest redshifts targets of the HAWK-I sample: MRC 1017-220 and MRC 0156-252, observed with HAWK-I in the , and bands.
MRC 1017-220 (; R.A.: 10:19:49.05, Dec.: -22:19:58.03, J2000, W Hz-1) is our lowest redshift targeted HzRG. We note that this HzRG is a broad line radio galaxy (Kapahi et al. 1998) and is unresolved both in near-infrared and radio (Pentericci et al. 2001). Investigating extremely red objects (EROs; ) around high- AGN, Cimatti et al. (2000) found an excess of EROs in the close vicinity of MRC 1017-220 compared to the field.
2.2 Observations and data reduction
2.2.1 New VLT/HAWK-I data
| Field | R.A.a | Dec.a | Band | Exp.Time | Seeing | Limit |
|---|---|---|---|---|---|---|
| J2000 | J2000 | min | arcsec | () | ||
| MRC 1017-220 | 10:19:54.18 | -22:18:27.17 | () | |||
| () | ||||||
| () | ||||||
| MRC 0156-252 | 01:58:39.16 | -25:00:51.01 | () | |||
| () | ||||||
| () | ||||||
| CF1 | 11:39:59.66 | -11:24:29.50 | () | |||
| () | ||||||
| CF2 | 16:02:06.80 | -17:25:31.70 | () | |||
| () | ||||||
| () |
-
a
Coordinates are given at the center of the HAWK-I -band image.
The two HzRG fields were imaged between April 2008 and August 2009 in Service Mode with VLT/HAWK-I. HAWK-I is a wide-field imager on UT4 with a field of view of equipped with a mosaic of four Hawaii 2RG pixel detectors separated by a gap of . The pixel scale is . The field of MRC 1017-220 was observed in Spring 2008 for min in the band (Å), min in the band (Å) and min in the band (Å). MRC 0156-252 was also observed in the same set of filters: min in the band (Autumn 2008), min in the band and min in the band (August 2009). In order to avoid the gaps between the chips and to have a deeper coverage of the immediate surroundings of the HzRGs, MRC 1017-220 and MRC 0156-252 were placed near the center of one of the chips.
Two control fields (hereafter CF1 and CF2, respectively centered on R.A.: 11:39:59.66, Dec.: -11:24:29.5 and R.A.: 16:02:06.80, Dec.: -17:25:31.7) were also observed from May to September 2008 in the , and bands.
Part of each -band observation was observed in photometric sky conditions. A standard star, selected from the United Kingdom Infrared Telescope (UKIRT) faint standards list (Hawarden et al. 2001), was observed immediately after the science data to flux calibrate the -band image.
Between January and March 2008, the entrance window of HAWK-I suffered a degradation and, as a consequence, the shadow of the camera spider became visible on the data. The data thus contain the convolution of the spider shadow with the rotating pupil image, resulting in a cross pattern which repeats the spider symmetry in the background111See http://www.eso.org/observing/dfo/quality/HAWKI/Problems/ PupilGhosts.html and http://www.eso.org/sci/facilities/paranal/ instruments/hawki/doc/HAWKI-NEWS-2008-07-11.pdf for details on the HAWK-I entrance window problem. As advised by the HAWK-I User Support Team, we reduced the time for each sub-integration to attenuate the cross pattern. However, some HAWK-I data taken between April and August 2008 show an increase in the sky noise independently of the configuration of the observations and the cross pattern is therefore very hard to subtract (e.g., and -bands of CF1). During the data reduction phase, we optimized the subtraction of the cross pattern when removing the background. Unfortunately, the cross pattern in the -band of CF1 could not be properly subtracted and the image is unusable.
The data were reduced using the ESO/MVM (or ‘alambic’) reduction pipeline222http://archive.eso.org/cms/eso-data/data-packages/eso-mvm-software-package (Vandame 2004). The image processing followed standard near-infrared reduction steps : dark subtraction, division by normalized sky flats, subtraction of the background, fringing correction and harmonization of the four chip gains. A distortion correction was applied to each chip using stars from the USNO-B1.0 (Monet et al. 2003) catalogue. The images were finally stacked using the same astrometric catalogue (for full details on the pipeline, see Vandame 2004).
2.2.2 Photometric calibration
The and -bands were flux calibrated using the 2MASS point source catalogue (Skrutskie et al. 2006) for objects with (i.e. stars for MRC 1017-220, for MRC 0156-252, for CF1 and for CF2). 2MASS stars total magnitudes were estimated using SExtractor Kron aperture (MAG_AUTO parameter). The derived zeropoints are accurate to magnitudes. The and detection limits of our images, determined in randomly distributed diameter apertures, are reported in Table 1.
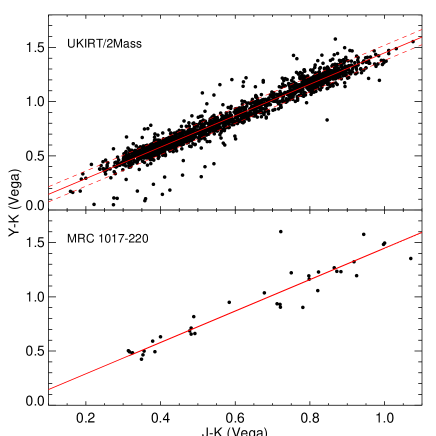
We derive the zeropoint of the -band using the standard stars observations and then refine it using empirically derived near-infrared colour relations for stars. Using the Wide Field Infrared Camera (WFCAM) Science Archive333http://surveys.roe.ac.uk/wsa/ which holds images and catalogues of the UKIRT Infrared Deep Sky Surveys (UKIDSS), we retrieve stars from a square degree region (centered around R.A.: 14:00:00, Dec.: 10:00:00) and match the -photometry of UKIDSS (data release 5) with 2MASS and -photometry. We extract stars with accurate photometry in , and (less than magnitude errors; stars). Fig. 1 (top panel) shows the location of these stars in a vs colour-colour diagram. Both UKIDSS and 2MASS use Vega photometric systems so Vega magnitudes are used in this analysis for consistency. The colour-colour relation for stars is well-fit by a simple linear function (standard deviation of ). We extract the 2MASS stars from the HzRGs fields and the two control fields and refine the zeropoints previously derived from the standard stars observations using the above colour-colour relation See the bottom panel of Fig. 1 for an example of the calibration method used for the MRC 1017-220 field. The offsets applied to the initial zeropoint are less than mag. We estimate an average mag uncertainty in the -band photometry of MRC 1017-220, CF1 and CF2 and mag for MRC 0156-252. This last field contains fewer stars and thus its photometry is slightly more uncertain. The and limiting magnitudes of the -band data (determined in random diameter apertures) are given in Table 1.
2.2.3 Archival GOODS-S data
The Southern field of the Great Observatories Origins Deep Survey (GOODS-S; Dickinson et al. 2003) was observed in , and using VLT/ISAAC from October 1999 to January 2007. The data were reduced with the ESO/MVM pipeline by the GOODS team (Retzlaff et al. 2010). The final data release, available since September 2007, includes ISAAC fields in and ISAAC fields in as well as the final and combined mosaics444The reduced single field images and final mosaics are publicly available at http://archive.eso.org/archive/adp/GOODS/ ISAAC_imaging_v2.0/goodsreq.html covering respectively and arcmin2.
The GOODS-MUlticolor Southern Infrared Catalog555Publicly available at http://lbc.mporzio.astro.it/goods/goods.php (GOODS-MUSIC; Grazian et al. 2006b; Santini et al. 2009) is a multiwavelength catalogue of GOODS-S, covering arcmin2 and cross-correlated optical (, , , , from Hubble/ACS and VLT/VIMOS), near-infrared (see above), mid-infrared (Spitzer/Irac [], [], [], [] and Spitzer/MIPS m). Spectroscopic redshifts are available for % of the sources. GOODS-MUSIC provides photometry for of the fields in and of the fields in . We make use of the GOODS-MUSIC photometry to calibrate the and GOODS-S mosaics. The and limiting magnitudes in random diameter aperture are () and () for and .
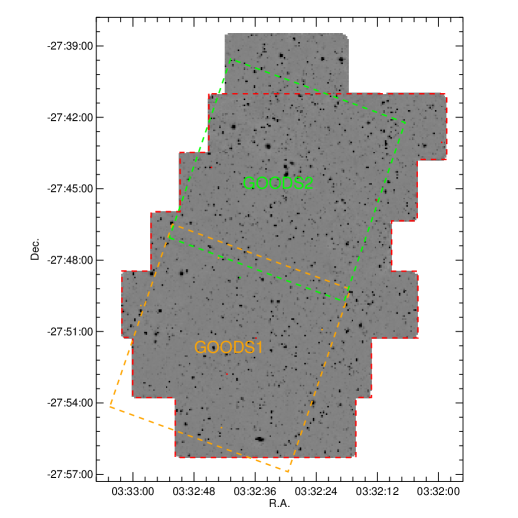
As part of the VLT/HAWK-I Science Verification programs, two sub-fields of GOODS-S were observed in in December 2007, centered respectively on R.A.: 03:32:40.92, Dec.: -27:51:41.6 ( min; PI: Fontana, A., GOODS1, hereafter) and R.A.: 03:32:29.71, Dec.: -27:44:38.6 ( min; PI: Venemans, B., GOODS2, hereafter). See also Castellano et al. (2010) for further details on the data. The seeing of these images is consistent with the one of the ISAAC and images i.e., . Fig. 2 shows the -band mosaic of GOODS-S with the -band (red) and the two -band fields, GOODS1 (orange) and GOODS2 (green) overlaid. We reduce the data using ESO/MVM pipeline. The images are astrometrically calibrated using a source catalogue extracted from the GOODS -band mosaic. To flux calibrate the images, we select all objects in the field classified as stellar in the NASA/IPAC Extragalactic Database (NED). Broad band photometry for these stars are taken from the Multiwavelength Survey by Yale-Chile (MUSYC) catalogues (Gawiser et al. 2006). The broadband SED of the stars are fit using stellar templates from the BPGS spectrophotometric atlas (Hewett et al. 2006). For each star, the best fitting SED provides the magnitude of the star and, combined with the flux measured in the image, a zeropoint. The image zeropoint is derived from the average of the individual zeropoints and has an uncertainty of 0.05 magnitudes. We also independently determine the -band zeropoint using 2MASS stars in the GOODS-S field ( stars) and the relation used for photometric calibration in §2.2.2 and find results consistent within mag. The -band () limiting magnitudes in random diameter aperture are () and () for GOODS1 and GOODS2 respectively.
3 Source extraction
HAWK-I data, especially those taken prior to May 2009, contain crosstalk between the amplifiers of the chips i.e., all the sources are repeated on some of the other amplifiers producing a series of crater-like artifacts arrayed horizontally (Finger et al. 2008). Due to its intensity, only crosstalk produced by the brightest objects is observed out of the background, e.g., in the image, all sources with . Regions affected by crosstalk were masked before extracting the source catalogues. Crosstalk is more prominent in the -band since the image is the deepest and stars are brighter in bluer bands. We therefore first identify by eye the crosstalk in the -band. A map is created to flag the crosstalk-affected pixels by squared masks. The flag area accounts for less than % of the final images for MRC 1017-220 and CF1 and less than % for GOODS-S. The CF2 field contains numerous bright stars and % of the final mosaic is flagged. We also flag regions affected by bright stars that dominate their surroundings as well as the noisy edges of the images.
The source detection was performed using SExtractor (Bertin & Arnouts 1996) with a detection threshold of independently for each filter. We used aperture magnitudes (SExtractor MAG_APER) within a fixed diameter aperture to measure colours. Based on the profile of stars in the -band data of the HzRGs fields, we estimate that an aperture of diameter contains about % of the source flux. Using such an aperture is therefore a good compromise between including as much flux from the source as possible, but limiting background contamination for faint objects. However, the fraction of a source flux contained in a aperture strongly depends on the seeing of the image and we smoothed the images of different bands to the same seeing to ensure accurate colour measurements.
The 3-band images of MRC 1017-220 and CF2 have significantly different seeings from filter to filter. We therefore smoothed our images to the worst seeing. The and -band images of the field of MRC 1017-220 were smoothed to the seeing of the -band. Similarly, the and -band images of CF2 were smoothed to the seeing of the -band. We detected the sources on the unsmoothed images and determined the aperture photometry on the smoothed images. We explain in §5.3 how we handle upper limits in colours. Total magnitudes are determined using SExtractor parameter MAG_AUTO on the original unsmoothed images.
All magnitudes were corrected for Galactic extinction (calculated for HAWK-I filters) using the dust maps of Schlegel et al. (1998) and assuming extinction law of Cardelli et al. (1989). All the fields are at high galactic latitude (). Corrections are small for the MRC 1017-220 field (, , mag in , and respectively), the MRC 0156-252 field (, , mag) and CF1 (, , mag). Due to a lot of dust along the line of sight, corrections for CF2 are, on the contrary, rather big (, , ). We do not apply the negligible ( in and for and ) extinction corrections for the GOODS-S field.
We evaluated the completeness limits of the images using a IRAF gallist and mkobjects routines (artdata package) to simulate artificial galaxies, both elliptical and spiral galaxies. We chose a uniform distribution of galaxy morphologies with a minimum galaxy axial ratio b/a of and a maximum half flux radius of . We adopted a de Vaucouleurs and an exponential disk surface brightness law for ellipticals and spirals respectively. For both types of galaxies, we generated catalogues of objects and added them to the , and images, including Poisson noise. We determined how many artificial sources were recovered using the same SExtractor configuration files used to detect the real sources. The % completeness limits for elliptical (spiral) galaxies are (), () and () in , and respectively for MRC 1017-220, (), () and () for MRC 0156-252.
4 Galaxy number counts in , and
| Mag. | 1017 | 0156 | CFs+GOODS-S | GOODS-S |
|---|---|---|---|---|
| (1) | (2) | (3) | (4) | (5) |
| 17.75 | 747 | 485 | 470 | - |
| 18.25 | 896 | 1213 | 759 | - |
| 18.75 | 1792 | 1940 | 1228 | - |
| 19.25 | 1792 | 3881 | 2131 | - |
| 19.75 | 3286 | 3759 | 3468 | - |
| 20.25 | 5377 | 6913 | 6141 | - |
| 20.75 | 8812 | 7276 | 9464 | - |
| 21.25 | 15682 | 13461 | 13293 | - |
| 21.75 | 18818 | 17585 | 18531 | - |
| 22.25 | 24494 | 26801 | 24816 | - |
| 22.75 | 33156 | 36746 | 36845 | - |
| 23.25 | 31066 | 47054 | 46742 | 44807 |
| 23.75 | 35397 | 58817 | 54652 | 54695 |
| 24.25 | - | 78948 | - | 74609 |
| 24.75 | - | - | - | 76683 |
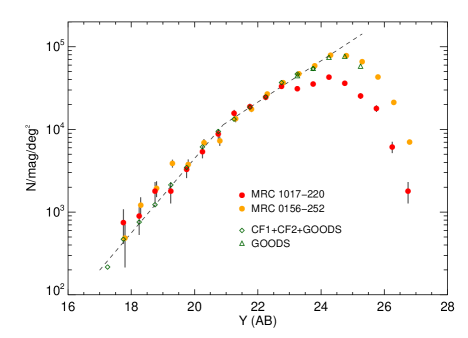
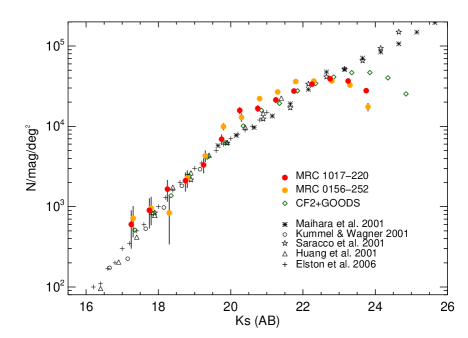
We derive the differential galaxy number counts in the HzRG fields for each band (see Fig. 3). We only consider the deepest regions of the final images, i.e., we discard the shallowest regions resulting from the gap between chips (central ‘cross’) as well as the edges of the image i.e. % of the images. We also derive the galaxy number counts combining the two control fields: CF1, CF2 and the GOODS-S data for the and bands. For the band, number counts are determined from CF2 and GOODS-S, since CF1 was not observed in . We separate galaxies from stars using the SExtractor CLASS_STAR parameter. We test the optimal values for this parameter for each image with stars from 2MASS and USNO in flux bins of mag (CLASS_STAR).
Table 2 reports (for the first time) the -band galaxy number counts. Counts for the two HzRGs fields (columns 2 and 3) are given to the % completeness limit. Due to the lower completeness limits of CF1 and CF2, we first derive counts for from the four fields (CF1+CF2+GOODS1+GOODS2) i.e., a total area of about arcmin2 (see Table 2, column 4). We also derive the counts for from GOODS-S only (column 5).
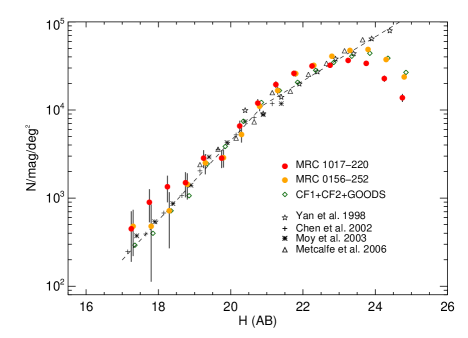
For the two other bands, we compare the galaxy counts with results from the literature: Yan et al. (1998); Chen et al. (2002); Moy et al. (2003); Metcalfe et al. (2006) for and Maihara et al. (2001); Kümmel & Wagner (2001); Saracco et al. (2001); Huang et al. (2001); Elston et al. (2006) for . No attempt is made to correct for the incompleteness, nor correct for differences of filter passbands (e.g., or ).
Number counts have been frequently used to test models of galaxy evolution. Although such an analysis is beyond the scope of this paper, we note however that the slope shown by the -band counts is consistent with the -band. Imai et al. (2007) fitted their -band counts (derived from the North Ecliptic Pole survey) by two power-laws of the form with a break in the slope at . Adopting a similar fitting function, we find that the -band counts are well fitted by two power-laws: ; for and ; for . These best-fit slopes are plotted in Fig.3 (top panel) and overplotted on the -band counts (middle panel) for comparison. The and -band counts are found to be consistent. Similarly to Imai et al. (2007), we note that the -band number counts show a less abrupt change of slope at and cannot easily be modeled by two power-laws.
As shown in Fig. 3 (top panel), the number counts of the HzRG fields are in good agreement with counts derived from the control fields. We note that there is a deficit of sources in the MRC 1017-220 field at , which cannot be explained by a lack of depth of the data since the 90% completeness limit is reached at mag. Interestingly, the galaxy counts of the targeted HzRG fields show an excess of galaxies in for where we find % (%) more sources in the field of MRC 1017-220 (MRC 0156-252) than our control fields (CF1+CF2+GOODS). Similar results are found in the -band number counts where an excess of sources with (%) is found in the field of MRC 0156-252 compared to our control fields (CF2+GOODS). An excess of sources with (%) is also seen in the field of MRC 1017-220. We do not observe such excesses in the -band (which is below the Å break at ). This suggests that both HzRG fields contain an excess of red galaxies.
5 Search for candidate cluster members at
5.1 colour selection of galaxies at
Colour criteria efficiently select high-redshift galaxies in a relatively narrow redshift range and permit to isolate potential cluster members associated with HzRGs. At high redshifts (), the position of the Å break in galaxies falls between the and -band. Pure near-infrared colours have thus been used to isolate candidate protocluster members at this redshift range, e.g. , designed by the FIRES team (Franx et al. 2003) which allows them to select Distant Red Galaxies (DRGs). However, these single colour cuts mostly pick out red passively evolving or dusty galaxies and miss galaxies with continuous star-formation with little or no dust.
Kajisawa et al. (2006) defined a two-colour selection technique that combined , and colours to select both red, passive and blue, star-forming galaxies at . This criterion ( & ; Vega system) is almost insensitive to dust extinction since the reddening vector () is parallel to the colour selection.
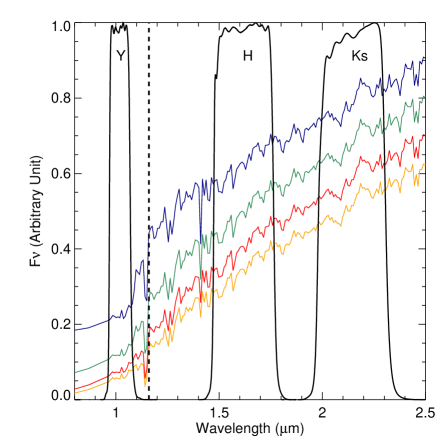
At the redshift of the targeted HzRGs, the Å break is between the and the -band. One can therefore use the -band instead of the -band in a similar method to Kajisawa et al. (2006) to search for cluster members around MRC 1017-220 and MRC 0156-252. We use Bruzual & Charlot (2003) models to determine the colours of different stellar populations at and . In the models, we assume a solar metallicity and a Chabrier (2003) initial mass function. Fig. 4 shows dust-free SED predictions for galaxies with an exponentially declining star formation history with to Gyr at . The HAWK-I transmission filters (black curves) and the position of the Å break at (dashed line) are also overlaid. We note that the and filters bracket restframe Å. The filter is narrow (width=m, about times narrower than and ). The colour is therefore very sensitive at selecting galaxies at the targeted redshifts.
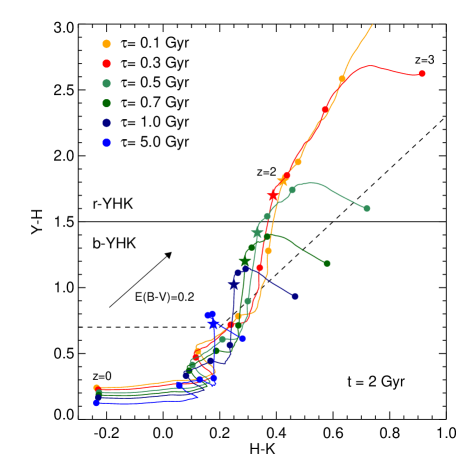
Fig. 5 shows the same Bruzual & Charlot (2003) SED models in a vs colour-colour diagram at various redshifts, with a constant population age of Gyr (top panel), or at various population ages ( to Gyr) at and (bottom panel). At , galaxies have consistently low colours (). Beyond , the colour becomes redder when the Å break enters the -band. The colour stays almost constant until when the Å break enters the band. By , the () colour becomes rapidly bluer (redder) than those of galaxies at . This general trend is observed for all models. However, the variations on both the and colours are more pronounced for galaxies with short declining star-formation histories i.e. those with stronger Å breaks. Galaxies with Gyr and have . Galaxies with longer star-formation histories never become so red.
We define a new colour criterion, analogous to the Kajisawa et al. (2006) two-colour selection technique, to select galaxies at (Fig. 5, dashed line):
| (1) |
A single-colour criterion is defined to separate red galaxies with old stellar population from blue star-forming galaxies:
| (2) |
similar to the single-colour criterion that selects DRGs at . This criterion is shown in Fig. 5 as the horizontal solid line. The cut at was optimized to isolate the reddest population of galaxies at . By analogy with Kodama et al. (2007) notations (r- and b-) for galaxies selected by the Kajisawa et al. (2006) near-infrared criteria, galaxies selected by equations (1)+(2) are referred to as r- galaxies and galaxies selected by equation (1) with are referred to as b- galaxies.
The criterion is insensitive to dust extinction since it has been defined parallel to the reddening vector (see Fig. 5; black arrow). However, the dusty star-forming galaxies at will have similar colours to non dusty, passively evolving galaxies, and will also be selected by the r- criterion. Our criterion therefore does not enable us to clearly distinguish the red passive galaxies from the dusty star-forming ones.
5.2 Reliability of the colour selection
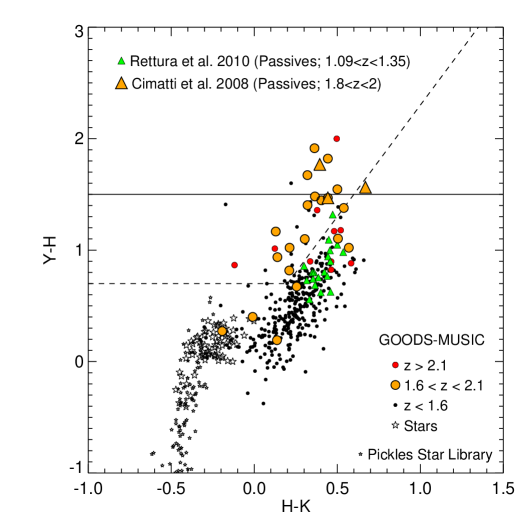
We examine the colours of galaxies in GOODS-S using the spectroscopic redshifts available in the GOODS-MUSIC catalogue (see §2.2.2) and combining the two archival -band (GOODS1 and GOODS2) images with the and GOODS-S mosaics. We select sources that have a reliable photometry in and (less than magnitude errors), are detected () in the two -band images, and have a reliable spectroscopic redshift (flag 0: very good or 1: good). Fig. 6 (top panel) shows the distribution of these sources in the colour-colour diagram i.e., stars (stars), galaxies at (black dots), galaxies with (orange circles) and galaxies with (red circles). AGN (defined as ‘BLAGN’ or ‘NLAGN’ in GOODS-MUSIC) are not considered here. We also overplot colours of stars from the digital stellar spectra library from Pickles (1998). We note that (%) galaxies at are selected by the criteria. The criterion efficiently removes foreground galaxies i.e., only (%) galaxies with are found in the -selected region. (%) of galaxies with are selected by the criterion indicating that the selection will be notably contaminated by background objects.
Rettura et al. (2010) present a sample of early-type galaxies with found in the GOODS-S field. of them are imaged and detected () in the band (see green triangles in Fig. 6) and have colours consistent with models predictions. Only one of them (the highest redshift source at ) is selected by the criterion showing that contamination by lower redshift passively evolving galaxies is very small.
Cimatti et al. (2008) studied a sample of old, passive galaxies at found in the northern part of GOODS-S covered by the Galaxy Mass Assembly ultra-deep Spectroscopic Survey (GMASS; Kurk et al. 2008). Ten of these objects have including three at . The seven others are part of an overdensity at presented in Kurk et al. (2009). The three passive galaxies at are well detected in (in the GOODS2 field), and (see orange triangles in Fig. 6, top panel). Two of them have . The third one is a b- galaxy, but has a red colour, close to the selection limit.
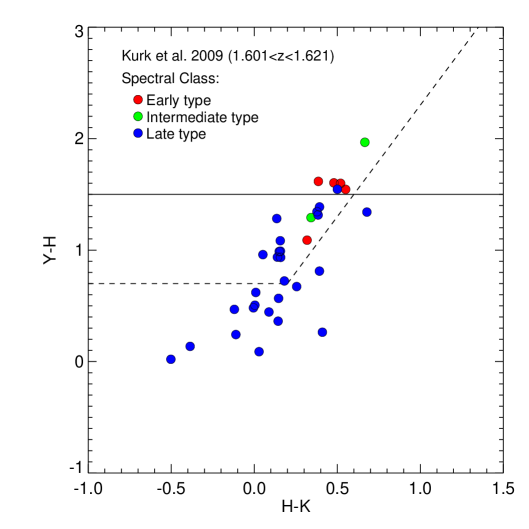
Kurk et al. (2009) discovered a galaxy overdensity at , with spectroscopically confirmed members in the GMASS area. Five galaxies have an early-type spectral class, two galaxies are at an intermediate stage (early-type but with sign of star formation; intermediate type, hereafter) and are late type galaxies. All members are detected in the GOODS2 -band. Eight late-type galaxies have magnitude errors larger than mag in either , or and will not be considered in our analysis. Fig. 6 (bottom panel) shows the colours of the remaining sources in the colour-colour diagram, the colours of the symbols indicating their spectral class.
The five early-type galaxies and the two ‘intermediate type’ galaxies are also reported in Cimatti et al. (2008) as passive galaxies. All seven sources are selected by the criterion. Four early-type and one ‘intermediate type’ are r- galaxies and the last two sources are b- galaxies. () of the late type galaxies are selected by the criterion showing its limitation at . We also note that the [OII]Å doublet falls in the -band at . If present, and has a large equivalent width, the emission line could bias the source -band magnitude and thus its colour, with the galaxy appearing bluer than expected. Since the majority (%) of the late-type galaxies from Kurk et al. (2009) shows the [OII] line in their spectra, this could explain the blue colours of some of them.
We further test the criterion using the photometric redshifts (; hereafter) available in the GOODS-MUSIC catalogue. Using the multiwavelength photometry of the GOODS-S field, Grazian et al. (2006b) applied a photometric redshift code to their catalogue. They tested their code with the available spectroscopic redshifts and found an accuracy of (Grazian et al. 2006a).
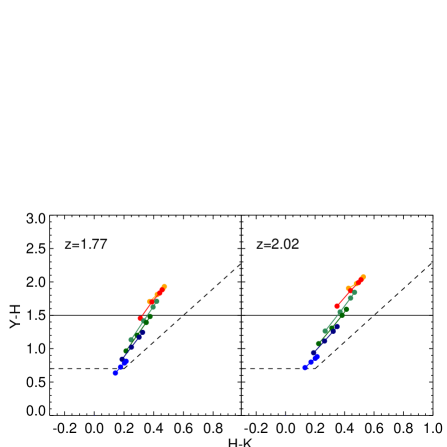
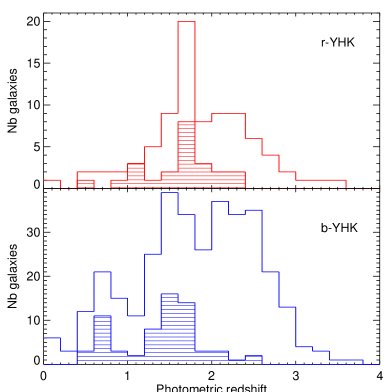
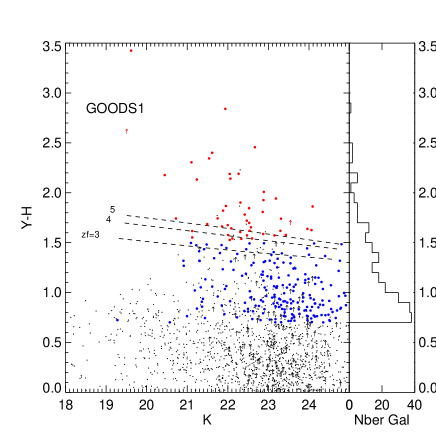
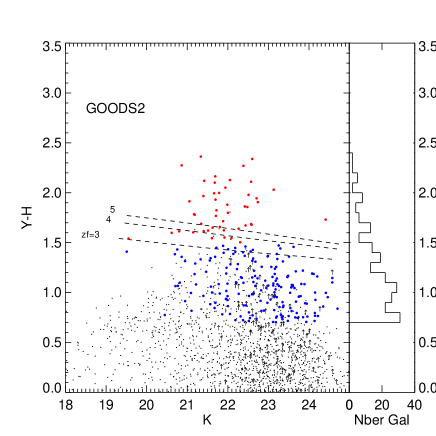
We examine the of the -selected galaxies within the detection limits as well as within the % completeness limits of the HAWK-I data i.e., the completeness of passive red ellipticals for the r- galaxies and the completeness of spiral galaxies for the b- galaxies. Fig. 7 shows the photometric redshift distribution of the r- galaxies (top panel) and the b- galaxies (bottom panel). We find that % (; % in the completeness limits) of the r- galaxies and % (%) of the b- have which confirms the efficiency of the selection criteria.
The r- criterion is efficient at selecting galaxies at the targeted redshifts with % (%) of the sources with . Within the limits of completeness, the b- criterion is also efficient with % of galaxies having . The photometric redshift distribution becomes much broader when considering fainter sources and extends towards higher redshift sources. At the limits, % of b- sources have . We note that if indeed an overdensity of red or blue galaxies is present in the surroundings of the HzRGs, the sample of -selected galaxies in these fields would contain a higher fraction of sources at the targeted redshifts. The percentages given earlier are therefore expected to be lower limits.
5.3 The -selected galaxies
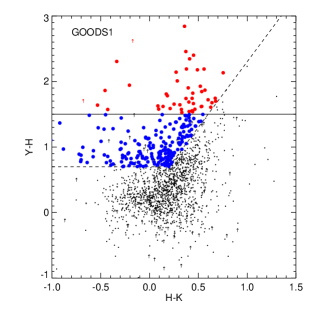
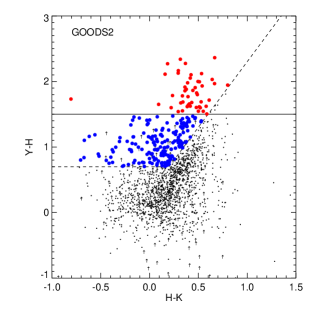
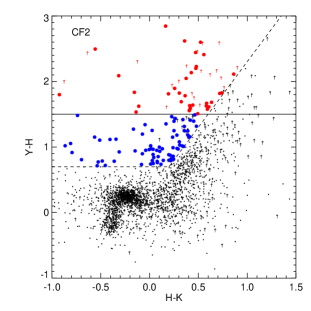
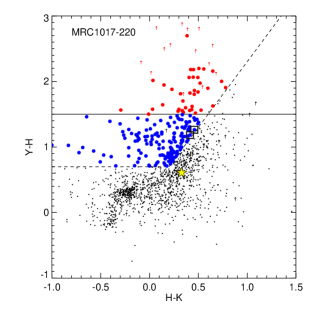
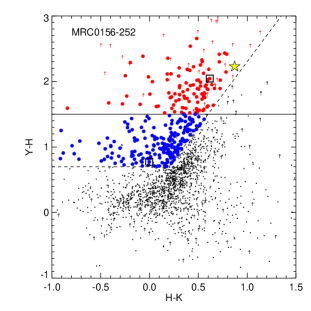
We apply the criteria to the five fields with coverage i.e., MRC 1017-220, MRC 0156-252, CF2, GOODS1 and GOODS2. We consider sources with a detection in all three bands. The vs colour-colour diagrams for the five fields are shown in Fig. 8. Red and blue circles indicate r- and b- galaxies respectively.
We overplot sources detected (within limits) in and but not in our -band catalogue. In order to place these sources in the colour-colour diagram, we assume a lower limit on the -band magnitude (see arrows, Fig. 8). We use SExtractor in dual mode using the source positions in the -band and deriving aperture photometry for these sources on the -band. For sources brighter that our detection limits but that were not part of our -band catalogue (i.e. beyond our completeness limits), we assign the -band photometry derived from the aperture placed at the -band source position. For fainter sources, we assign them the limits of our -band images. Sources with lower limits falling in the r- selection area of the colour-colour diagram are overplotted in red. These objects are particularly interesting since they have very red colours which suggests they have strong Å breaks.
Within our limits in , and , we find r- galaxies ( b- galaxies) in MRC 1017-220, () in MRC 0156-252, () in GOODS1, () in GOODS2 and () in CF2. We note that since the magnitude limits and area slightly vary from field to field, these numbers are not directly comparable to one another.
Cimatti et al. (2000) looked at the populations of EROs () in fields around radio-loud AGN at , including MRC 1017-220. An excess of EROs was found in the field of MRC 1017-220, with three EROs located within of the HzRG. Two of the three were observed in spectroscopy in the -band with VLT/ISAAC (Cimatti et al. 1999) and a ‘spectro-photometric’ redshift () was derived for both sources combining the ISAAC spectrum continuum and broad-band photometry. The two sources, J101948-2219.8 (R.A.: 10:19:47.79, Dec.: -22:19:46.6, , ) and J101950-2220.9 (R.A.: 10:19:49.76, Dec.: -22:20:53.9, , ), were both classified as early-type galaxies due to their SEDs consistent with no dust extinction. We look at the colours of these two objects (see black squares, Fig. 8, bottom left panel) and both are selected by the b- criterion. However, only deeper spectroscopy over a wider wavelength range will confirm whether those two targets have redshifts consistent with MRC 1017-220.
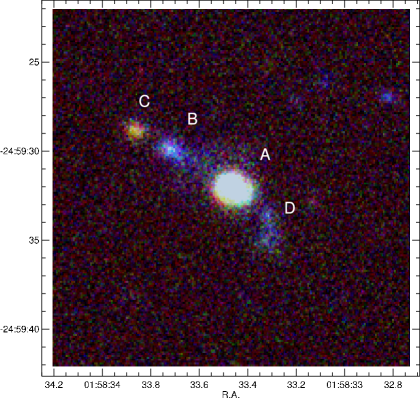
Pentericci et al. (2001) presented near-infrared NICMOS imaging of MRC 0156-252. They found two objects within of the radio galaxy, the three sources being aligned in the direction of the radio axis (i.e. NE/SW). Fig. 9 is a three-colour image of the close vicinity of MRC 0156-252. Three objects are observed near MRC 0156-252. We label the components using the same notation as Pentericci et al. (2001) (A for MRC 0156-252, B and C for the two eastern components), adding ‘D’ for the third faint source to the west of the HzRG. As previously noticed in Pentericci et al. (2001), component C is much redder than component B. C is a r- galaxy and B is a b- galaxy. B and C are indicated by black squares in Fig. 8, bottom right panel. D is detected but is very faint in ( level) and was therefore not considered in the candidate selection process. Spectroscopy is required to prove the association of these objects with the radio galaxy but their physical closeness and colours strongly suggest that they are associated with MRC 0156-252. The scale of this system is similar to the structure associated with PKS 1138-262 i.e., about (see Miley et al. 2006, Fig. 2).
6 Candidates properties
6.1 Surface densities of -selected galaxies
We compare the surface densities of the -selected galaxies in the five fields to determine whether there is an overdensity of sources around the targeted HzRGs. For a direct field to field comparison, we cut the catalogues at the completeness limits of the shallowest HAWK-I images (see §3; , and ). Table 3 summarizes the densities for both the r- and b- galaxies in the five fields assuming Poisson errors for the source densities.
As far as the r- galaxies are concerned, the fields around MRC 1017-220, CF2 and GOODS1 have similar densities. As expected, GOODS2 which contains the overdensity at described in Kurk et al. (2009) is slightly denser than average, e.g. by a factor of compared to GOODS1. The field around MRC 0156-252 is significantly overdense compared to all the other fields: by a factor of compared to MRC 1017-220, compared to GOODS1 and compared to GOODS2666The colour selection is very sensitive to the photometric calibration of the images and the -band zeropoint has relatively large error bars (). We note however that even if the zeropoint was offset by -0.07, the field would still be overdense in red galaxies by a factor of compared to MRC 1017-220 and compared to GOODS2..
We also derive densities within Mpc (, angular separation) for both HzRGs corresponding to the classical estimates of virial radius in the highest redshift clusters known to date (e.g. Hilton et al. 2007). In the close vicinity of MRC 0156-252, the r- density is even higher: times denser than GOODS1 and times denser than the (overdense) GOODS2 field.
As far as the b- galaxies are concerned, densities are more similar from field to field. However, we find that GOODS2 and the HzRGs fields are slightly denser than average. MRC 1017-220 is the densest field. The region within Mpc of the radio galaxy is times denser than CF2. The field of MRC 0156-252 is also denser, by a factor of compared to CF2.
| Field | Area | r-a | b-a |
|---|---|---|---|
| (arcmin2) | (deg2) | (deg2) | |
| MRC1017-220 | |||
| MRC1017-220 (Mpc) | |||
| MRC0156-252 | |||
| MRC0156-252 (Mpc) | |||
| CF2 | |||
| GOODS1 | |||
| GOODS2 |
-
a
Within % completeness limits; densities were rounded for clarity.
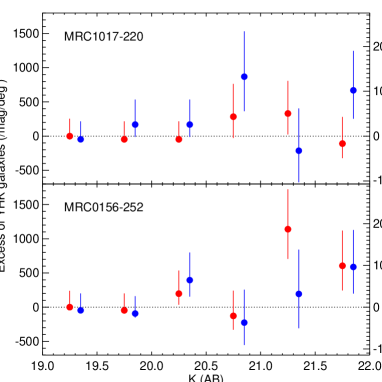
We also derive the number counts of the -selected galaxies in all the targeted fields. Reference number counts are derived for both r- and b- selected galaxies combining CF2, GOODS1, GOODS2 and subtracted from the number counts of the targeted HzRGs fields. Fig. 10 illustrates the number counts of this ‘excess’ of galaxies per mag bin suspected to be associated with the HzRGs. Errors on both the radio galaxies fields and reference fields number counts are added in quadrature. We assume the Gehrels (1986) small numbers approximation for Poisson distributions.
As for Table.3, this analysis is made in the limits of completeness of the (shallowest) data for a direct field to field comparison. However, due to the selection technique combined with our completeness limits, we do not select all galaxies in the fields with the selection getting rapidly incomplete at fainter magnitudes. To illustrate this, we look at the colours of r- galaxies in the field of MRC 0156-252. On average, they have and . The completeness limit in (our limiting band) is corresponding to and therefore , despite the data being complete up to half a magnitude deeper in . We therefore limit the analysis to .
No significant excess is seen in the r- number counts of the MRC 1017-220 field compared to the control fields. The excess of b-, already mentioned earlier in this section is also observed in Fig. 10 with an excess of sources. The field of MRC 0156-252 also shows an excess of blue sources. We do not observe an excess of bright red sources () in the field of MRC 0156-252 as compared to the control fields. The overdensity of red sources in the field of MRC 0156-252 becomes prominent at with an excess of to galaxies in the field (by bin of mag) compared to average. At , such magnitudes in for elliptical galaxies correspond to masses of several M⊙ (Kodama et al. 2007; Rocca-Volmerange et al. 2004) suggesting that if the overdensity detected is indeed associated with MRC 0156-252, the HzRG would lie in a structure that already contains very massive, passively evolving galaxies.
6.2 Spatial distribution of the candidates
The spatial distribution of the -selected galaxies (detected within our magnitude limits) in the two GOODS fields is shown in Fig. 11 for r- and b- galaxies in red and blue large circles. Sources detected in , and () are marked with black dots. Sources detected in and but not in , though falling in the r- selection area (i.e. red arrows in Fig. 8), are overplotted in small red dots. Due to the deep GOODS -band, there are only two such sources.We observe a clear inhomogeneity in the distributions of r- and b- galaxies in the northern part of the field (GOODS2). A concentration of both red and blue galaxies is found at the location of the galaxy overdensity presented in Kurk et al. (2009), confirming again the efficiency of the criterion at detecting galaxy structures.
We note that the northern part of GOODS1 (the southern part of the GOODS field) is more populated with r- galaxies than the rest of GOODS1. The spatial distribution of b- galaxies is more homogenous, but we also observe a clear concentration of b- galaxies at the same position as the excess of r- galaxies (i.e. at R.A. and Dec.). We therefore confirm the results of Kurk et al. (2009) and Castellano et al. (2007) that the overdensity spreads southward. Three of the b- galaxies have a spectroscopically confirmed redshift of from the ESO GOODS spectroscopy (reported in the GOODS-MUSIC catalogue; see the three black squares in Fig. 11, right panel).
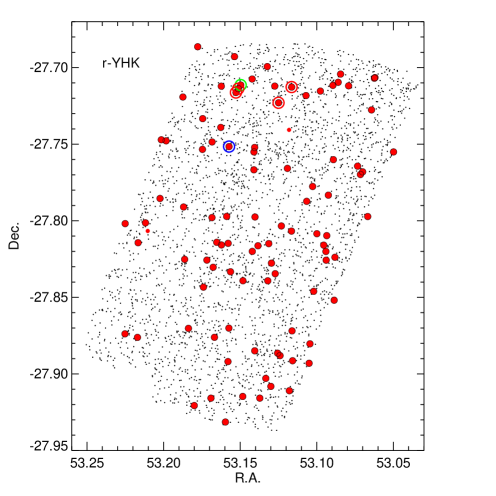
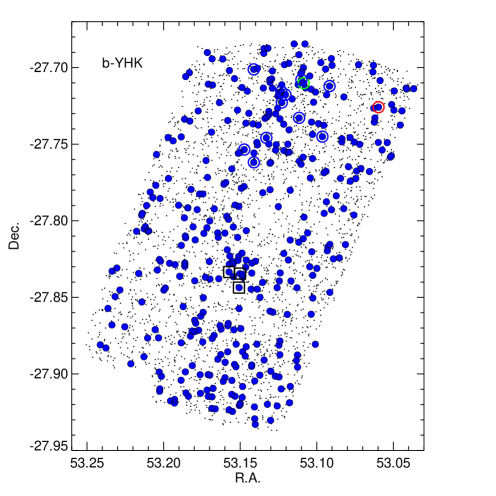
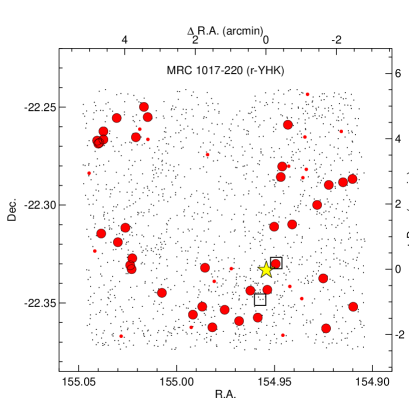
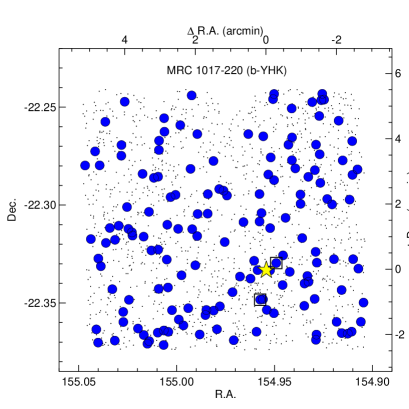
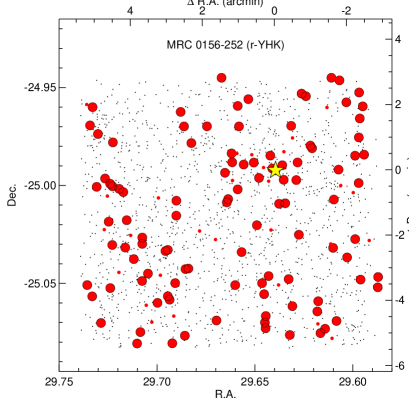
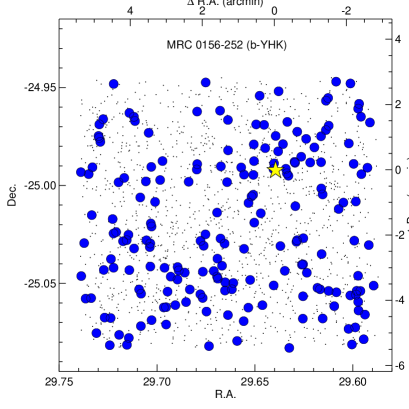
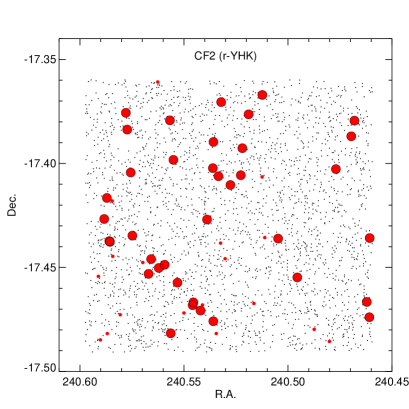
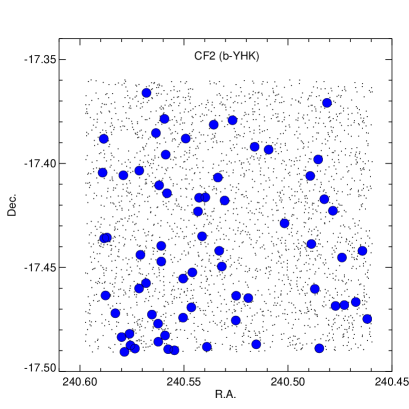
The spatial distribution of the galaxies around MRC 1017-220, MRC 0156-252 and in CF2 is shown in Fig. 12. r- and b- galaxies are shown as red and blue large circles (first and second column) respectively.Sources detected in and with lower limits in and selected by our r- criteria are shown by small red dots. Distances from both HzRGs (yellow star) are indicated on the top and right axis of the four first panels. We do not see any specific distribution of -selected galaxies in CF2 (Fig. 12, bottom row).
For MRC 1017-220, we indicate the two EROs with spectro-photometric redshift from Cimatti et al. (1999) by black squares. The r--selected galaxies have a non uniform spatial distribution over the field, with a hint of a filamentary distribution in the NW-SE direction in which lies the radio galaxy. No clear spatial inhomogeneity is observed for the b- galaxies except a slight excess in the southern part of the field. We note that this result is in agreement with previous studies which show that red galaxies are more strongly clustered than blue ones (Daddi et al. 2000; Brown et al. 2003; Kong et al. 2006).
A visual inspection of the field around MRC 0156-252 confirms the overdensity of red objects around the HzRG, with the r- being more concentrated around the HzRG. A concentration of b- galaxies is seen in the immediate () North-West of the HzRG. A second concentration of blue galaxies is also observed in the South-East part of the field (at R.A.29.66-29.70, Dec-25.05). However, no counterpart of this blue galaxy excess is seen in the r- galaxy distribution.
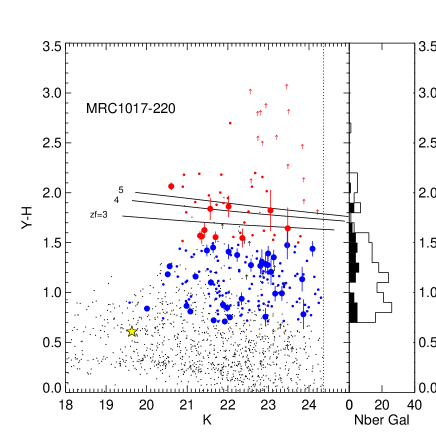
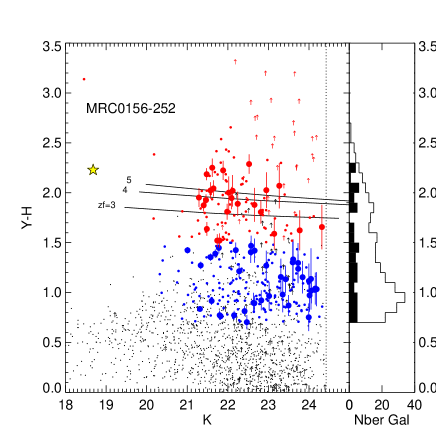
6.3 The colour-magnitude diagram
The distribution of the candidates in the vs colour-magnitude diagram is shown in Fig. 13. Red and blue filled circles indicate r- and b- galaxies respectively. Candidates in the close vicinity of the HzRGs ( corresponding to Mpc at the HzRG redshifts) are shown by larger circles in the bottom panels. Both HzRGs are marked by yellow stars777We note that at the redshift of MRC 1017-220 (), the [OII]Å line is falling in the band which can explain the very blue colour of the HzRG.. We overplot the expected location of a sequence of passively evolving galaxies (taken from the Coma cluster at ) at and for three different formation redshifts (, and ). Models at are also overplotted as the GOODS colour-magnitude diagrams (top panels) since a galaxy structure at is known to lie in these fields (see §5.1).
The right insets of each panel give the histogram of the colours of the candidates galaxies at . It is now well known that galaxies in clusters show a strong bimodality in their colour distribution, with star-forming non-dusty galaxies being on the bluer side, and passively evolving galaxies on the redder side (corresponding to the location of the red sequence) separated by a ‘green valley’ of intermediate type objects. A bimodal repartition is suggested in the histograms of the two HzRGs (lower panels) with two peaks on both sides of corresponding to the separation criteria that was designed to isolate passively evolving galaxies from star-forming blue ones.
Half of the red sources within Mpc of MRC 0156-252 have colours consistent with red sequence-like galaxies at . The scatter of these sources is quite large (over mag), the intrinsic scatter being enlarged by errors on the -band photometry, and contamination from background/foreground galaxies. If some of the red galaxies re indeed passively evolving galaxies at , they would have been formed at very high redshift with a formation redshift .
We also note similarities between the colour-magnitude diagram of MRC 0156-252 and that of PKS 1138-262 presented in Kodama et al. (2007). The r- galaxies that lie on the red sequence models in the field of MRC 0156-252 have with a high fraction of them (%) lying on the brighter end (). This is consistent with the field around PKS 1138-262, where the majority of the red near-infrared selected sources () which lay on the red sequence had and half of them had . This suggests that both fields contain massive red galaxies.
At , the Å break enters the -band. -band spectroscopy is thus necessary to prove that the red galaxies are indeed associated with MRC 0156-252. Kriek et al. (2008) present a near-infrared spectroscopic survey of -bright galaxies () at selected from the MUlti-wavelength Survey by Yale-Chile (MUSYC; Gawiser et al. 2006; Quadri et al. 2007) and derive spectroscopic redshifts for their full sample (). Such a spectroscopic campaign could be conducted similarly in the field of MRC 0156-252 since it contains r- (% of the r- sample) and b- galaxies (% of the b- sample) which have .
Doherty et al. (2010) describe a spectroscopic campaign in the PKS 1138-262 field. Two DRGs were confirmed to lie at the redshift of the radio galaxy (due to the presence of the H emission line in their spectra). One is a dust-obscured star-forming, red, galaxy. The other is an evolved galaxy with little on-going star formation. These are the first spectroscopically confirmed red galaxies associated with a protocluster at . These results are encouraging for a future near-IR spectroscopic campaign in the field of MRC 0156-252.
7 Summary
We develop a new purely near-infrared -colour selection technique to isolate galaxies at and classify them as (i) passively evolving, or dusty star-forming galaxies and (ii) star-forming dominated galaxies with little or no dust. We test the method using the GOODS-South field, which has been observed in , and , and for which a large amount of spectroscopic data is available. GOODS-S contains a structure of galaxies at ( spectroscopically confirmed members so far). Applying the near-infrared criteria to the GOODS-S field, we recover this structure confirming the efficiency of our new selection technique.
We target the surroundings of two high redshift radio galaxies, MRC 1017-220 () and MRC 0156-252 () and a control field using VLT/HAWK-I. The field of MRC 1017-220 shows a non-homogeneous filamentary-like spatial arrangement of red galaxies, and a slight overdensity of blue galaxies. MRC 0156-252 lies in an overdense region of both blue and red galaxies. This field is times denser than the other targeted fields.
The red galaxies are clustered around MRC 0156-252 ( Mpc). The blue galaxies seem to be preferentially distributed in two regions; a concentration of b- galaxies is found immediately at the NW of MRC 0156-252 and another concentration is found in the SE part of the field, (Mpc at ) away from the HzRG. Our study of the close vicinity of MRC 0156-252 suggests that the radio galaxy has close-by companions with three galaxies found aligned with the HzRG (and the radio axis) and within . This structure is similar to the system found in the vicinity of PKS 1138-262.
The distribution of the selected red galaxies in a colour-magnitude diagram shows that a large fraction of them have colours consistent with red sequence-like objects (with , assuming they contain no dust). The magnitude range of these candidates is also similar to the red protocluster members selected in the vicinity of PKS 1138-262, with red galaxies preferentially lying on the bright end (). This suggests that the systems associated with the HzRGs have already form their more massive members. All these results strongly suggest that MRC 0156-252 is associated with a galaxy structure at similar to the galaxy system associated with PKS1138-262 at .
References
- Andreon et al. (2008) Andreon, S., Maughan, B., Trinchieri, G., & Kurk, J. 2008, ArXiv:0812.1699
- Balogh et al. (2007) Balogh, M. L. et al. 2007, MNRAS, 374, 1169
- Bertin & Arnouts (1996) Bertin, E. & Arnouts, S. 1996, A&AS, 117, 393
- Best et al. (2003) Best, P. N. et al. 2003, MNRAS, 343, 1
- Brown et al. (2003) Brown, M. J. I. et al. 2003, ApJ, 597, 225
- Bruzual & Charlot (2003) Bruzual, G. & Charlot, S. 2003, MNRAS, 344, 1000
- Cardelli et al. (1989) Cardelli, J. A., Clayton, G. C., & Mathis, J. S. 1989, ApJ, 345, 245
- Casali et al. (2006) Casali, M. et al. 2006, in SPIE, Vol. 6269, Society of Photo-Optical Instrumentation Engineers (SPIE) Conference Series
- Castellano et al. (2007) Castellano, M. et al. 2007, ApJ, 671, 1497
- Castellano et al. (2010) —. 2010, A&A, 511, A260000+
- Chabrier (2003) Chabrier, G. 2003, PASP, 115, 763
- Chen et al. (2002) Chen, H.-W. et al. 2002, ApJ, 570, 54
- Cimatti et al. (1999) Cimatti, A. et al. 1999, A&A, 352, L45
- Cimatti et al. (2000) —. 2000, MNRAS, 318, 453
- Cimatti et al. (2008) —. 2008, A&A, 482, 21
- Daddi et al. (2000) Daddi, E. et al. 2000, A&A, 361, 535
- Dickinson et al. (2003) Dickinson, M., Giavalisco, M., & GOODS Team. 2003, in The Mass of Galaxies at Low and High Redshift, ed. R. Bender & A. Renzini, 324–+
- Doherty et al. (2010) Doherty, M. et al. 2010, A&A, 509, 83
- Dressler (1980) Dressler, A. 1980, ApJ, 236, 351
- Eales & Rawlings (1996) Eales, S. A. & Rawlings, S. 1996, ApJ, 460, 68
- Elston et al. (2006) Elston, R. J. et al. 2006, ApJ, 639, 816
- Finger et al. (2008) Finger, G. et al. 2008, in SPIE, Vol. 7021, Society of Photo-Optical Instrumentation Engineers Conference Series
- Franx et al. (2003) Franx, M. et al. 2003, ApJ, 587, L79
- Galametz et al. (2009) Galametz, A. et al. 2009, A&A, 507, 131
- Galametz et al. (2010) —. 2010, ArXiv:1004.3021
- Gawiser et al. (2006) Gawiser, E. et al. 2006, ApJS, 162, 1
- Gehrels (1986) Gehrels, N. 1986, ApJ, 303, 336
- Gladders & Yee (2000) Gladders, M. D. & Yee, H. K. C. 2000, AJ, 120, 2148
- Grazian et al. (2006a) Grazian, A. et al. 2006a, A&A, 453, 507
- Grazian et al. (2006b) —. 2006b, A&A, 449, 951
- Hawarden et al. (2001) Hawarden, T. G. et al. 2001, MNRAS, 325, 563
- Hewett et al. (2006) Hewett, P. C. et al. 2006, MNRAS, 367, 454
- Hilton et al. (2007) Hilton, M. et al. 2007, ApJ, 670, 1000
- Huang et al. (2001) Huang, J.-S. et al. 2001, A&A, 368, 787
- Imai et al. (2007) Imai, K. et al. 2007, AJ, 133, 2418
- Kajisawa et al. (2006) Kajisawa, M. et al. 2006, MNRAS, 371, 577
- Kapahi et al. (1998) Kapahi, V. K. et al. 1998, ApJS, 118, 275
- Kissler-Patig et al. (2008) Kissler-Patig, M. et al. 2008, A&A, 491, 941
- Kodama et al. (2007) Kodama, T. et al. 2007, MNRAS, 377, 1717
- Kong et al. (2006) Kong, X. et al. 2006, ApJ, 638, 72
- Kriek et al. (2008) Kriek, M. et al. 2008, ApJ, 677, 219
- Kümmel & Wagner (2001) Kümmel, M. W. & Wagner, S. J. 2001, A&A, 370, 384
- Kurk et al. (2009) Kurk, J. et al. 2009, ArXiv:0906.4489
- Kurk et al. (2004) Kurk, J. D. et al. 2004, A&A, 428, 817
- Kurk et al. (2008) Kurk, J. D. et al. 2008, in Astronomical Society of the Pacific Conference Series, Vol. 381, Infrared Diagnostics of Galaxy Evolution, 303
- Lidman et al. (2008) Lidman, C. et al. 2008, A&A, 489, 981
- Maihara et al. (2001) Maihara, T. et al. 2001, PASJ, 53, 25
- McCarthy et al. (1992) McCarthy, P. J., Persson, S. E., & West, S. C. 1992, ApJ, 386, 52
- Mei et al. (2006) Mei, S. et al. 2006, ApJ, 644, 759
- Mei et al. (2009) —. 2009, ApJ, 690, 42
- Metcalfe et al. (2006) Metcalfe, N. et al. 2006, MNRAS, 370, 1257
- Miley & De Breuck (2008) Miley, G. & De Breuck, C. 2008, A&A Rev., 15, 67
- Miley et al. (2004) Miley, G. K. et al. 2004, Nature, 427, 47
- Miley et al. (2006) —. 2006, ApJ, 650, L29
- Monet et al. (2003) Monet, D. G. et al. 2003, AJ, 125, 984
- Moy et al. (2003) Moy, E. et al. 2003, A&A, 403, 493
- Overzier et al. (2008) Overzier, R. A. et al. 2008, ApJ, 673, 143
- Papovich et al. (2010) Papovich, C. et al. 2010, ApJ, 716, 1503
- Pentericci et al. (2000) Pentericci, L. et al. 2000, A&A, 361, L25
- Pentericci et al. (2001) —. 2001, ApJS, 135, 63
- Pickles (1998) Pickles, A. J. 1998, PASP, 110, 863
- Pirard et al. (2004) Pirard, J. et al. 2004, in The Society of Photo-Optical Instrumentation Engineers (SPIE) Conference Series, Vol. 5492, Society of Photo-Optical Instrumentation Engineers (SPIE) Conference Series, ed. A. F. M. Moorwood & M. Iye, 1763–1772
- Poggianti et al. (2009) Poggianti, B. M. et al. 2009, ApJ, 697, L137
- Postman et al. (2005) Postman, M. et al. 2005, ApJ, 623, 721
- Quadri et al. (2007) Quadri, R. et al. 2007, AJ, 134, 1103
- Rettura et al. (2010) Rettura, A. et al. 2010, ApJ, 709, 512
- Retzlaff et al. (2010) Retzlaff, J. et al. 2010, A&A, 511, A50+
- Rocca-Volmerange et al. (2004) Rocca-Volmerange, B., Le Borgne, D., De Breuck, C., Fioc, M., & Moy, E. 2004, A&A, 415, 931
- Rosati et al. (2004) Rosati, P. et al. 2004, AJ, 127, 230
- Rosati et al. (2009) —. 2009, ArXiv:0910.1716
- Santini et al. (2009) Santini, P. et al. 2009, ArXiv:0905.0683
- Saracco et al. (2001) Saracco, P. et al. 2001, A&A, 375, 1
- Schlegel et al. (1998) Schlegel, D. J., Finkbeiner, D. P., & Davis, M. 1998, ApJ, 500, 525
- Seymour et al. (2007) Seymour, N. et al. 2007, ApJS, 171, 353
- Skrutskie et al. (2006) Skrutskie, M. F. et al. 2006, AJ, 131, 1163
- Stanford et al. (2005) Stanford, S. A. et al. 2005, ApJ, 634, L129
- Stanford et al. (2006) —. 2006, ApJ, 646, L13
- Tanaka et al. (2010) Tanaka, M., Finoguenov, A., & Ueda, Y. 2010, ArXiv:1004.3606
- Tanaka et al. (2005) Tanaka, M. et al. 2005, MNRAS, 362, 268
- Vandame (2004) Vandame, B. 2004, PhD Thesis, Nice University, France
- Venemans et al. (2002) Venemans, B. P. et al. 2002, ApJ, 569, L11
- Venemans et al. (2005) —. 2005, A&A, 431, 793
- Venemans et al. (2007) —. 2007, A&A, 461, 823
- Yan et al. (1998) Yan, L. et al. 1998, ApJ, 503, L19+
- Zirm et al. (2008) Zirm, A. W. et al. 2008, ApJ, 680, 224