Microstructure, vacancies and moments of nuclear magnetic resonance of hydrogenated amorphous silicon
Abstract
Recent experiments on hydrogenated amorphous silicon using infrared absorption spectroscopy have indicated the presence of mono- and divacancy in samples for concentration of up to 14% hydrogen. Motivated by this observation, we study the microstructure of hydrogen in two model networks of hydrogen-rich amorphous silicon with particular emphasis on the nature of the distribution (of hydrogen), the presence of defects, and the characteristic features of the nuclear magnetic resonance spectra at low and high concentration of hydrogen. Our study reveals the presence of vacancies, which are the built-in features of the model networks. The study also confirms the presence of various hydride configurations in the networks that include from silicon monohydrides and dihydrides to open chain-like structures, which have been observed in the infrared and nuclear magnetic resonance experiments. The broad and the narrow line widths of the nuclear magnetic resonance spectra are calculated from a knowledge of the distribution of spins (hydrogen) in the networks.
pacs:
71.15.Mb, 71.23.Cq, 71.23. An,
1 Introduction
Since its first preparation in 1969 using glow discharge deposition technique [1], hydrogenated amorphous silicon is possibly the most extensively studied material of technological importance. The material is widely used in solar cells [2], thin film transistors [3, 4, 5], memory switching circuits [6, 7], photosensors [8], and numerous other electronic devices [9]. A multitude of experimental data are available that address almost every aspect of structural, electronic, optical, and vibrational properties of the material [9, 10]. Fundamental to the understanding of the Staebler-Wronski (SW) [11] effect—the degradation of the material upon prolong exposure to light irradiation—is the distribution and the dynamics of hydrogen atoms in amorphous silicon networks. Since many of the proposed microscopic mechanisms that attempt to explain the SW effect are based on bond-breaking models [12, 13], it is essential to understand the local environment of hydrogen atoms in amorphous silicon networks. While there exist a number of experimental studies that address the distribution of hydrogen in amorphous silicon samples via nuclear magnetic resonance (NMR) [14, 15, 16, 17, 18, 19] and infrared (IR) spectroscopy [14, 15, 20, 21], there are very few theoretical studies [22, 23, 24, 25, 26, 27] that address the problem explicitly.
In this paper we study the hydrogen microstructure of realistic models of hydrogen-rich amorphous silicon at low and high concentration. Since a set of one-dimensional NMR data cannot be uniquely mapped onto a three-dimensional real space distribution of hydrogen without further information and assumptions, it is more appropriate and useful to address the problem by employing suitable models of hydrogenated amorphous silicon. The microstructure of the model networks has been studied with particular emphasis on the characteristics of the real space distribution of hydrogen in the networks, and has been compared directly to the results obtained from the NMR and IR experiments. A theoretical estimate of the width of the resonance curve has been obtained from a knowledge of the position of the spins in the network using a suitable approximation to the shape of the NMR line spectra. The approach provides a direct route to study the distribution of hydrogen, the presence of different hydride configurations, and the size of the various hydrogen clusters in the networks. The evolution of the microstructure with the concentration of hydrogen in the networks has been also addressed, and a comparison has been made to the experimental data.
The plan of the paper is as follows. In section 2, we briefly review the results from the earlier theoretical and experimental studies with particular emphasis on the results obtained from the NMR and IR spectroscopies of hydrogenated amorphous silicon. This is followed by a discussion of the microstructure that we have observed in the model networks at low and high concentration in section 3. Section 4 addresses the presence of vacancies in the model networks and compares the results to all available experimental data. In section 5 we address how to calculate the line widths of the NMR spectra from a knowledge of the distribution of the spins in amorphous networks. This is followed by a conclusion of our work in section 6.
2 Earlier works on hydrogen microstructure: A brief review
Nuclear magnetic resonance (NMR) [14, 15, 16, 17, 18, 19] and infrared (IR) spectroscopy [14, 15, 20, 21] are the two principal experimental techniques that can address hydrogen microstructure in amorphous silicon. The former provides useful information about the nature of the distribution of hydrogen in amorphous networks via dipolar interaction between the spins in hydrogen atoms, whereas the latter identifies the presence of various hydrogen bonding configurations by probing the bonding environment of hydrogen atoms. Among the early works, the proton magnetic resonance study by Reimer et al[15] on plasma-deposited samples is the first to indicate the presence of inhomogeneity in the hydrogen distribution in amorphous silicon. The study also revealed that hydrogen atoms could reside in amorphous networks as small clusters and in a dilute environment. While NMR studies cannot provide directly a description of the three-dimensional spin distribution in the network, it is possible to infer useful information about the size of hydrogen clusters and the nature of the distribution (either sparse or dense) of hydrogen atoms in the samples by analyzing the shape and the width of an NMR spectrum. A typical NMR spectrum of a device-quality sample shows the presence of both narrow and broad line widths, which can be approximated as a convolution of a truncated Lorentzian and a Gaussian distribution. An analysis of the NMR spectra of amorphous silicon samples with 8–32 at.% H by Reimer et al[15] indicated that the broad line width of the spectrum lied in the range 22–27 kHz, whereas the narrow line width was of the order of 3–5 kHz. Similar observation was also reported in the NMR experiments by Carlos et al[19], who also noted a variation of the line width of up to 20% depending on the nature of amorphous samples used in the measurements.
A definitive picture about the microstructure emerged with the advent of multiple-quantum nuclear magnetic resonance (MQ-NMR)[16]. The MQ-NMR experiments of Baum et al[16] confirmed that for device-quality samples a characteristic feature of the microstructure was the presence of small clusters (of size 4–7 H atoms), and with increasing concentration of hydrogen these clusters merged into large clusters. Thus experimental data appear to suggest that the distribution is inhomogeneous at low concentration, and the microstructure mainly consists of small (hydrogen) clusters and a dilute distribution of hydrogen atoms dispersed in the silicon matrix. However, recent experimental results by Wu et al[17] on hot wire chemically vapor deposited (HW-CVD) samples have revised this view. The authors have observed a new hydrogen distribution with broad line widths of about 34–39 kHz for the glow discharge (GD) samples of concentration 8–10%, and about 47–53 kHz for the hot wire (HW) samples of concentration 2–3%. In both the samples, the narrow line widths have been found to be of the order of 3–6 kHz. This implies that even at very low concentration it is possible to have large clusters of hydrogen in the samples that can produce a line width as broad as 50.0 kHz. In other words, the microstructure can vary significantly depending on the preparation conditions, method of deposition and substrate temperature, and not just on the concentration of hydrogen in the samples.
While a great deal of information can be obtained from NMR experiments, IR spectroscopy [15, 20, 21] can detect the presence of different hydride configurations by measuring the vibrational frequencies of hydrogen in various hydrogen bonding environments. The results from the IR studies by Ouwens and Schropp et al[21] indicated that for device-quality samples 3–4% of total hydrogen atoms resided in the network as isolated or distributed monohydrides (SiH). This observation is consistent with the MQ-NMR study of Baum et al [16] on device-quality samples of hydrogenated amorphous silicon. The IR experiments by Manfredotti et al[20] and Lucovsky et al[28], and the MQ-NMR study by Baum et al[16] provided evidence of the presence of various hydride configurations such as SiH, SiH2 and SiH3 in device-quality samples, whereas at high concentration it was observed that the networks could have open chains of (SiH2)n. The microstructure is further enriched by the presence of vacancies [29, 30], voids [29, 31] and molecular hydrogen [32, 33] in the networks. The Mössabauer spectroscopic studies by Hoven et al[30] indicated the presence of vacancies in hydrogenated amorphous silicon. Recently, Smets et al[29] have studied samples by means of infrared absorption spectroscopy prepared via an expanding thermal plasma technique and observed that the microstructure is dominant by mono- and divacancy at low concentration of up to 14 at. % H, and microvoids or voids at high concentration beyond 14 at. % H. The presence of molecular hydrogen in the amorphous silicon network has been studied extensively by several groups using NMR [16, 32, 33], infrared-absorption [34] and calorimetry experiments [35]. The results of these studies can be summarized by stating that approximately 1% of total hydrogen can reside in the network in the molecular state.
In contrast to experimental studies, there are only a handful of theoretical studies that explicitly focus on the hydrogen microstructure of amorphous silicon [22, 23, 24, 25, 26, 27]. Of particular importance is the work by Drabold et al[22, 23] that addresses hydrogen-hydrogen pair separation in various dihydride configurations. The theoretical studies by Kim et al[25, 26] focused on the calculation of electronic structure of hydrogenated amorphous silicon and some properties of vacancy configurations, such as the changes in the volume of a vacancy upon relaxation of the network. Zhang et al[27] studied the creation of higher order vacancies and their stability by relaxing the network from first-principles calculations. They found that any higher order vacancy had the tendency to evolve into a lower order vacancy including a monovacancy and a stable divacancy. An unsatisfactory feature of most of the theoretical studies was that the vacancies or defect configurations were created by hand, which were then relaxed locally or globally in order to obtain a stable vacancy configuration. While such an approach is correct in principle and a prolonged first-principles molecular dynamics simulation can indeed find the minimum energy (stable) configuration of the defects, a short local or global relaxation may not be sufficient to eliminate the initial bias associated with the defect creation (by hand) in an overconstrained network.
3 Microstructure at low and high concentration of hydrogen
A review of the experimental literature in the preceding section suggests that hydrogen can reside in various bonding environments, which typically consist of SiH, SiH2, SiH3, and the chain structure of mono- and dihydrides that are connected via Si atoms. Furthermore, many of these configurations can realize both in cluster and dilute phases including a completely isolated environment depending on the concentration of hydrogen in the samples. It is therefore important to study models of hydrogen-rich amorphous silicon network both at low and high concentration. In the following we discuss the microstructure of hydrogenated amorphous silicon for two representative concentrations of hydrogen. In particular, we consider two models of hydrogenated amorphous silicon with 7% and 22% hydrogen that consist of total 540 and 611 atoms respectively, and compare the results to the available experimental data from the literature. These models have been constructed using the experimentally constrained molecular relaxation (ECMR) [36] technique developed by one of us. The details of the construction of the models and their structural, electronic and vibrational properties have been studied thoroughly and published elsewhere [37], which we would not repeat here. The 540-atom model with 7% H atoms has very few defects ( 2.9 %), whereas the model with 22% H has only a single defect.
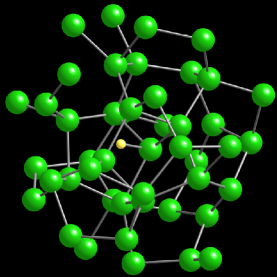
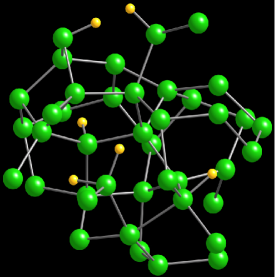
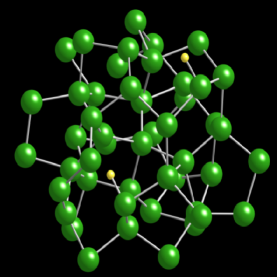
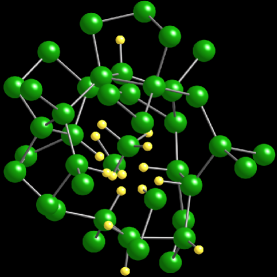
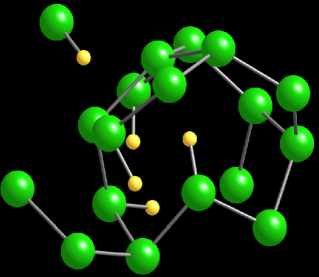
We begin our discussion by focusing on the monohydride and the dihydride bonding configurations. The model with 7% H corresponds to a device-quality sample. At this concentration, most of the hydrogen atoms are found to be bonded to silicon atoms as monohydrides (SiH) and dihydrides (SiH2). A total of 75% of all hydrogen atoms are found to reside in the form of monohydrides, whereas the remaining 25% are realized in dihydride configurations. An examination of the model reveals that approximately 5% of the total hydrogen atoms reside as isolated monohydrides. This result is in agreement with the experiment of Ouwens and Schropp [21], who have observed approximately 4% of total hydrogen atoms in the isolated phase. An example of such an isolated monohydride (SiH) is shown in figure 1a. The silicon complex in the figure consists of about 46 Si atoms within a radius of 6.0 Å surrounding the isolated hydrogen atom. Apart from such an isolated monohydride configuration, many of the monohydrides and the dihydrides are realized in the network that are close to each other to forming a dilute distribution of hydrogen. The remaining hydrogen atoms form clusters that typically consist of 4–7 H atoms. The size of the clusters varies from 5.0 Å to 7.0 Å, and one such a cluster is presented in figure 1b. At low concentration all the dihydride configurations are realized in a clustered environment indicating the absence of isolated dihydrides in the model. The overall microstructure of the 540-atom (7% H) model is shown in figure 2a without the silicon matrix (except for the silicon atoms bonded to hydrogen) in order to highlight the dilute and the densely occupied regions. Two small clusters are encircled to indicate explicitly in figure 2a. The scattered distribution of such small clusters in the background of a dilute environment (of hydrogen) indicates that the hydrogen atoms are distributed quite inhomogeneously, which is consistent with the results from the nuclear magnetic resonance studies [14, 15, 16, 17] mentioned in section 2.
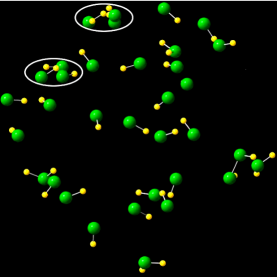
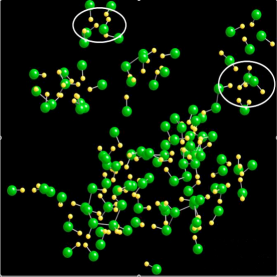
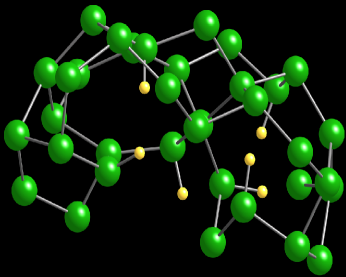
Having discussed the model with low hydrogen content, we now address the microstructure of a model network with a high concentration of hydrogen. In particular, we consider a model with 611 atoms that has total 133 or 22% hydrogen atoms in the network. While the concentration is somewhat higher than a typical device-quality sample (8–20% H) [19], the model provides valuable insights about the changing nature of the microstructure with the addition of hydrogen atoms. As the hydrogen concentration increases, more and more hydrogen atoms are available in the network and small clusters of silicon and hydrogen begin to form until the concentration is high enough when large clusters appear. The microstructure is dominated by clusters rather than a dilute or sparse distribution of hydrogen at this stage. The overall distribution of hydrogen for the 611-atom model is shown in figure 2b. The distribution (of hydrogen) is quite inhomogeneous, which consists of both small and large clusters. Two such small clusters are indicated in figure 2b that consist of 5–8 H atoms. A real space analysis of the model also reveals the presence of some large clusters consisting of as many as 16 H atoms within a radius of 6.0 Å, and is shown in figure 3b. These clusters mostly consist of silicon monohydrides (SiH) and dihydrides (SiH2), but a few SiH4 configurations are also found to realize in our model [24]. While the microstructure at high concentration is mostly dominated by the presence of clusters, a few monohydrides are also present in a very dilute or an almost isolated environment. In figure 3a we have shown two such lone monohydrides that are found in a silicon complex of radius 6.0 Å.
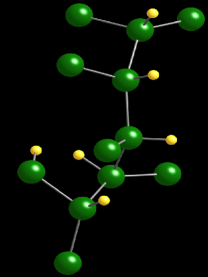
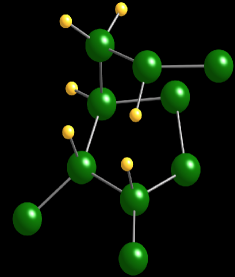
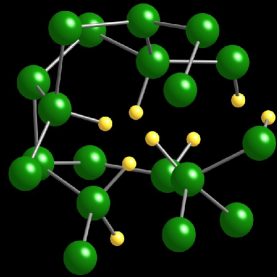
Finally, we should mention an important aspect of the hydrogen microstructure at high concentration. Some monohydrides can form an open chain-like structure at high concentration via bond formation between the Si atom in the monohydrides. The chain structure that we have observed in the model with 22% hydrogen consists of 4 to 7 monohydrides (SiH). A few structures are also observed where monohydrides in the chain are replaced by dihydrides. Examples of such chain-like structures are shown in figure 4. The structure in the left (of figure 4) consists of six SiH that are connected to each other via Si-Si bonding, whereas the structure in the right has four monohydrides and a single dihydride. Such chain configurations are not observed in the model with low concentration (7%) of hydrogen. The presence of such chain-like structures was reported experimentally by Lucovsky et al[28], Manfredotti et al[20], and Baum et al [16].
4 Vacancies in hydrogenated amorphous silicon
Unlike crystalline materials where vacancies can be uniquely defined and identified easily, the presence of disorder makes it difficult to do so in amorphous materials. Nonetheless, for continuous random networks, one can consider missing of one or two neighboring atoms in the topologically connected environment as a mono- or divacancy respectively. On the other hand, the absence of a few or many atoms in the network constitutes a microvoid or a void depending on the number of missing atoms. Infrared absorption spectroscopy on amorphous samples prepared via an expanding thermal plasma technique by Smets et al[29] have indicated that the microstructure in hydrogenated amorphous silicon samples can be characterized by the presence of vacancies and voids that largely depends on the amount of hydrogen present in the samples. In particular, these authors have observed that the microstructure is dominated by mono- and divacancy at low concentration of up to 14% H, whereas microvoids or voids appear at high concentration. Theoretical study by Zhang et al[27] also indicated the presence of mono- and divacancy as inherent defects in hydrogenated amorphous silicon networks. They noted that any higher order ‘-vacancy’ had a tendency to split into mono- or divacancy on prolonged relaxation of the network. In most of the theoretical studies [25, 26, 27], the vacancies were explicitly introduced by hand, and the stability of the (vacancy) configurations were studied by relaxing the network using an appropriate ab initio or tight-binding energy functional.
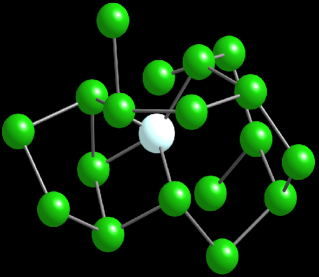
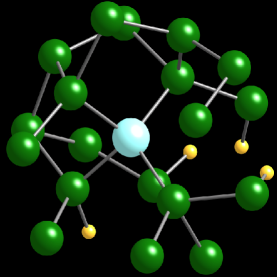
Motivated by the experimental results of Smets et al[29], our interest lies in characterizing the microstructure further by searching for mono- and divacancy configurations that might be present in our models. A real space analysis indeed confirms that both mono- and divacancy exist in the models. This observation is very remarkable as vacancies are built-in or inherent in the networks, and are not introduced by hand as in most of the theoretical works mentioned before. These vacancies are a characteristic feature of the models, which is a direct consequence of our unique model building approach via ECMR [36]. In figure 5a, we have shown the region surrounding the monovacancy that consists of four neighboring hydrogen atoms observed in the model with 7% H atoms. For clarity of presentation and to demonstrate the origin of the monovacancy clearly, we have explicitly shown the missing silicon atom in the reconstructed network in figure 5b. The latter is constructed by removing the four hydrogen atoms, and introducing a silicon atom in the region. A first-principles relaxation using Siesta [38] shows that the missing silicon atom bonds with the neighboring silicon atoms by local reconstruction of the network to minimize the strain. This observation also applies to the model with 22% hydrogen, and the corresponding defect region is shown in figure 6a. In this case, the missing silicon atom is directly bonded to the silicon atoms of the neighboring monohydrides, which is clear from figures 6a and 6b.
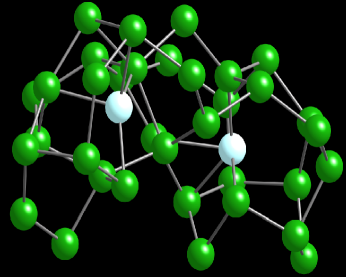
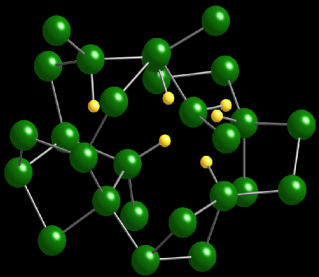
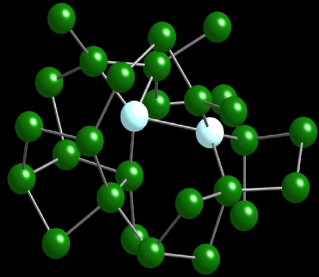
The presence of divacancies has been also found in our models. The observed divacancies can be divided into two types–stable and split. The former is found in high concentration model whereas the latter has realized at low concentration. For the latter, the two missing silicon atoms are not nearest neighbor but they are in close proximity of each other typically within a distance of next near neighbor or so. Following Zhang [27], a split divacancy has a tendency to break into a stable divacancy or two monovacancies. In figure 7a, we have shown the region that consist of a cluster of monohydrides at low concentration (7% H). The positions of the two missing silicon atoms are shown in figure 7b. The exact location is obtained by removing six hydrogen atoms and introducing two silicon atoms, and relaxing the resulting network via Siesta as before. The missing silicon atoms are separated by a distance approximately 6.1 Å, and is indicative of the presence of a spilt divacancy (cf. figure 7a). The origin of the split divacancy can be understood in view of the low concentration of hydrogen in the network, where the microstructure is dominated by a sparse distribution of hydrogen atoms. At high concentration, however, stable divacancies appear. The presence of more hydrogen atoms at high concentration reduces the average (hydrogen) cluster-cluster separation, and thereby facilitates the formation of a stable divacancy. One such stable divacancy is shown in figure 8a. As in the earlier case, we have also indicated the two missing silicon atoms in figure 8b, which are nearest neighbor to each other in this case and are separated by 2.6 Å.
In summary, the microstructure of the model networks is characterized by the presence of mono- and divacancy both at low and high concentration of hydrogen. A remarkable feature of the models is that the vacancies are built-in, and are inherent defects that have been experimentally observed in the concentration range studied in this work.
5 NMR widths from Van Vleck moments: An approximate calculation
The direct determination of the width and the shape of the NMR spectra for amorphous solids is a highly nontrivial task, and is difficult to address from first-principles calculations. However, it is possible to calculate the first few moments of the resonance spectrum from the position of the spins in the network. The approximate shape and the width of the resonance curve can be estimated from these moments, which can be compared to the values obtained from the experimental NMR data. It is, however, important to note that an one-dimensional NMR spectrum cannot fully represent every aspect of the three-dimensional spin distribution or the microstructure (of hydrogen) in the network, and further information is needed for a complete description of the latter. Nonetheless, the moments of an NMR spectrum provide valuable information such as the presence of hydrogen in isolated, sparse and in the clustered environment [15, 16, 17]. A typical NMR line spectrum can be expressed, in the lowest order approximation, as a combination of a Gaussian and a truncated Lorentzian distributions. Since the contribution to the higher moments generally comes from the wings of the distribution that is rarely observed in experiments, the first two or three non-zero moments should suffice to capture the characteristic features such as the shape and the width of the resonance curve [39].
NMR experiments on samples prepared by a variety of methods at different experimental conditions and concentrations reveal that at very dilute concentration randomly dispersed spins (via dipolar interaction) give rise to a narrow line width, whereas the presence of small clusters produce a broad line width in the spectrum. These narrow and broad widths are generally considered to be associated with a truncated Lorentzian and a Gaussian broadening of the spectrum respectively, and can be constructed from theoretical arguments based on the moments of the resonance curve. Following Van Vleck [40], the second and the fourth moments of a system of particles (of spin 1/2) can be written as:
| (1) |
| (2) | |||||
where
and the symbol stands for no two indices being equal in the triple summation. It should be noted that equations (1) and (2) above are independent of the symmetry of the system, and can be applied to both crystalline lattices and amorphous networks [41]. The shape of the resonance curve can be interpreted in terms of the second and the fourth moments. For an ideal Gaussian, , and a low value of indicates a bi-modal behavior or two separated peaks in the spectrum. For a Gaussian lineshape, the full width at half maximum (FWHM) is given by [39],
| (3) |
At low concentration and in dilute environment the ratio can be large, which suggests a truncated Lorentzian as a useful approximation to the shape of the resonance curve. In this case, the FWHM can be expressed using the second and fourth moments of the spectrum as:
| (4) |
In practice, the experimental NMR spectra deviate significantly from an ideal Gaussian or a truncated Lorentzian behavior depending on hydrogen concentration, preparation conditions, and the degree of inhomogeneity present in the microstructure. Equations (3) and (4), therefore, provide only approximate values of the widths originating from the clustered and the dilute environments via dipolar interactions between the spins. For a small deviation (from the ideal Gaussian), one often uses the Gaussian memory function approximation and expresses the universal line width as [42]:
| (5) |
We now proceed to calculate the width of the NMR spectra for the model configurations with 7% and 22% hydrogen atoms. The second and the fourth moments of the spectrum can be calculated using equations (1) and (2), respectively. The FWHM is then obtained in the Gaussian approximation from equation (3). In table 1, we have listed the values of the Van Vleck moments and the overall line widths of the models in the Gaussian approximation. The values of for the model with high concentration suggest that the NMR spectrum can be well approximated by a Gaussian lineshape, and the FWHM can be obtained from equation (3). The result is consistent with the hydrogen microstructure observed in section 3. The hydrogen atoms are densely distributed forming clusters with hydrogen-hydrogen separation varying from 1.6 Å to 2.4 Å [24]. This produces a broad resonance via dipolar interaction that can be approximated by a Gaussian lineshape. For the model with low concentration of hydrogen is somewhat larger than the ideal Gaussian value 3, which is indicative of a narrower spectrum than a Gaussian. The contribution from the wings of the spectrum to the higher moments is not negligible in this case, and a direct application of the Gaussian approximation may not provide a correct estimate of the width.
Further difficulties can arise in characterizing the microstructure of model networks via width in the presence of strong inhomogeneity. The calculation of the narrow width of the resonance curve at high concentration via equation (4) can be misleading in the presence of large hydrogen clusters. If the contribution from a few large clusters dominates the moment summations, the effect of the dilute environment on the width can be missed out. Similarly, the presence of a single large cluster in a dilute environment (at low concentration) may not be reflected in the calculated value of the narrow width from model networks. It is therefore more appropriate to partition the overall microstructure into regions of clustered and dilute phases, and to use the corresponding moments in equations (1) and (2) for calculation of widths for the broad and the narrow part of the spectrum. This partition of the spins into clustered and dilute regions can be viewed as analogous to the deconvolution of an one-dimensional NMR spectrum into a broad and narrow spectrum. In the following, we discuss our results for two different concentrations by partitioning the microstructure into three-dimensional regions of dilute and clustered environments. As mentioned earlier, we can expect to see that the broad line width mainly originates from the clustered environment, whereas the dilute environment accounts for the narrow part of the spectrum.
The results for the broad and narrow line widths from the clustered and dilute environment for each of the model configurations are listed in tables 2 and 3. In addition to the Gaussian line width () for the broad spectrum, we have also included the universal line width () obtained from equation (5) via the Gaussian memory function approximation [42]. The narrow line width of the spectrum is calculated assuming a truncated Lorentzian shape, and is indicated in the tables as . We have also included the value of the narrow line width estimated from the density of hydrogen atoms () in the dilute region using [39]. Since the latter is often used by experimentalists to get an approximated value of the narrow line width, this provides a simple way to compare our results to the experimental data. In table 4, we have summarized the experimental values of the widths obtained by different authors with the theoretical results from the models. The experiments of Reimer et al[15] and Gleason et al[14] have indicated that the broad line width typically ranges from 22 to 30 kHz for samples with 8 to 15% H atoms. This is comparable to the values of 19.0 to 25.0 kHz obtained from the model with 7% H. The calculated value of the broad line width from the model with 22% H is somewhat larger than the experimental value. However, this can be understood by taking into account the presence of a large cluster (cf. figure 3b) in the model. The presence of such large clusters is not surprising and have been reported by Wu et al[17], who have observed a broad line width of 50 kHz in hot-filament-assisted CVD deposited films.
-
H Directions (kHz) 7 100 4.30 17.8 110 5.34 15.9 111 5.64 18.2 22 100 3.07 49.9 110 2.99 50.5 111 2.99 51.1
-
Distribution Direction (kHz) (kHz) Cluster 100 25.1 26.4 110 22.6 25.4 111 19.2 21.8 (kHz) (kHz) Dilute 100 5.3 2.8 110 4.9 2.8 111 4.9 2.8
-
Region Direction (kHz) (kHz) Cluster 100 33.8 40.6 110 47.3 46.8 111 44.3 46.4 (kHz) (kHz) Dilute 100 5.9 6.4 110 6.9 6.4 111 5.9 6.4
-
Theory ( H) (kHz) (kHz) 540-atom model 7.0 19.0–25.0 2.8–5.3 611-atom model 22.0 33.8–47.3 5.9–6.4 Experiments (H) (kHz) (kHz) Reimer et al(1980) 8.0–32.0 22.0–27.0 3.0–5.0 Gleason et al(1987) 8.0–15.0 25.0–30.0 – Wu et al(1996) 8.0–10.0 34.0–39.0 4.0–6.0 ” 2.0–3.0 47.0–53.0 3.0–6.0
In summary, the broad and the narrow line widths for both the models studied here lie within the range of experimental values. The large value of the broad line width for high concentration model can be understood in terms of the presence of several large clusters with hydrogen-hydrogen separation between 1.6 Å to 2.4 Å. Our results suggest that the shape and the width of the resonance curve can be approximated by a Gaussian lineshape at high concentration. However, at low concentration the shape begins to deviate from an ideal Gaussian toward a narrow shape, which can be approximated by a truncated Lorentzian distribution provided that the microstructure is dominated by dilute environment. However, in the presence of a strong inhomogeneous distribution of hydrogen atoms, it is difficult to quantify the shape of the resonance curve via single distribution, and to obtain the line width from thereof. A more convenient approach in this case is to describe the microstructure separately by regions of clustered and dilute environment, and to compute the width originating from each of these regions.
6 Conclusion
The distribution of hydrogen atoms in amorphous silicon is studied at low and high concentration (of hydrogen) starting from two realistic models of hydrogenated amorphous silicon. Hydrogen atoms are found to be distributed in a dilute or sparse and a dense or clustered environment in the silicon matrix. At low concentration, the microstructure is characterized by the presence of a few small clusters (4–7 H atoms) in the background of a sparse distribution of hydrogen. On the other hand, the microstructure is found to be strongly inhomogeneous at high concentration along with the presence of a few large and several small clusters. A remarkable feature of the microstructure is the presence of mono- and divacancy both at low and high concentration. These vacancies are realized in the models as a built-in or an inherent feature and are not incorporated by hand during model building. The presence of such vacancies has been recently observed in experiments on hydrogenated amorphous silicon samples obtained via thermal plasma techniques. The widths of the NMR spectra of the model networks are calculated from a knowledge of the distribution of hydrogen in the network using the Van Vleck moments. The narrow and the broad line widths of the spectra for the low concentration model are found to be in the range of 3–6 kHz and 19–25 kHz, whereas the corresponding values for the high concentration model lie between 5.9–6.4 kHz and 34.0–48.0 kHz, respectively. These results are in excellent agreement with experimental data obtained from the NMR and the multiple-quantum NMR studies.
References
References
- [1] Chittick R C, Alexander J H and Sterling H F 1969 J. Electrochemical Soc. 116 77
- [2] Carlson D E and Wronski C R 1976 Appl. Phys. Lett. 28 671
- [3] Snell A J, Mackenzie K D, Spear W E, LeComber P G and Hughes A J 1981 Appl. Phys. 24 357
- [4] Yaniv Z, Hansell G, Vijan M and Cannella V 1984 Proc. MRS Symp. 33 293
- [5] Hack M, Shaw J G and Shur M 1988 Proc. MRS Symp. 118 207
- [6] Ovshinsky S R 1968 Phys. Rev. Lett. 21 1450
- [7] Owen A E, LeComber P G, Spear W E and Hajto J 1983 J. Non-Cryst. Solids 59-60 1273
- [8] Takeda T and Sano S 1988 Proc. MRS Symp. 118 399
- [9] Street R A 1991 Hydrogenated Amorphous Silicon (Cambridge Solid State Science Series)
- [10] Morigai K 1999 Physics of Amorphous Semiconductors (Imperial College Press)
- [11] Staebler D L and Wronski C R 1977 Appl. Phys. Lett. 31 292
- [12] Stutzmann M, Jackson W B and Tsai C C 1985 Phys. Rev. B 32 23
- [13] Pantelides S T 1987 Phys. Rev. B 36 3479
- [14] Gleason K K, Petrich M A and Reimer J A 1987 Phys. Rev. B 36 3259
- [15] Reimer J A and Vaughan R W 1980 Phys. Rev. Lett.44 193
- [16] Baum J, Gleason K K, Pines A, Garroway A N and Reimer J A 1986 Phys. Rev. Lett. 56 1377
- [17] Wu Y, Stephen J T, Han D X, Rutland J M, Crandall R S and Mahan A H 1996 Phys. Rev. Lett.77 2049
- [18] Hsu K C and Hwang H L 1992 Appl. Phys. Lett. 61 2075
- [19] Carlos W E and Taylor P C 1982 Phys. Rev. B 26 3605
- [20] Manfredotti C, Fizzotti F, Boero M, Pastrino P, Polesllo P and Vittone E 1994 Phys. Rev. B 50 18046
- [21] Ouwens J D and Schropp R E I 1996 Phys. Rev. B 54 17759
- [22] Chakraborty S and Drabold D A 2009 Phys. Rev. B 79 115214
- [23] Drabold D A, Abtew T A, Inam F and Pan Y 2008 J. Non-Cryst. Solids 354 2149
- [24] Timilsina R and Biswas P 2010 Phys. Status Solidi A 207 609-612
- [25] Kim E, and Lee Y H 1995 Phys. Rev. B 51 5429
- [26] Kim E, Lee Y H, Chen C and Pang T 1999 Phys. Rev. B 59 2713
- [27] Zhang S B and Branz H M 2001 Phys. Rev. Lett.87 105503
- [28] Lucovsky G, Nemanich R J and Knights J C 1979 Phys. Rev. B 19 2064
- [29] Smets A H M, Kessels W M M and Sanden M C M van de 2003 App. Phys. Lett. 82 1547
- [30] Hoven G N van den, Liang Z N, Niesen L and Custer J S Phys. Rev. Lett.68 3714
- [31] Mahan A H, Xu Y, William D L, Beyer W, Perkins J D, Vanacek M, Gedvillas L M and Nelson B P 2001 J. Appl. Phys. 90 5038
- [32] Carlos W E and Taylor P C 1982 Phys. Rev. B 25 1435
- [33] Boyce J B and Stutzmann M 1985 Phys. Rev. Lett. 54 562
- [34] Löhneysen H v and Schink H J 1984 Phys. Rev. Lett. 52 549
- [35] Graebner J E, Golding B and Allen L C 1984 Phys. Rev. Lett. 52 553
- [36] Biswas P, Tafen D N and Drabold D A 2005 Phys. Rev. B 71 054204
- [37] Biswas P, Atta-Fynn R and Drabold D A 2007 Phys. Rev. B 76 125210
- [38] Ordejon P, Artacho E and Soler J M 1996 Phys. Rev. B 53 R10441
- [39] Abragam A 1983 Principles of Nuclear Magnetism (Oxford University Press, London)
- [40] Vleck J H V 1948 Phys. Rev. 74 1168
- [41] It may be noted that the analytical expression for the fourth moment given in reference [39] cannot be employed to calculate the same for an arbitrary distribution of spins in a disordered network. The expression is valid only for crystalline lattices at high concentration of spins. For reasons beyond our understanding, many authors still refer to this in the context of amorphous networks.
- [42] Mehring M 1983 Principles of High Resolution NMR in solid (Springer-Verlag Berlin Heidelberg New York)