Shot noise limited characterization of femtosecond light pulses
Probing the evolution of physical systems at the femto- or attosecond timescale with light requires accurate characterization of ultrashort optical pulses. The time profiles of such pulses are usually retrieved by methods utilizing optical nonlinearities, which require significant signal powers and operate in a limited spectral rangeTrebino_Review_of_Scientific_Instruments97 ; Walmsley_Review_09 . We present a linear self-referencing characterization technique based on time domain localization of the pulse spectral components, operated in the single-photon regime. Accurate timing of the spectral slices is achieved with standard single photon detectors, rendering the technique applicable in any spectral range from near infrared to deep UV. Using detection electronics with about ps response, we retrieve the temporal profile of a picowatt pulse train with fs resolution, setting a new scale of sensitivity in ultrashort pulse characterization.
Complete characterization of an optical pulse implies the knowledge of its time profile, or, equivalently, its spectrum and the spectral phase. Despite the rapid progress of detection electronics Real_time_optical_waveform_measurement_NatPhot2010 , direct measurement of a subpicosecond time profile remains a difficult task. The spectral phase can be reconstructed from the interference with a known coherent reference pulsePhasometer_Dan_JOSAB97 . Usually, however, such reference is unavailable, and the pulse shape retrieval requires a self-referencing technique.
Self-referenced characterization of an ultrashort pulse is usually performed by interacting it with its replica in a nonlinear optical medium. During the last two decades nonlinear optical characterization techniques such as FROGTrebino_FROG_JOSAA93 and SPIDERSPIDER_OptLett98 have become a standard tool in ultrafast research. Employing optical nonlinearities, however, imposes substantial limitations on power, spectral range and complexity of the characterized pulseTrebino_book_2002 .
These difficulties stimulated attempts to develop spectral phase retrieval methods using only linear optics and “slow” detectors. The ability to characterize pulses with a temporal resolution significantly better than the detector response is intimately related, as in precision spectroscopy, to the system noise characteristics. Thus, while there are several approaches that allow for reliable picosecond waveform reconstruction Walmsley_Review_09 ; Linear_characterization_review_Dorrer_JOSAB2008 ; Linear_Spectrogrrams_Reid_Harvey_2007IPTL ; Sonogram_megahertz_genrator_IM95 , few works have demonstrated linear optical characterization with femtosecond resolution, whether by spectral shearingElectroOptic_Modulator_200fs_Kang_Dorrer_OL2003 , time resolvedKockaert_StreakCamera_JQE04 interferometry, or directSonogram_reflectometry_Moon_PhotTecLett2009 or cross correlationPrein_integrated_detector_OC96 sonogram measurements. In all these, the extracted quantity is the derivative of the spectral phase with respect to frequency . This can be thought of as the arrival time of a spectral slice of a pulse, provided that the slice is narrow enough so that the phase within it can be approximated by a linear functionChilla_Martinez_SHG_Gating_OL91 . The best reported temporal resolution in linear chracterization was of fs at a power level of mwatt Prein_integrated_detector_OC96 . All linear methods significantly fall behind the few nanowatt sensitivity recently demonstrated in nonlinear characterizationUltralow_Power_Frog_Poled_Crystal_JOSAB08 . Yet, as we show below, this is not a true limitation of linear characterization.
In this Letter we demonstrate a linear self-referencing ultrashort pulse characterization technique with shot noise limited temporal resolution. The technique relies on precise timing of spectral slices using photon counting instrumentation. We take advantage of the fact that, depending on the signal to noise ratio, the timing error can be much smaller than the detector response time. For a train of identical pulses, the signal to noise ratio can be improved by averaging over many pulses. The overall resolution then increases as , where is the number of photons detected (shot noise resolution scaling). Utilizing a differential measurement scheme with the signal and the reference pulses coupled into the same detector, we demonstrate the uncertainty scaling down to few femtoseconds. The principle of converting timing accuracy into temporal resolution is analogous to superresolution microscopy techniques relying on spatial localization of individual fluorophores Nanometer_Localization_Thompson02BJ ; PALM_Betzig_Science2006 ; STORM_NatMet06 ; SubNanometer_Localization_Chu_Nature2010 .
We implemented this method using a fast single photon avalanche photodiode (idQuantique id100) for signal detection and a time correlated single photon counting (TCSPC) module (PicoHarp 300) for electric pulse timing. The ability of TCSPC electronics to detect delays as large as few nanoseconds allowed for very large temporal dynamic range. The layout of our setup is presented in Fig. 1. The FWHM instrument response was measured to be about ps. Spectral slices were selected by a 4f pulse shaperWeiner_RSI2000 with a mobile slit in the Fourier plane. At every slit position, the data was collected for s; the spectrum was scanned several times to achieve the desired integration time. For every slice, we generated a histogram of arrival times of the signal relative to the trigger pulse. The arrival time was obtained by finding the centroid of the histogram peak (see Supplementary Section 1 for details of the data treatment).
The femtosecond relative delays between the spectral components are much smaller than the systematic shifts induced by the intensity dependence of the detector response and the drifts of the centroid due to temperature fluctuations. To overcome this difficulty, we introduced another reference beam: a delayed replica of the original pulse was directed into the detector along with the signal beam. Since the photon flux was lower than the saturation threshold, the detector was randomly activated by photons coming from one of the two beams. The arrival time of each spectral component was then given by the relative delay of the two corresponding peaks in the histogram. An Allan variance plot, demonstrating the measurement timing error as a function of the integration time for a single peak and for the interval between the two peaks is shown in Fig.1 b. While the unreferenced measurement deviates from the scaling by an order of magnitude already at s integration time, the relative delay measurement remains shot noise limited up to seconds of integration, corresponding to a sub-cycle standard deviation of fs.
We first tested our setup by characterizing test pulses from a Ti:Sapphire mode-locked oscillator. We retrieved the 85 fs transform limited laser output, as well as a chirped pulse obtained by passing it through a 6” slab of F3 glass. For comparison, the same pulses were characterized by a second harmonic FROG setup utilizing a m BBO crystal. For the linear measurement, the characterized beam was attenuated to about photon per pulse (approximately pW), leading to detector counts per second. The integration time was s per data point. Prior to the measurements, a calibration curve accounting for any uncompensated dispersion in the setup was recorded using a transform limited pulse.

The measured spectral component delays with and without the glass slab are presented in Fig. 2. The resolution of the measurements, estimated by calculating the standard deviation in the range to nm after subtraction of the linear trend, was fs. for the glass measurement and fs for the transform limited pulse. These values are in good agreement with the scaling of resolution discussed above (see also Supplementary Section 1). As expected, the plots show linear delay dependence on wavelength, with the slope of fs/nm. The 10% systematic deviation from the results of the FROG measurements (fs/nm) and from Sellmeier equation for the F3 glassSchott (fs/nm), which are also shown in Fig. 2 can be attributed to a dependence of the calibration curve on the exact alignment of the beam into the detector. This coupling sensitivity is probably due to the fact that in our detector the entrance aperture is connected to the actual APD by a short length of a multimode fibre. The temporal pulse profiles reconstructed from our measurement and from the FROG data are shown in Supplementary Fig.2.
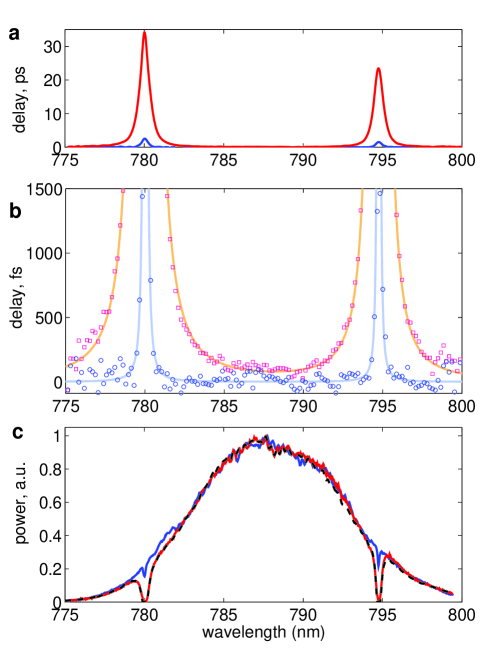
The system’s ability to reconstruct complicated pulses was tested by passing the beam through a hot Rb vapor cell. Rubidium has two narrow absorption lines in the relevant spectral range, at 780 and 795 nm. At large optical densities, achieved by heating the cell, the transmitted pulses are distorted by the resonant lines dispersion profile. The resulting complex pulses contain temporally extended tails, which make their nonlinear optical characterization challenging. Each resonance modifies the electric field of the pulse multiplying it by a factor of , where is the inverse pressure broadened linewidth, is the optical density and is the frequency detuning Dan_Nirit_Rubidium_PRL02 . The corresponding spectral slice delay is then . The results of the measurements are presented in Fig. 3. The spectral resolution of the system was set to nm, thus the observed relative delays were weighted averages of the true delays over that range. The spectral delay measurements were complemented by a higher resolution absorbtion spectrum measurements shown in Fig3c. At room temperature, no effect is observed. At 100℃ the delay peaks around the two resonances are clearly visible, although the shape of the delay peaks is dominated by the instrument response. As the temperature of the cell is increased to ℃, the delay in the Lorentzian tails of the above profile becomes significant and is clearly observed. According to the equations above, the magnitude of the tails of the spectral delay curve is , while the magnitude of the Lorentzian tails of absorbtion lines in the transmitted spectrum (shown in Fig 3c) can be written as . Extracting the two coefficients for the nm resonance from the ℃ data (see Supplementary Section 4) and comparing them gives an estimate of self-broadened resonance linewidth of GHz, which is in reasonable agreement with the spectroscopic data on Rb pressure broadeningRb_self_broadening_1979OptCom . The maximal delays measured in this experiment exceeded ps, corresponding to a temporal dynamic range of about .
While the above experiments demonstrate the possibility of characterization of ultrashort pulses with fs resolution with just a few picowatts of signal power, the performance of the method is not limited by these values. The maximal resolution and sensitivity achievable in this approach are determined by the integration time, which, in turn, is limited by the stability of the characterization setup and of the source itself. This potentially enables complete characterization of ultrashort scattering from microscopic sources, such as single molecules or nanoparticles, a regime relevant for coherent nonlinear microspectroscopy Nirit_Dan_SinglePulseCars_Nature02 ; CARS_microscopy_Xie_PRL99 .
The integration time necessary to achieve a given level of temporal resolution can be reduced by using an array of fast detectors, either proportional or single photon counting, for spectrally multiplexed measurements. Another possible direction that can be explored is the characterization of ultrashort pulses in the UV and XUV range. The accumulative nature of this method makes it potentially suitable for characterization of attosecond pulse sources with megahertz repetition ratesPlasmon_Array_High_Harmonic_Generation_2008Natur .
In conclusion, we presented and demonstrated experimentally a self-referencing ultrashort pulse characterization technique that combines the single-photon sensitivity and versatility of linear detection with the temporal resolution previously achieved only by nonlinear optical methods. This technique can become a potent tool for ultrafast light sources characterization and for the analysis of the fast dynamics of microscopic physical systems.
The authors would like to acknowledge financial support by the Israeli Ministry of Science Tashtiyyot program and by the Crown center of photonics. O.R. acknowledges support by the Converging technologies fellowship of the Israeli Ministry of Science. O.S. acknowledges support by the Adams fellowship program.
References
- (1) Trebino, R. DeLong, K. W. Fittinghoff, D. N. Sweetser,J. N. Krumbügel,M. A. Richman,B. A. and Kane,D. J. Measuring ultrashort laser pulses in the time-frequency domain using frequency-resolved optical gating. Rev. of Sci. Inst., 68(9):3277–3295, 1997.
- (2) Walmsley,I. A. and Dorrer,C. Characterization of ultrashort electromagnetic pulses. Adv. Opt. Photon., 1(2):308–437, 2009.
- (3) Fontaine,N. K. Scott,R. P. Zhou,L. Soares,F. M. Heritage,J. P. and Yoo, S. J. B. Real-time full-field arbitrary optical waveform measurement. Nature Photonics, February 2010.
- (4) Meshulach,D. Yelin,D. and Silberberg,Y. Real-time spatialspectral interference measurements of ultrashort optical pulses. J. Opt. Soc. Am. B, 14:2095–2098, August 1997.
- (5) Trebino,R. and Kane,D. J. Using phase retrieval to measure the intensity and phase of ultrashort pulses: frequency-resolved optical gating. J. Opt. Soc. Am. A, 10:1101–1111, May 1993.
- (6) Iaconis,C. and Walmsley, I.A. Spectral phase interferometry for direct electric-field reconstruction of ultrashort optical pulses. Opt. Lett., 23(10):792–794, 1998.
- (7) Trebino, R. editor. Frequency - resolved optical gating : The Measurement of ultrashort laser pulses. Kluwer Academic, 2002.
- (8) Dorrer, C. and Kang, I. Linear self-referencing techniques for short-optical-pulse characterization. J. Opt. Soc. Am. B, 25(6):A1–A12, 2008.
- (9) Reid,D. and Harvey,J. Linear Spectrograms Using Electrooptic Modulators. IEEE Phot. Tech. Lett., 19:535–537, 2007.
- (10) Mori,K. Morioka,T. and Saruwatari,M. Ultrawide spectral range group-velocity dispersion measurement utilizing supercontinuum in an optical fiber pumped by a 1.5 mu;m compact laser source. IEEE Trans. Inst. Meas. , 44(3):712 –715, jun 1995.
- (11) Kang,I. Dorrer,C. and Quochi,F. Implementation of electro-optic spectral shearing interferometry for ultrashort pulse characterization. Opt. Lett., 28:2264–2266, November 2003.
- (12) Kockaert,P. Haelterman,M. Emplit,P. and Froehly,C. Complete characterization of (ultra)short optical pulses using fast linear detectors. IEEE J. Sel. Top. Quant. Elec., , 10(1):206–212, Jan.-Feb. 2004.
- (13) Moon, S. and Kim, D.Y. Reflectometric fiber dispersion measurement using a supercontinuum pulse source. IEEE Phot. Tech. Lett. , 21(17):1262 –1264, sept.1, 2009.
- (14) Prein,S. Diddams,S. and Diels,J.-C. Complete characterization of femtosecond pulses using an all-electronic detector. Opt. Comm., 123:567–573, February 1996.
- (15) Chilla,J. L. A. and Martinez, O. E. Direct determination of the amplitude and the phase of femtosecond light pulses. Opt. Lett., 16(1):39–41, 1991.
- (16) Miao,H. Yang,S.-D. Langrock,C. Roussev,R. V. Fejer,M. M. and Weiner,A. M. Ultralow-power second-harmonic generation frequency-resolved optical gating using aperiodically poled lithium niobate waveguides. J. Opt. Soc. Am. B, 25(6):A41–A53, 2008.
- (17) Thompson,R. E. Larson,D. R. and Webb, W. W. Precise nanometer localization analysis for individual fluorescent probes. Biophys. J, 82:2775–2783, 2002.
- (18) Betzig,E. Patterson,G. H. Sougrat,R. Lindwasser,O. W. Olenych,S. Bonifacino,J. S. Davidson,M. W. Lippincott-Schwartz,J. and Hess,H. F. Imaging Intracellular Fluorescent Proteins at Nanometer Resolution. Science, 313(5793):1642–1645, 2006.
- (19) Rust,M. J. Bates,M. and Zhuang,X.. Sub-diffraction-limit imaging by stochastic optical reconstruction microscopy (storm). Nature Methods, 3:793–796, 2006.
- (20) Pertsinidis,A. Zhang,Yu. and Chu, S. Subnanometre single-molecule localization, registration and distance measurements. Nature, Advance Online Publication, 2010.
- (21) A. M. Weiner. Femtosecond pulse shaping using spatial light modulators. Rev. of Sci. Inst., 71:1929–1960, May 2000.
- (22) Optical Glass. Schott Glass Technologies Inc., Duryea, Pennsylvania, 1984.
- (23) Dudovich,N. Oron,D. and Silberberg,Y. Coherent Transient Enhancement of Optically Induced Resonant Transitions. Phys. Rev. Lett., 88(12):123004–+, March 2002.
- (24) Weber,K.-H. and Niemax,K. Self-broadening and shift of Doppler-free two-photon lines of Rb. Opt. Comm., 31:52–56, October 1979.
- (25) Dudovich,N. Oron,D. and Silberberg,Y. Single-pulse coherently controlled nonlinear Raman spectroscopy and microscopy. Nature, 418:512–514, August 2002.
- (26) Zumbusch,A. Holtom,G. R. and Xie, X. S. Three-dimensional vibrational imaging by coherent anti-stokes raman scattering. Phys. Rev. Lett., 82(20):4142–4145, May 1999.
- (27) Kim,S. Jin,J. Kim,Y.-J. Park,I.-Y. Kim,Y. and Kim,S.-W. High-harmonic generation by resonant plasmon field enhancement. Nature, 453:757–760, June 2008.